ISSN 1 5 1 7 - 7 0 7 6
Revista Matéria, v. 15, n. 2, pp. 117-123, 2010. http://www.materia.coppe.ufrj.br/sarra/artigos/artigo11205
Diameter dependence of tensile strength by Weibull analysis: Part II jute
fiber
A. B. Bevitori; I.L.A. Da Silva; F.P.D. Lopes; S.N. Monteiro
State University of the Northern Rio de Janeiro, UENF, Advanced Materials Laboratory, LAMAV; Av. Alberto Lamego, 2000, CEP.: 28013602, Campos dos Goytacazes, Brazil.
e-mail: [email protected] ; [email protected]
ABSTRACT
The jute fiber is one of the strongest lignocellulosic fibers with applications ranging from simple items such as fabrics and ropes to engineering composites for automobile parts and building panels. Like other lignocellulosic fibers, the jute may have an inverse strength dependence with its diameter. In principle, thinner jute fiber could be comparatively stronger and consequently more effective as a composite reinforcement. Therefore, an attempt to correlate the jute fiber strength obtained in tensile test with its corresponding diameter, precisely measured by means of a profile projector, was carried out. A Weibull statistical analysis confirmed the inverse dependence between the jute fiber tensile strength and the corresponding fiber diameter. Scanning electron microscopy observation of the fracture of selected ruptured fiber revealed possible mechanisms that could justify the strength/diameter inverse dependence.
Keywords: Jute fiber, tensile properties, diameter dependence, Weibull analysis, fracture study.
1 INTRODUCTION
In recent years a growing increase in the use of natural materials is taking place in engineering application motivated by worldwide events. These are the generalized pollution due to discard of non-degradable synthetic materials and climate change attributed to CO2 emission during their production [1].
The need to replace petroleum-based energy systems, used in the production of synthetic materials, by other environmentally friendly alternatives is also a strong motivation in favor of natural materials [2]. Additionally, most natural materials are less expensive than their synthetic counterparts and provide societal advantages to low income communities or developing countries in which they are produced [3].
An important example is that of the natural fiber, mainly those lignocellulosic obtained from vegetable, that have been traditionally used in simple items such as baskets, ropes, clothes, carpets’, roofing’s, etc. These lignocellulosic fiber are currently being applied as reinforcement in composite materials [3, 8] for automobile parts as well as building construction panels and furniture. In fact, there is nowadays a clear tendency towards the substitution of lignocellulosic fibers for glass fiber in polymer composites [3]. However, the poor adhesion to polymer matrix as well as the heterogeneous dimensions and non-uniform properties of the natural fibers are drawbacks to their use as composite reinforcement [3-8].
In practically all regions of our planet in which cellulose-based plants can grow, hundreds of different lignocellulosic fiber can be found. Among these, the jute fiber is one of the most investigated an industrially used in composites owing to its high specific strength, impact resistance and relatively low cost [10]. A large number of works has been dedicated to the characteristic and properties of the jute fiber alone and its reinforced composites [11-15], just to mention a few of the most recent publications.
2 EXPERIMENTAL PROCEDURE
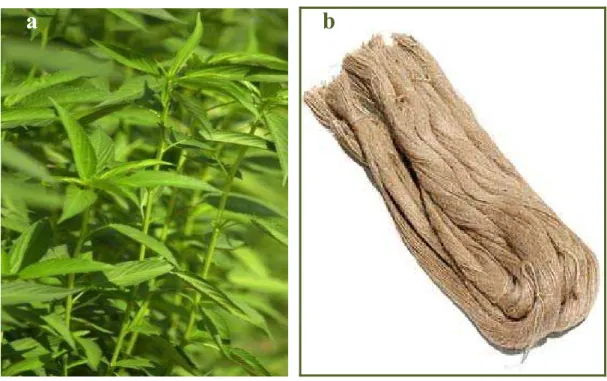
The jute fibers investigated in this work were commercially supplied by the Brazilian firm SISALSUL. Figure 1 illustrates the typical jute plant and a bundle of fibers extracted from its stem.
a
b
Figure 1: (a) Typical jute plant; (b) bundle of fibers extracted from the stem.
The lot of as-received jute fibers displayed a noticeable variation in diameter. The distribution of fiber diameter has been recently presented [15]. Here, it is worth mentioning that a randomly selected group of 100 jute fibers presented diameters in a range of 0.04 to 0.18 mm with a mean value of 0.082 mm. Based on this range of diameters, seven 0.02 mm equally spaced intervals were considered. For each interval, about 20 fibers were selected through profile projector average measurements along the fiber length in five distinct locations.
All selected fibers were individually tensile tested in a model 5582 Instron machine at 25 ± 2o
C. Especial tensile grips and holding procedures were used to avoid both slippage and damage to the fiber. The tensile test strain rate was 4.2 x 10⁻⁴s-1. The values obtained for the tensile strength corresponding to each diameter interval were statistically interpreted using the computer program Weibull Analysis.
In order to complement this investigation on the diameter dependence of the tensile strength, the fractures of representative ruptured fibers were analyzed. Fracture samples for each corresponding diameter interval fibers, were attached with conducting carbon tape to a metallic support and then gold sputtered to be observed by scanning electron microscopy, (SEM), in a model SSX-550 Shimadzu equipment operating with secondary electrons at an accelerating voltage of 15kV.
3 RESULTS AND DISCUSSION
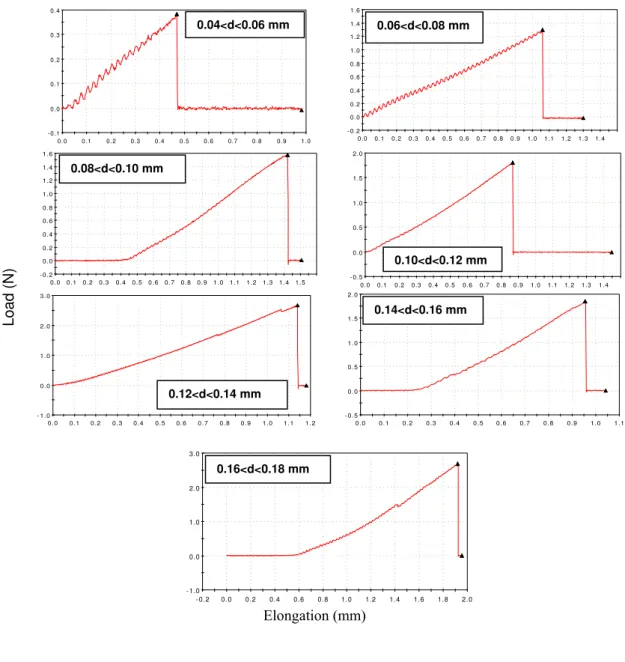
The digital recorded data obtained from the Instron machine allowed to construct representative load
Load (N) - 0 . 1
0 . 0 0 . 1 0 . 2 0 . 3 0 . 4
0 . 0 0 . 1 0 . 2 0 . 3 0 . 4 0 . 5 0 . 6 0. 7 0 . 8 0. 9 1 . 0
- 0 . 2 0 . 0 0 . 2 0 . 4 0 . 6 0 . 8 1 . 0 1 . 2 1 . 4 1 . 6
0 . 0 0 . 1 0 . 2 0 . 3 0 . 4 0 . 5 0 . 6 0 . 7 0 . 8 0 . 9 1 . 0 1 . 1 1 . 2 1 . 3 1 . 4
- 0 . 2 0 . 0 0 . 2 0 . 4 0 . 6 0 . 8 1 . 0 1 . 2 1 . 4 1 . 6
0 . 0 0 . 1 0 . 2 0 . 3 0 . 4 0 . 5 0 . 6 0 . 7 0 . 8 0 . 9 1 . 0 1 . 1 1 . 2 1 . 3 1 . 4 1 . 5
- 0 . 5 0 . 0 0 . 5 1 . 0 1 . 5 2 . 0
0. 0 0. 1 0 . 2 0 . 3 0 . 4 0 . 5 0 . 6 0 . 7 0 . 8 0 . 9 1 . 0 1 . 1 1 . 2 1 . 3 1 . 4
- 1 . 0 0 . 0 1 . 0 2 . 0 3 . 0
0 . 0 0 . 1 0 . 2 0 . 3 0 . 4 0 . 5 0 . 6 0 . 7 0 . 8 0 . 9 1 . 0 1 . 1 1 . 2
- 0 . 5 0 . 0 0 . 5 1 . 0 1 . 5 2 . 0
0 . 0 0 . 1 0 . 2 0 . 3 0 . 4 0 . 5 0 . 6 0 . 7 0 . 8 0 . 9 1 . 0 1 . 1
- 1 .0 0 .0 1 .0 2 .0 3 .0
- 0 . 2 0 . 0 0 . 2 0 . 4 0 . 6 0 . 8 1 . 0 1 .2 1 . 4 1 . 6 1 . 8 2 . 0
Elongation (mm)
0.04<d<0.06 mm 0.06<d<0.08 mm
0.08<d<0.10 mm
0.10<d<0.12 mm
0.14<d<0.16 mm
0.12<d<0.14 mm
0.16<d<0.18 mm
Figure 2: Typical tensile load vs. diameter of jute fibers for the distinct intervals.
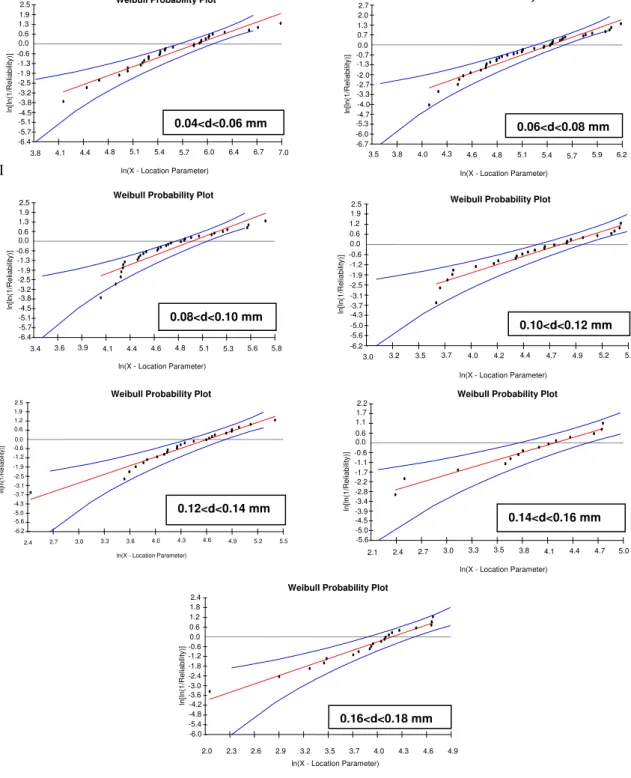
Tensile results such as the ones exemplified in Figure 2 permitted the evaluation of the tensile strength for every fiber investigated. These values of strength were analyzed by the Weibull statistic method, in each of the seven diameter intervals [15]. Figure 3 shows the logarithmic graphs of the reliability vs.
location parameter, also known as the Weibull graphs. In this figure the graphs are unimodal with just one straight fitting for all points in the same diameter interval. This indicates that every jute fiber related to each one of the seven intervals belongs to a group with same mechanical behavior.
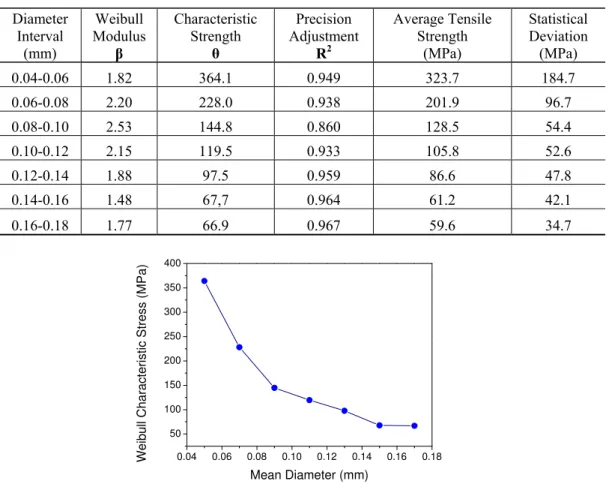
Table 1 presents the values of the Weibull parameter associated with the statistical characteristic of each diameter interval. In this table, the parameter θ in the statistical analysis of this work represents the most characteristic tensile strength. The adjustment parameter R² indicates the precision degree of the statistical analysis.
I
Weibull Probability Plot Weibull Probability Plot
Figure 3: Weibull graphs for the different intervals.
The corresponding values of R² in Table 1 statistically support the inverse correlation between θ and
d. This correlation can be mathematically described as the following hyperbolic equation for jute fiber
θ = 21/d – 76 (1)
Another Weibull parameter of relevance is the average tensile strength,
σ
m. The interval of
σ
m and its deviation encompasses the corresponding values of θ. In a normal distribution of tensile strength,Weibull Probability Plot
ln[ ln( 1/R e liab ility )]
ln(X - Location Parameter) -0.6 -1.2 -1.8 -2.4 -3.0 -3.6 -4.2 -4.8 -5.4 -6.0 0.0 0.6 1.2 1.8 2.4
2.0 2.3 2.6 2.9 3.2 3.5 3.7 4.0 4.3 4.6 4.9 0.16<d<0.18 mm
Weibull Probability Plot
ln [ln (1 /R e lia b ili ty )]
ln(X - Location Parameter) -0.6 -1.2 -1.9 -2.5 -3.1 -3.7 -4.3 -5.0 -5.6 -6.2 0.0 0.6 1.2 1.9 2.5
2.4 2.7 3.0 3.3 3.6 4.0 4.3 4.6 4.9 5.2 5.5
0.12<d<0.14 mm
Weibull Probability Plot
ln[ ln( 1/R e liab ility )]
ln(X - Location Parameter) -0.6 -1.1 -1.7 -2.2 -2.8 -3.4 -3.9 -4.5 -5.0 -5.6 0.0 0.6 1.1 1.7 2.2
2.1 2.4 2.7 3.0 3.3 3.5 3.8 4.1 4.4 4.7 5.0 0.14<d<0.16 mm
Weibull Probability Plot
ln[ ln( 1/R e liab ility )]
ln(X - Location Parameter) -0.6 -1.2 -1.9 -2.5 -3.1 -3.7 -4.3 -5.0 -5.6 -6.2 0.0 0.6 1.2 1.9 2.5
3.0 3.2 3.5 3.7 4.0 4.2 4.4 4.7 4.9 5.2 5.4 0.10<d<0.12 mm
Weibull Probability Plot
ln[ ln( 1/R e liab ility )]
ln(X - Location Parameter) -0.6 -1.3 -1.9 -2.5 -3.2 -3.8 -4.5 -5.1 -5.7 -6.4 0.0 0.6 1.3 1.9 2.5
3.4 3.6 3.9 4.1 4.4 4.6 4.8 5.1 5.3 5.6 5.8 0.08<d<0.10 mm ln[ ln( 1/R e liab ility )]
ln(X - Location Parameter) -0.6 -1.3 -1.9 -2.5 -3.2 -3.8 -4.5 -5.1 -5.7 -6.4 0.0 0.6 1.3 1.9 2.5
3.8 4.1 4.4 4.8 5.1 5.4 5.7 6.0 6.4 6.7 7.0 0.04<d<0.06 mm ln[ ln( 1/R e liab ility )]
ln(X - Location Parameter) 2.0 2.7 -0.7 -1.3 -2.0 -2.7 -3.3 -4.0 -4.7 -5.3 -6.0 -6.7 0.0 0.7 1.3 0.06<d<0.08 mm
5.1 5.4 5.7 4.3
within a given diameter interval, the values of
σ
m, θ and the arithmetic average of the strength should coincide.
Table 1: Weibull parameter σn the jute fiber strength in different diameter interval.
Diameter Interval
(mm)
Weibull Modulus
β
Characteristic Strength
θ
Precision Adjustment
R2
Average Tensile Strength
(MPa)
Statistical Deviation
(MPa)
0.04-0.06 1.82 364.1 0.949 323.7 184.7
0.06-0.08 2.20 228.0 0.938 201.9 96.7
0.08-0.10 2.53 144.8 0.860 128.5 54.4
0.10-0.12 2.15 119.5 0.933 105.8 52.6
0.12-0.14 1.88 97.5 0.959 86.6 47.8
0.14-0.16 1.48 67,7 0.964 61.2 42.1
0.16-0.18 1.77 66.9 0.967 59.6 34.7
0.04 0.06 0.08 0.10 0.12 0.14 0.16 0.18 50
100 150 200 250 300 350 400
Weib
u
ll Ch
ara
c
ter
is
tic
Stre
ss
(MPa)
Mean Diameter (mm)
Figure 4: Variation of the characteristic stress with the mean diameter for each interval.
Figure 5 plots
σ
m and deviations as a function of the diameter. In this figure, within the error bars, a hyperbolic inverse correlation can be adjusted betweenσ
m (MPa) and d (mm):σ
m = 20/d – 77 (2)By comparing Equations (1) and (2), it can be seen that both have very similar mathematical coefficients. It is then suggested that a hyperbolic type of equation is indeed the best statistical correlation between the jute fiber tensile strength and its diameter. Hyperbolic correlations have recently been reported for curaua, sisal and ramie [17] as well as piassava fibers [18]. The reason for this behavior is apparently related to the mechanism of tensile fracture of lignocellulosic fibers.
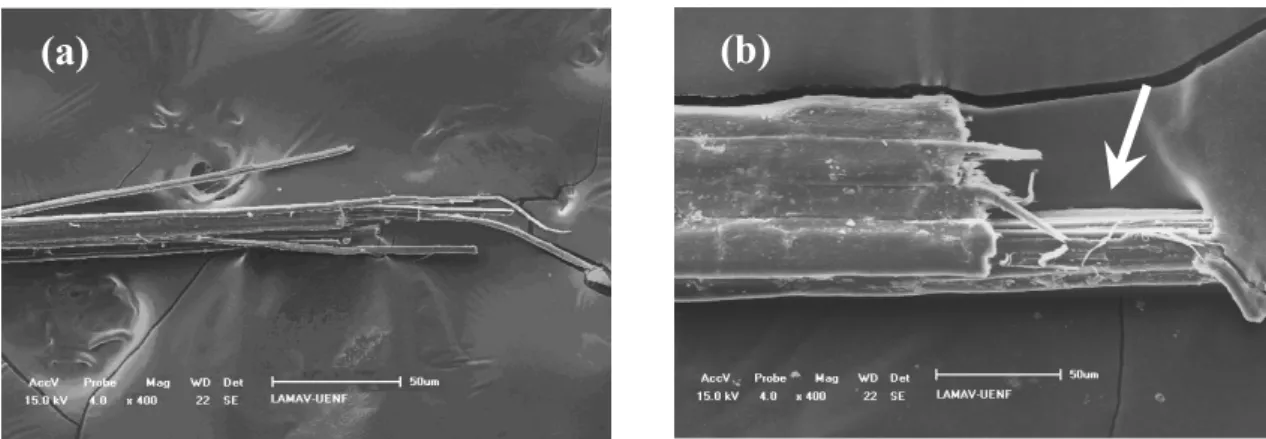
Figure 6 shows SEM fractographs of the tip of tensile-ruptured jute fibers with different diameters. It can be seen in this figure that the thinner fiber with d = 0.02 mm, Figure 6 (a), displays a fracture associated with lesser fibrils. By contrast, the thicker fiber, with d= 0.19 mm, Figure 6 (b), shows a heterogeneous fracture comprising relatively more fibrils. As a consequence, there is a higher statistical chance that the thicker jute fiber would prematurely break at lower stress than the thinner one.
fiber from which a crack may longitudinally propagate in between fibrils, see arrow in Figure 6 (b), and contribute to the earlier collapse of the fiber.
0.04 0.06 0.08 0.10 0.12 0.14 0.16 0.18 0
100 200 300 400 500
Tensile Str
ength
(M
Pa
)
Mean Diameter (mm)
Figure 5: Variation of the average tensile strength with the mean diameter for each interval.
(b)
(a)
Figure 6: SEM fractographs with same magnification of tensile-ruptured jute fibers: (a) thinner, d = 0.02 mm
and (b) thicker, d = 0.19 mm.
As a final remark, it is worth speculating that an inverse correlation between tensile strength and diameter, such as the hyperbolic in Eq (1) and (2) could in principle permit to select the thinnest jute fibers as probably the strongest alternative for reinforcing composites with improved properties.
4 CONCLUSIONS
Like in other lignocellulosic fibers, a Weibull statistical analysis of the tensile strength of jute fibers, showed an inverse correlation with their diameters. This correlation adjusts well to a hyperbolic type of equation for both the Weibull average tensile strength and the characteristic strength.
The fracture tip of the fibers revealed a mechanism of longitudinal crack propagation between fibrils before the final fiber break down. It is suggested that this mechanism would be associated with the premature rupture of a thicker fibers as compared to a thinner one with less fibrils and so explain the inverse correlation.
5 ACKNOWLEDGEMENTS
The authors thank the support to this investigation by the Brazilian agencies: CNPq, CAPES, FAPERJ.
6 REFERENCES
[2] CROCKER, J., “Natural materials innovative natural composites”, Materials Technology, v. 2-3, pp. 174-178, 2008.
[3] MONTEIRO, S.N., LOPES, F.P.D., FERREIRA, A.S., NASCIMENTO, D.C.O., “Natural fiber polymer matrix composites: cheaper, tougher and environmentally friendly”, JOM – The Member Journal of TMS, v. 61, pp. 17-22, 2009.
[4] BLEDZKI, A.K., GASSAN, J., “Composites reinforced with cellulose-based fibers”, Progress in
Polymer Science, v. 4, pp. 221-274, 1999.
[5] SAHED, D.N., JOG, J.P., “Natural fiber polymer composites: a review”, Advances in Polymer
Technology, v. 18, pp. 221-274, 1999.
[6] MOHANTY, A.K., MISHRA, M., HINRICHSEN, G., “Biofibers, biodegradable polymers and biocomposites: an overview”, Macromolecular Material And Engineering, v. 276/277, pp. 1-24, 2000.
[7] EICHHORN, S.J., BAILLIE, C.A., ZAFEIROPOULOS, N., MWAKAMBO, L.Y., ANSELL, M.P., DUFRESNE, A., “Review of current international research into cellulosic fibres and composites”,
Journal of Material Science, v. 36, pp. 2107-2113, 2001.
[8] MOHANTY, A.K., MISHRA, M., DRZAL, L.T., “Sustainable biocomposites from renewable resources: opportunities and challenges in the green material world”, Journal Polymer Environmental, v. 10, pp. 19-26, 2002.
[9] WAMBUA, P., IVENS, I., VERPOEST, I., “Natural fibers: can they replace glass and fibre reinforced plastics?”, Composites Science and Technology, v. 63, pp. 1259-1264, 2003.
[10] SATYANARAYANA, K.G., GUIMARÃES, J.L., WYPYCH, F., “Studies on lignocellulosic fibers of Brazil. Part I: Source, production, morphology, properties and applications”, Composites: Part A, v. 38, pp. 1694-1709, 2007.
[11] ACHA, B.A., REBOREDO, M.M., MARCOVICH, N.E., “Effect of coupling agents on the thermal and mechanical properties of PP-jute fabric composites”, Polymer International, v. 55, n. 9, pp. 1104-1113, 2006.
[12] MOHANTY, S., VERMA, S.K., NAYAK, S.K., “Dynamic mechanical and thermal properties of MAPE treated jute / HDPE composites”, Composite Science & Technology, v. 66, pp. 538-547, 2006. [13] DOAN, T.T.-L., GAO, S.-L., MÄDER, E., “Jute/polypropylene composites I. Effect of matrix
modification”, Composite Science Technology, v. 66, pp. 952-963, 2006.
[14] BERNAL, C., LAUKE, B., “Fracture and failure behavior of jute-reinforced polymer composites”, In: S. Fakirov and D. Bhattacharyya, Handbok of Engineering Biopolymers, Homopolymers, Blends and Composites, Cap. 11, pp. 311-333, Cincinnati, OH, USA, Hanser Gardner Publ. Inc., 2007.
[15] MONTEIRO, S.N., MARQUES, L.S., SATYANARAYANA, K.G., “Characterization of the flexural properties of polyester matrix composites reinforced with continuous jute fibers”, In: Proceedings of the Characterization of Minerals, Metals & Materials – TMS Conference 2010, Seattle WA, USA, 1-8 February 2010.
[16] MONTEIRO, S.N., “Properties and structure of Attalea funifera piassava fibers for composite reinforcement”, Journal of Natural Fibers, v. 6, n. 2, pp. 191-203, 2009.
[17] MONTEIRO, S.N., SATYANARAYANA, K.G., LOPES, F.P.D., “High strength natural fibers for improved polymer matrix composites”, Materials Science Forum, v. 638-642, pp. 961-966, 2010. [18] NASCIMENTO, D.C.O., MOTTA, L.C., MONTEIRO, S.N., “Weibull analysis of Tensile tested