ISSN 1 5 1 7 - 7 0 7 6
Revista Matéria, v. 15, n. 2, pp. 110-116, 2010. http://www.materia.coppe.ufrj.br/sarra/artigos/artigo11201
Diameter dependence of tensile strength by Weibull analysis: Part I
bamboo fiber
L.L. da Costa; R.L. Loiola; S.N. Monteiro
Advanced Materials Laboratory, LAMAV, State University of the Northern Rio de Janeiro, UENF, CEP28013-602, Campos dos Goytacazes, RJ.
e-mail: [email protected] ; [email protected] ; [email protected] ABSTRACT
Fibers stripped of from the bamboo culm by longitudinal cutting are being considered as reinforcement of polymer composites owing to environmental benefits related to their biodegradable and renewable characteristics. The manual cutting process allows bamboo fibers with different diameters to be extracted from the culm. Since a lignocellulosic fiber usually presents tensile strength dependence with its diameter, this possibility was investigated on bamboo fibers by means of the Weibull statistical analysis. It was found that the smaller the fiber diameter, the greater the tensile strength. Fracture observation of ruptured bamboo fibers by scanning electron microscopy, identified possible mechanisms associated with this inverse strength/diameter correlation.
Keywords: Bamboo fibers, tensile strength, diameter dependence, Weibull analysis.
1 INTRODUCTION
Bamboo is a well known grass-type plant with a hard and stiff stem or culm that can reach, in some species, more than 10 cm in cross section diameter and stand several meters height. Owing to its low density, approximately 0.9 g/cm3, bamboo culms have been used in house construction from scaffoldings to panels. As an abundant natural resource in tropical and temperate regions, specially in Asia and South America, bamboo is also a substitute for wood and plastics in furniture and lightweight parts of automobile [1, 2]. The cylindrical shape of the culm is, however, a limitation for its direct use in engineering systems. Consequently, research works have been conducted on bamboo fibers stripped off from the culm as reinforcement of polymer composites. [1-12]. According to SHIN et al. [3] bamboo fiber-epoxy laminates can be made into specific sizes and shapes, preserving the natural microstructural properties. These fiber composites overcome the limitation of the culm’s cylindrical macrostructure. As a further advantage, SHIN et al. [3] indicated that cracking and bioerosion caused by insect pests is prevented.
Works on the mechanical properties of polymer composites reinforced with culm-stripped bamboo fibers [3-5, 12] reported mechanical strength and modulus that could vary significantly with the amount of incorporated fiber, the type of polymeric matrix and the fiber disposition (short-cut, continuous, aligned, mat-arranged). In spite of all these efforts, no investigation on the influence of the fiber diameter has yet been carried out. Owing to the oriented lignocellulosic structure, as in other natural fibers [13-16], it is relevant to investigate how the mechanical behavior of the bamboo fibers is affected by its cross section diameter.
Depending on the specialist ability and cutting technique, the manual culm stripping off process produces bamboo fibers with different diameters. Therefore, the objective of this work was to investigate the bamboo fiber tensile strength dependence on its diameter using a Weibull statistic analysis.
2 EXPERIMENTAL PROCEDURE
and smaller (90º rotation) cross section dimensions at five locations for each fiber, was measured in a profile projector.
(a) (b) (c)
Figure 1: Bamboo trees (a), dried bamboo culm (b) and its fibers longitudinally stripped with different diameters (c).
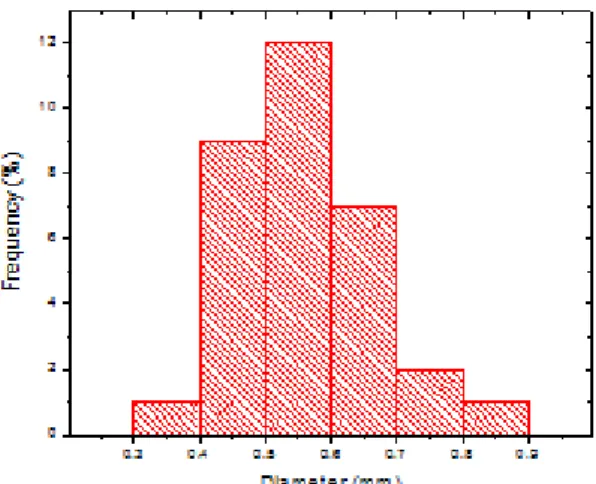
The histogram in Figure 2 shows the frequency of diameter distribution of stripped bamboo fibers used in the present work. Based on this histogram, an average diameter of 0.56 mm was calculated within the interval from 0.3 to 0.9 mm.
The as-stripped bamboo fibers, Figure 1(b), were dried in a laboratory stove at 60 C for 24 hours to remove humidity. For each interval of equivalent diameter in Figure 2, 20 fibers were selected. All these fibers were then individually tensile tested at 25 ± 2ºC in a model 5582 Instron machine. Specials grips were used to avoid both fiber slippage and damage. The test length was 8 cm and the strain rate 2.1x10⁻⁴s-1. Values obtained for the tensile strength, i.e. the ultimate stress, were statistically interpreted by means of a Weibull Analysis computer program.
The tensile-ruptured tip of some tested fibers were attached with conducting carbon tape to a metallic support and then gold sputtered for scanning electron microscopy (SEM) observation in a model SSX-550 Shimadzu equipment operating with secondary electrons accelerated at a maximum voltage of 15kV.
Figure 2: Distribution frequency for the stripped bamboo fibers equivalent diameter.
3 RESULTS AND DISCUSSION
instabilities in the deformation of heterogeneous lignocellulosic fibers. On the other hand, fibers thicker than 0.6mm show serrations associated with few larger drops along the curve. In principle, these serrations and drops could be associated with partial rupture of the bundle of fibrils that compose the bamboo structure [2]. As further discussed, it is important to mention that the thinner the bamboo fiber, the lesser fibrils it contains.
Table 1: Weibull parameters for the tensile strength of bamboo fibers associated with different diameters.
Diameter interval (mm)
Weibull Modulus, β
Characteristic Strength, θ
(MPa)
Precison Adjustment, R2
Average Strength (MPa)
Statistical Deviation (MPa)
0.35 2.965 228.0 0.8806 203.50 74.94
0.45 3.176 184.0 0.8833 164.70 56.89
0.55 4.008 159.8 0.9210 144.90 40.57
0.65 4.022 149.9 0.9651 135.90 37.94
0.75 3.111 139.3 0.8839 124.60 43.83
0.85 2.705 119.6 0.8671 106.40 42.41
Load
(N)
Elongation (mm)
0.3<d<0.4 mm 0.4<d<0.5 mm
0.5<d<0.6 mm 0.6<d<0.7 mm
0.7<d<0.8 mm 0.8<d<0.9 mm
Based on the maximum load attained in the curve, like the ones exemplified in Figure 3, the tensile strength, corresponding to the ultimate stress (
σ
m) was determined for each fiber. The values ofσ
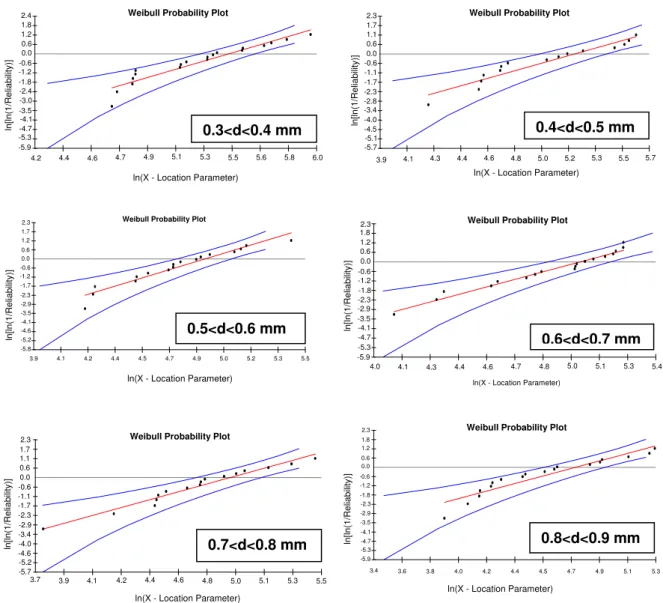
m were then statistically analyzed by means of the Weibull method for the 20 fibers associated with everyone of the six diameter intervals shown in the histogram of Figure 2. The Weibull Analysis program provided the probability plots of reliability vs. location parameter shown in Figure 4 for all diameter intervals. Here it should be noted that all plots in Figure 4 are unimodal, i.e. with just one single straight line fitting the points at each interval. This indicates similar mechanical behavior of fibers within the same diameter interval.In addition, the program also provided the corresponding characteristic stress (θ), the Weibull modulus (β) and the precision adjustment (R2) parameters. The values of these parameters as well as the average mechanical strength and associated statistical deviations, based on the Weibull distribution, are presented in Table 1.
θ (MPa) = 554/d + 63 (1)
Weibull Probability Plot Weibull Probability Plot
Figure 4: Weibull graphs for the different intervals in the histogram of Figure 2.
The variation of the characteristic stress with the average fiber diameter for each one of its intervals is presented in Figure 5. In this figure there is a tendency for the θ parameter to vary inversely with the
Weibull Probability Plot
ln(X - Location Parameter)
-0.6 -1.1 -1.7 -2.3 -2.9 -3.4 -4.0 -4.6 -5.2 -5.7 0.0 0.6 1.1 1.7 2.3
3.7 3.9 4.1 4.2 4.4 4.6 4.8 5.0 5.1 5.3 5.5
0.7<d<0.8 mm ln [ln (1 /Re lia b ility)]
Weibull Probability Plot
ln [ln (1 /Re lia b ility)]
ln(X - Location Parameter) -0.6 -1.2 -1.8 -2.3 -2.9 -3.5 -4.1 -4.7 -5.3 -5.9 0.0 0.6 1.2 1.8 2.3
3.4 3.6 3.8 4.0 4.2 4.4 4.5 4.7 4.9 5.1 5.3 0.8<d<0.9 mm
Weibull Probability Plot
ln [ln (1 /Re lia b ility)]
ln(X - Location Parameter) -0.6 -1.2 -1.7 -2.3 -2.9 -3.5 -4.1 -4.6 -5.2 -5.8 0.0 0.6 1.2 1.7 2.3
3.9 4.1 4.2 4.4 4.5 4.7 4.9 5.0 5.2 5.3 5.5 0.5<d<0.6 mm
Weibull Probability Plot
ln [ln (1 /Re lia b ility)]
ln(X - Location Parameter) -0.6 -1.2 -1.8 -2.3 -2.9 -3.5 -4.1 -4.7 -5.3 -5.9 0.0 0.6 1.2 1.8 2.3
4.0 4.1 4.3 4.4 4.6 4.7 4.8 5.0 5.1 5.3 5.4
0.6<d<0.7 mm ln [ln (1 /Re lia b ility)]
ln(X - Location Parameter)
-0.6 -1.2 -1.8 -2.4 -3.0 -3.5 -4.1 -4.7 -5.3 -5.9 0.0 0.6 1.2 1.8 2.4
4.2 4.4 4.6 4.7 4.9 5.1 5.3 5.5 5.6 5.8 6.0
0.3<d<0.4 mm ln
[ln (1 /Re lia b ility)]
ln(X - Location Parameter)
-0.6 -1.1 -1.7 -2.3 -2.8 -3.4 -4.0 -4.5 -5.1 -5.7 0.0 0.6 1.1 1.7 2.3 0.4<d<0.5 mm 5.3
4.8 5.0 5.2 5.5 5.7
4.6 4.3 4.4 4.1
stress. Furthermore, the corresponding values of β and R2, shown in Table 1, statistically support the inverse correlation between θ and the average diameter d (mm). By means of a mathematic correlation, a hyperbolic type of equation was proposed to fit the data in Figure 5.
0.3 0.4 0.5 0.6 0.7 0.8 0.9 100
120 140 160 180 200 220 240
Weibull
Char
acter
istic Stress
(MPa)
Mean Diameter (mm)
Figure 5: Variation of the characteristic stress with the mean diameter for each interval in Figure 2.
In order to analyze the physical meaning of Equation (1), the average tensile strength,
σ
m,evaluated in this work for the culm-stripped bamboo fibers was plotted as a function of the diameter in Figure 6. In this figure an apparent hyperbolic inverse correlation also exists between
σ
m and d within the errorbars (statistical deviations) and investigated limits.
σ
m = 62/d + 29 (2)Here it is important to mention that the large dispersion (error bars) in the values of the tensile strength in Figure 6 is due to the heterogeneous characteristics of any lignocellulosic fiber [18], such as the bamboo in this work. As a consequence, one could also consider a horizontal line passing within the error bars as a possible correlation between
σ
m and d. In this case, the tensile strength would not vary with thediameter. However, the variation of θ with d in Figure 5, suggests that an inverse correlation fits better the experimental results for the bamboo fibers.
It is also possible to consider that the values of
σ
m in Figure 6 are approximately constant, around100 MPa, for fiber thicker than 0.5mm. Under this consideration, only the thinner bamboo fibers, d ≤ 0.5mm, present the inverse correlation, but not necessarily hyperbolic. This should be further investigated.
0.3 0.4 0.5 0.6 0.7 0.8 0.9
40 80 120 160 200 240 280
Ten
s
ile
Str
eng
th (
M
Pa
)
Mean Diameter (mm)
Based on Equations (1) and (2) it is suggested that, as in others lignocellulosic fibers [16, 17], a hyperbolic type of mathematical equation is the best statistical correlation between the tensile strength and the diameter of culm-stripped bamboo fibers.
A SEM observation of the tip of representative tensile-ruptured fibers, shown in Figure 7, provided further evidence of a fracture mechanism that could justify the hyperbolic correlation in Equation (2). With the same magnification, the thinner fiber, Figure 7(a), shows a more uniform fracture associated with lesser fibrils. By contrast, a fiber with larger diameters, Figure 7(b), displays a relatively non-uniform fracture with participation of more fibrils. Statistically, there is always a chance that one of the many fibrils of the thicker bamboo fiber in Figure 7(b), would prematurely break and then act as a flaw to cause the fiber rupture at a lower stress as compared to the thinner fiber, Figure 7(a). In other words, the larger distribution of fibrils strength of the thicker fiber allows one of them breaking shortly than any of the fewer fibrils of a thinner fiber.
(a) (b)
Figure 7: SEM fractographs with same magnification of tensile-ruptured bamboo fibers: (a) thinner, d= 0.35mm and (b) thicker, d= 0.87mm.
As a final remark, it should be mentioned that an inverse correlation such as that in Equation (2), could allow, in practice, a selection of stronger culm-stripped thinner bamboo fibers to effectively reinforced polymer composites with improved mechanical properties.
4 CONCLUSIONS
A Weibull statistical analysis of tensile-tested manually culm-stripped bamboo fibers revealed an inverse correlation between the stress and the fiber diameter.
This correlation indicates a possible hyperbolic mathematical equation to hold, at least, for diameters below 0.6mm.
SEM observations provided evidences that a thicker bamboo fiber, with more fibrils than a thinner one, could undergo rupture at a comparatively lower stress.
Statistically, the larger distribution of fibrils mechanical resistances of the thicker fiber allows a weaker fibril to rupture shortly than any of the fewer fibrils of the thinner fiber.
5 ACKNOWLEDGEMENTS
The authors thank the support to this investigation by the Brazilian agencies: CNPq, CAPES, FAPERJ and TECNORTE/FENORTE.
6 REFERENCES
[1] CHEN, X., GUO, Q., MI, Y., “Bamboo fiber reinforced polypropylene composites: a study of the mechanical properties”, Journal Applied Polymer Science, v. 69, pp. 1891-1899, 1998.
[3] SHIN, F.G., XIAN, X.J., ZHENA, W.P., YIPP, M.W., “Analysis of the mechanical properties and microstructure of bamboo epoxy composites”, Journal Materials Science, v. 24, pp. 3483-3490, 1989.
[4] JAIN, S., KUMAR, R., JINDAL, U.C., “Mechanical behavior of bamboo and bamboo composites”,
Journal Materials Science, v. 27, pp. 4598-4604, 1992.
[5] JAIN, S., KUMAR, R., JINDAL, U.C., “Development and fracture mechanism of the bamboo/polyester resin composite”, Journal Materials Science Letters, v. 12, pp. 558-560, 1993.
[6] SEEMA, J., KUMAR, R., “Processing of bamboo fiber reinforced plastics composites”, Materials Manufacture & Processing, v. 9, pp. 813-828, 1994.
[7] THWE, M.M., LIAO, K., “Effects of environmental aging on the mechanical properties of bamboo glass fiber reinforced polymer matrix hybrid composites”, Composites Part A, v. 33, pp. 43-52, 2002. [8] OKUBO, K., FUJII, T., YAMAMOTO, Y., “Development of bamboo based polymer composites and
their mechanical properties”, Composites Part A, v. 35, pp. 377-383, 2004.
[9] OKUBO, K., FUJII, T., YAMASHITA, N., “Improvement of interfacial adhesion in bamboo polymer composite enhanced with micro-fibrillated cellulose”, JSME International Journal A. Solid M., v. 48, pp. 199-204, 2005.
[10] LEE, S.H., WANG SIQUN, “Biodegradable polymer/bamboo fiber biocomposite with bio-based coupling agent”, Composites Part A, v. 37, pp. 80-91, 2006.
[11] HUANG, X., NETRAVALI, A., “Biodegradable green composites made using bamboo micro/nano-fibrils and chemically modified soy protein resin”, Composites Science & Technology, v. 69, pp. 1009-1015, 2009.
[12] COSTA, L.L., MONTEIRO, S.N., LOIOLA, R.L., “Mechanical behavior of polyester composites reinforced with continuous bamboo fibers”, In: Proceedings of the Characterization of Minerals, Metals & Materials - TMS Conference 2010, pp. 1-6, Seattle, WA, USA, February 2010.
[13] KULKARNI, A.G., SATYANARAYANA, K.G., ROHATGI, P.K., VIJAYAN, K., “Mechanical properties of banana fibers”, Journal of Materials Science, v. 18, pp. 2290-2296, 1983.
[14] MURHERJEE, P.S., SATYANARAYANA, K.G., “Structure and properties of some vegetable fibers”,
Journal of Materials Science, v. 21, pp. 51-56, 1986.
[15] TOMCZAK, F., SATYANARAYANA, K.G., SYDENSTRICKER, T.H.D., “Studies on lignocellulosic fibers of Brazil Part III – Morphology and properties of Brazilian curauá fibers”, Composites: Part A, v. 38, pp. 2227, 2007.
[16] MONTEIRO, S.N., SATYANARAYANA, K.G., LOPES, F.P.D. “High strength natural fibers for improved polymer matrix composites”, Materials Science Forum, v. 638-642, pp. 961-966, 2010. [17] NASCIMENTO, D.C.O., MOTTA, L.C., MONTEIRO, S.N., “Weibull analysis of tensile tested
piassava fibers with different diameters”, In: Proceedings of the Characterization of Minerals, Metals & Materials – TMS Conference 2010, pp. 1-8, Seattle, WA, USA, February 2010.