*e-mail: [email protected]
Evaluation of Carbon Fiber Surface Treated by
Chemical and Cold Plasma Processes
Liliana Burakowski Noharaa*, Gilberto Petraconi Filhob, Evandro Luís Noharac,
Maurício Urban Kleinked, Mirabel Cerqueira Rezendee
a
Departamento de Engenharia Aeronáutica e Mecânica, Instituto Tecnológico de Aeronáutica - ITA,
Centro Técnico Aeroespacial, 12228-904 São José dos Campos - SP, Brazil
b
Departamento de Física, Instituto Tecnológico de Aeronáutica - ITA,
Centro Técnico Aeroespacial, 12228-904 São José dos Campos - SP, Brazil
c
Departamento de Engenharia Mecânica, Universidade de Taubaté - UNITAU,
Rua Daniel Danelli, s/n, 12060-440 Taubaté - SP, Brazil
d
Instituto de Física Gleb Wataghin, Universidade Estadual de Campinas - UNICAMP,
Universidade Estadual de Campinas - UNICAMP,
Cidade Universitária Zeferino Vaz, Barão Geraldo, 13083-970 Campinas - SP, Brazil
e
Divisão de Materiais, Instituto de Aeronáutica e Espaço, Centro Técnico Aeroespacial,
12228-904 São José dos Campos - SP, Brazil
Received: October 20, 2004; Revised: May 26, 2005
Sized PAN-based carbon fibers were treated with hydrochloric and nitric acids, as well as argon and oxygen cold plasmas, and the changes on their surfaces evaluated. The physicochemical properties and morphological changes were investigated by atomic force microscopy (AFM), scanning electron microscopy (SEM), X-ray photoelectron spectroscopy (XPS), tensile strength tests and Raman spectroscopy. The nitric acid treatment was found to cause the most significant chemical changes on the carbon fiber surface, introducing the largest number of chemical groups and augmenting the roughness. The oxygen plasma treatments caused ablation of the carbon fiber surface, removing carbon atoms such as CO and CO2 molecules. In addition, the argon plasma treatment eliminated defects on the fiber surface, reducing the size of critical flaws and thus increasing the fiber’s tensile strength.
Keywords:carbon fibers, chemical treatment, cold plasma, functional groups
1. Introduction
Carbon fibers are applied mainly in the reinforcement of poly-meric matrices. However, when applied without previous surface treatment, these fibers produce composites with low interlaminar shear strength (ILSS). Numerous methods have been developed to improve the fiber surface wettability or to increase the quantity of surface functional groups1-5. The interfacial bond between the carbon filaments and the resin matrix can be enhanced by enlarging the surface area, which provides more points of contact/anchorage between the fiber and the matrix, or by enhancing the physicochemical interaction between the components1,5.
Oxidation methods consist of oxidizing the carbon fiber in a liquid or gas environment to form oxygen-containing functional groups such as carboxyl, carbonyl, lactone and/or hydroxyl groups on the surface of the fiber, while simultaneously increasing the surface area of the carbon fiber4,6,7. Several studies have attempted to generate strong adhesion between the fiber surface and matrix1-4,7-9 to improve the stress transfer from the relatively weak and compliant matrix to the strong and stiff reinforcing fibers7,10.
In this study, the surfaces of the carbon fibers were chemically and physically modified using nitric and hydrochloric acids, as well as cold plasma in argon and oxygen atmospheres. The treated and untreated (as-received) surfaces of the carbon fibers were subjected to detailed characterization. The chemical and physical aspects of the surfaces were examined by atomic force microscopy (AFM), scan-ning electron microscopy (SEM), X-ray photoelectron spectroscopy (XPS), tensile strength tests and Raman spectroscopy.
2. Experimental
The carbon fiber studied in this experiment was a PAN-based type, with 3000 filaments per tow, manufactured by Toray Co. under the trade name of T-300. These commercial fibers presented a sizing (thin film of polymeric matrix) compatible with epoxy matrix resin11. The fibers were used as-received. All the other chemicals employed here, supplied by Merck, were of analytical purity and were used as-received.
2.1. Chemical treatment
Carbon fibers were oxidized in concentred hydrochloric (35.5% (w/w)) and nitric (97% (w/w)) acids at 103 ± 0.2 °C. The duration of the acid treatments was 5, 10 and 20 minutes. After the treatments, all the samples were thoroughly washed with freshly boiled demineralized water and oven-dried at 105 ± 0.2 °C for 2 hours. They were then kept in a dryer in an argon atmosphere prior to the analyses.
2.2. Plasma treatment
The plasma treatments were carried out in a Plasma Discharge System designed and built by the ITA – Departamento de Física of Instituto Tecnológico de Aeronáutica. A continuous flow of oxygen and argon carrier gas was employed in the two distinct treatments.
literature reports typical plasma treatments of fibers of 1 to 30 min-utes under a low pressure of 10-2-101 mbar12. Upon conclusion of the treatments, the samples were kept in a dryer in an argon atmosphere prior to their analysis.
2.3. Mechanical properties
2.3.1. Tensile strength tests
The mechanical properties of the untreated and treated carbon fiber samples (single filament) were measured using an Instron Uni-versal testing machine with a gauge length of 25 mm (Figure 1) and a crosshead speed of 2.5 mm/min, according to the ASTM D 3379-75 (Standard test method for tensile strength and Young’s modulus for high-modulus single-filament materials)13-15.
2.4. Surface characterization
2.4.1. SEM observation
The morphological changes on the fiber surfaces of untreated and treated carbon fibers were examined by SEM (Zeiss, model 950) with 10,000 times magnification.
2.4.2. AFM observation
AFM observations were carried out in contact mode, using a Park Scientific Instruments autoprobe. The roughness was analyzed based on images obtained over a 3 µm x 3 µm area. This analysis involved five different areas of two specimens taken from each sample (untreated and treated fiber).
2.4.3. Raman spectroscopy
Raman spectra were measured using a XY DILOR spectrometer, cooled under liquid nitrogen and operating at 514.5 nm. The intensity ratio between the D-line (1360 cm-1) and the G-line (1580 cm-1) of Raman spectra was applied to evaluate the size of the crystalline surface, La, of the carbon fiber samples treated by both chemical
and cold plasma methods. In order to obtain a reference sample for the Raman spectra (without sizing and with a better crystalline ar-rangement), a sized carbon fiber sample was treated for 2 hours at 2100 ± 1 °C under a nitrogen atmosphere.
2.4.4. X-ray photoelectron spectroscopy (XPS)
The untreated and treated carbon fiber surfaces were analyzed using an Escalab 220 I VG X-ray photoelectron spectrometer (XPS) and monochromatic Al Kα radiation (1486.6 eV), operating at 1 keV and an emission current of 0.6 µA. The surface of each sample (area of 1cm2) was scanned 10 times in 5 minutes.
3. Results and Discussion
3.1. Tensile strength tests
3.1.1. Chemical treatment
Table 1 shows the average values of the tensile strength of car-bon fibers as-received (untreated) and treated with hydrochloric and nitric acids.
An analysis of the average tensile strength of carbon fibers as-re-ceived and treated with hydrochloric and nitric acids indicates that the values decreased as the oxidation time increased from 5 to 20 minutes. However, this property was found to decrease more drastically in the samples treated with nitric acid than in those treated with hydrochloric acid, a fact that was attributed to the greater acidity of nitric acid.
In every case (fibers treated with hydrochloric and nitric acids for 5, 10 and 20 minutes), the wide range of measurement uncertainties found for the samples was due to the heterogeneous chemical attack that occurred preferentially in the outermost area of the fiber tow, which caused more profound changes in the outer fiber. This attack occurred less intensely within the fiber tow (in the core of tow), thus producing less pronounced alterations on the innermost fiber surfaces. This heterogeneous attack resulted from the great number of filaments (~ 3000) in the tow of fibers, which made it difficult for the acid to reach the core of the tow.
Other researchers have used nitric acid oxidation to introduce a number of acidic functions (carboxyl and phenolic) onto fibers4,7, aiming to improve the fiber/matrix adhesion through a combination of increased acid-base interactions, chemical bonding and/or enhanced mechanical interlocking on the fiber surface.
3.1.2. Plasma treatment
Table 2 shows the average tensile strength values of sized carbon fibers untreated and treated, respectively, with argon and oxygen plasmas.
Table 2 shows significant differences in the tensile strength of as-received carbon fibers and fibers subjected to argon plasma treatments for 10 and 20 minutes. The higher tensile strength of the
25 mm
Glue Card Device
Carbon Fiber Filament
Figure 1. Schematic of the cardboard fixture for single filament testing.
Table 1. Tensile strength (σ) of carbon fiber samples untreated and treated with hydrochloric and nitric acids.
Hydrochloric Acid Treatment σ (MPa) Nitric Acid Treatment σ (MPa)
as-received fiber 5 minutes 10 minutesutes 20 minutesutes 5 minutesutes 10 minutesutes 20 minutesutes
2143 ± 471 2122 ± 443 2040 ± 489 1824 ± 644 1986 ± 522 1924 ± 658 1531 ± 605
Table 2. Tensile strength (σ) of carbon fiber samples untreated and treated with argon and oxygen plasmas.
Argon Plasma Treatment σ (MPa) Oxygen Plasma Treatment σ (MPa)
as-received fiber 10 minutes 20 minutesutes 1 minuteute 2 minutesutes 10 minutesutes
sample treated for 10 minutes was attributed to the removal of the outermost layer of the carbon fiber surface. This procedure contributed to decrease the critical flaw size population that acts as a stress con-centrator, contributing to reduce the fiber’s strength16. The 20 minutes argon plasma treatment resulted in lower tensile strength than that of untreated fiber. This reduction was attributed to the longer treatment time (from 10 to 20 minutes) which led to the formation of deeper crevices and pitting on the carbon surface, thereby further reducing the fiber’s tensile strength.
Table 2 also indicates that the tensile strength of carbon fibers treated with oxygen plasma decreased more than that of fibers treated with argon plasma. A comparison of the average tensile strength of treated and untreated samples reveals that this property decreased by 26% in the samples treated for 2 minutes and by 68.5% in those treated for 10 minutes.
The carbon fiber’s weight measured before and after argon plasma treatments indicated a post-treatment weight loss of around 2.0%, while losses of up to 5.6% were observed after oxygen plasma treat-ments. These results indicate that a progressive weight loss occurred with CO2 evolution4,17, suggesting that active site atoms on the fiber surface were oxidized to form oxygen-containing surface groups such as C-OH, C=O, COOH and finally CO27.
An analysis of the uncertainties involved in the measurements of carbon fibers treated with argon and oxygen plasma showed similar values which were lower than those of fibers treated with hydrochloric and nitric acids. This finding was attributed to two possible factors: the inherent characteristic of plasma treatments (attack), or the pres-ence of a homogeneous plasma layer covering the substrate from the core of the carbon fiber tow to the outermost fibers in the tow. In fibers treated with hydrochloric and nitric acids, this attack occurs with less intensity within the fiber tow and more intensively in the outermost fibers, leading to greater variations in tensile strength and measurement uncertainties.
3.2. Surface characterization
The carbon fiber surfaces were observed by SEM and AFM and involved the following carbon fiber samples: as-received carbon fiber, fiber treated by hydrochloric and by nitric acids for 10 minutes, by argon plasma for 10 minutes and by oxygen plasma for 2 minutes. These samples were chosen for a more detailed analysis because these treatments heighten the probability of introducing polar groups and modifying the roughness of carbon fiber surfaces.
3.2.1. SEM observations
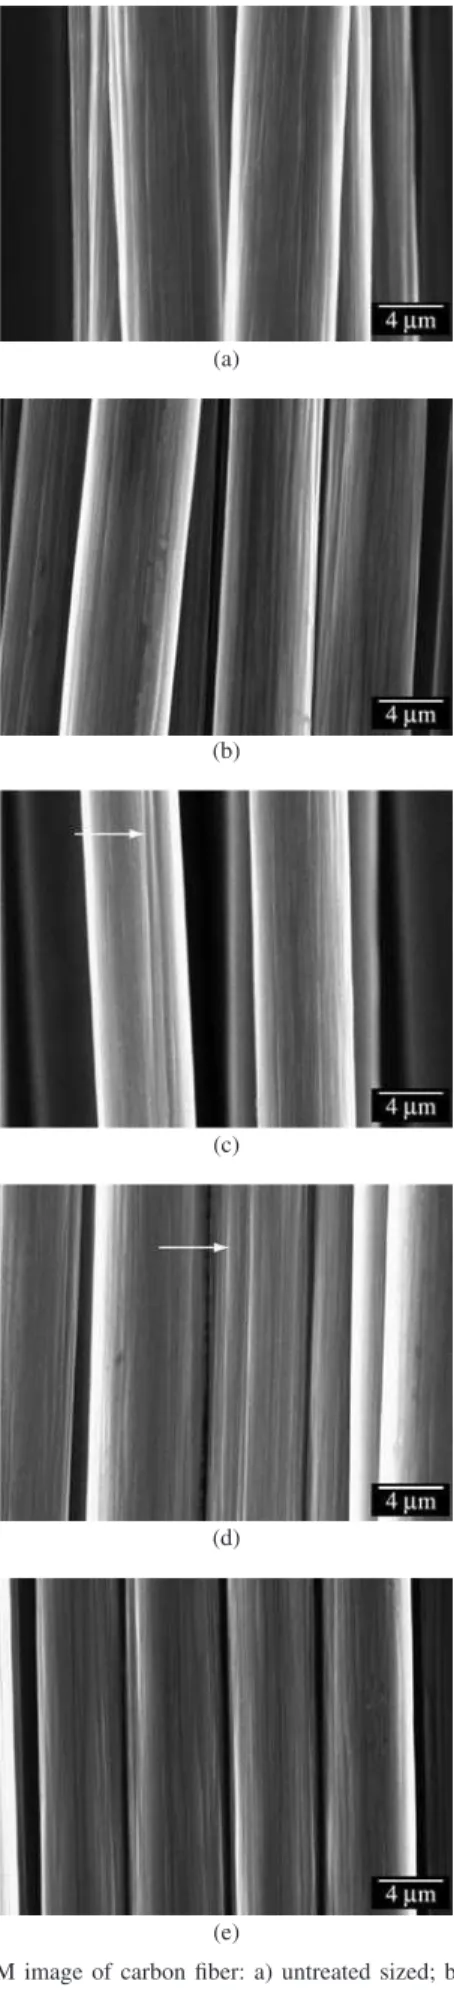
Figure 2a shows a SEM image of an as-received carbon fiber sample. As expected, this fiber’s relative smoothness was attributed to the wet spinning process employed to produce the polyacrylonitrile (PAN) filaments used as raw material in carbon fiber processing17.
Figure 2b shows an image of a carbon fiber sample treated with hydrochloric acid for 10 minutes. No significant differences are visible and the sample displays a relatively smooth surface and few defects. The micrograph of the carbon fibers treated with nitric acid (Figure 2c) indicates that this treatment produced greater changes on their surface, with increased roughness and etching more transversely oriented along the fiber’s axis than did the hydrochloric acid attack. According to C.U. Pittmann Jr. et al., this increased roughness is fol-lowed by the presence of acidic functions (carboxylic and phenolic hydroxyl groups) introduced on the carbon fiber’s surface by nitric acid. Thus, this type of oxidation increases the total acidic functions while simultaneously increasing the surface area (roughness)4.
Figure 2d shows a micrograph representative of the carbon fib-ers treated with argon plasma for 10 minutes, indicating that the argon plasma treatment increased the superficial roughness. This
Figure 2. SEM image of carbon fiber: a) untreated sized; b) treated with
hydrochloric acid (10 minutes); c) nitric acid (10 minutes); d) argon plasma for 10 minutes; and e) oxygen plasma for 2 minutes.
(a)
(b)
(c)
(d)
suggests that the attack acts more efficiently in removing weakly bonded regions on the carbon fiber surface12, thereby contributing to reduce the presence of critical sized flaws. A comparison of the SEM findings and the tensile strength results indicates that the roughness introduced on the fiber’s surface by the argon plasma treatment did not negatively affect this mechanical property. On the contrary, these samples displayed significantly higher tensile strength values.
The fiber treated with oxygen plasma (Figure 2e) displayed su-perficial morphological changes quite similar to those produced by the argon plasma treatment, and a striated pattern was observed along the fiber’s axis. In this case, the striation depth was found slightly deeper than that observed in the argon plasma-treated fiber.
3.2.2. AFM observation
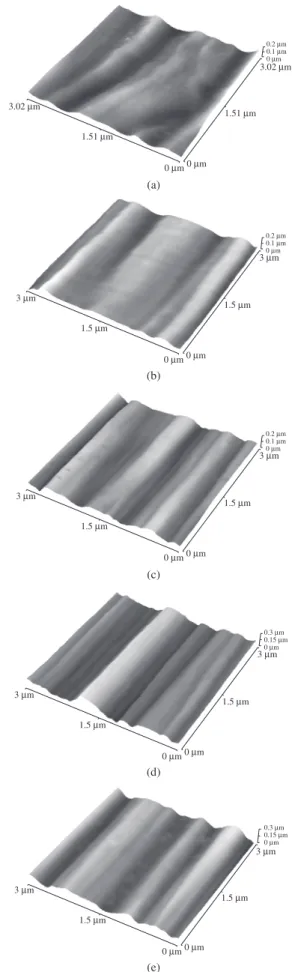
Figure 3 shows the morphological changes on the surface of untreated and treated carbon fiber samples observed by AFM. As can be seen, the treatments involving nitric acid and argon and oxygen plasmas acted most effectively to change the carbon fiber surface.
The as-received carbon fiber (Figure 3a) exhibits the typical stria-tion characteristic of the PAN manufacturing process, as observed by SEM. The image obtained for this sample also corroborates the observations of Dilsiz, N. and Wightman, J. P.18, i.e., that sizing produces microscopic changes on the surface topography. The mi-crograph of the sample treated with hydrochloric acid (Figure 3b) shows that the acid attack caused the removal of sizing and of the disorganized material from the outermost layer, thereby smoothing the fiber’s surface. The sample treated with nitric acid (Figure 3c) displayed more pronounced smoothing than did the sample subjected to hydrochloric acid treatment, as well as deep crevices.
A careful analysis of the texture of the argon plasma-treated sample (Figure 3d) reveals the presence of well defined grooves and etching. The oxygen-treated sample (Figure 3e) displays deeper etching and a rougher texture than the as-received carbon fiber. The surface of this sample also exhibits deposits of low-density material around the fiber, suggesting that it underwent re-deposition of carbon by sputtering of oxygen ions from other parts of the fiber10,12. This phenomenon is more frequent in argon plasma treatments5.
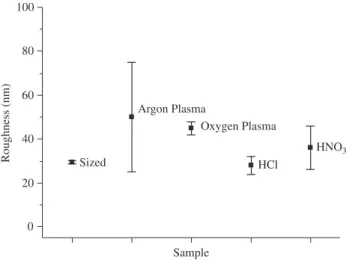
Figure 4 correlates the average roughness (Ra) values of the untreated and treated carbon fibers obtained from the AFM analyses. Note that the superficial roughness increases in the following order: hydrochloric and nitric acids, oxygen and argon plasmas treatments. Except for the argon-treated sample, the increase in roughness was proportional to the decrease in tensile strength, indicating that oxygen plasma and acid attacks increase the population of critical flaws on the carbon fiber surface.
3.2.3. Raman spectroscopy
Graphitic carbon and other sp2 bonded amorphous carbons present strong Raman scatters despite their intense optical absorption. Instru-ments that allow for the micro-focus of small regions of samples provide useful information about the phases and structural changes that take place in materials19,20.
Raman spectroscopy enables one to distinguish zones with low, medium and high structural organization in carbon materials. The bands at 1355 and 1582 cm-1 are the main features of carbon materials and are called D bands (disordered) and G bands (ordered or graphitic), respectively20,21. The ratio of D and G bands (I
D/IG) can be regarded as a measure of the crystalline order of carbon materials20-25.
Table 3 shows the ID/IG ratio and the respective surface crystal-line size (La) of the carbon fibers untreated and treated with acids
and with cold plasmas, as well as a sample heat treated at 2100 °C in a nitrogen atmosphere. The sample treated at 2100 °C was used as a reference to compare the Raman spectra. The ID/IG ratio and the surface crystalline size (La) values were obtained from the Raman
Figure 3. AFM image of carbon fiber: a) untreated sized; b) treated with
hydrochloric acid (10 minutes); c) nitric acid (10 minutes); d) argon plasma for 10 minutes; and e) oxygen plasma for 2 minutes.
0µm 1.51µm
3.02µm
0µm 0.2µm 0.1µm
3.02µm
1.51µm
0µm (a)
0µm 1.5µm
30µmµm
0.2µm 0.1µm
3µm
1.5µm
0µm (b)
0µm 1.5µm
30µmµm
0.2µm 0.1µm
3µm
1.5µm
0µm (c)
0µm 1.5µm
30µmµm
0.3µm 0.15µm
3µm
1.5µm
0µm (d)
0µm 1.5µm
3µm
0µm 0.3µm 0.15µm
3µm
1.5µm
Table 3. Raman analysis – ID/IG ratio and surface crystalline size of untreated and treated carbon fibers.
Samples ID/IG La (Å)
Reference fiber (treated at 2100 °C) 0.82 53 Untreated carbon fiber (as-received) 2.26 19 Carbon fiber treated with HCl 2.90 15 Carbon fiber treated with HNOwith HNO HNO3 2.24 20 Carbon fiber treated with Ar plasmawith Ar plasma Ar plasma 2.97 15 Carbon fiber treated with Owith O O2 2.82 16
Figure 5. Raman spectra of carbon fibers untreated (as-received), treated with acids, by the plasma process, and heat-treated at 2100 °C (reference).
spectra, using the Lorentzian function20. The frequency (position) of the first Lorentzian was at 1355 cm-1, the second at 1582 cm-1 and the third at 1620 cm-1. The remaining Lorentzian parameters (width and intensity) were determined as follows: a) the ID/IG was obtained from the ratio of the curve areas at 1355cm-1 and 1582 cm-1, and b) the crystalline size following the relationship19, 20,22-26:
La = C / (ID/IG) (1)
where: La = surface crystalline size and C = 44Å
Figure 5 shows the Raman spectra of the carbon fiber samples. A comparison of these spectra reveals that the reference sample (treated at 2100 °C) has narrow well-defined peaks, which increase the graphitic order. Table 3 confirms this finding, indicating that the reference sample possesses the lowest ID/IG ratio. In addition, the surface crystalline size increased from 19 to 53Å as the heat treatment temperature increased, indicating higher ordering of the graphitic structures21,23.
The Raman spectra of the treated carbon fibers showed very similar ID/IG ratios and, hence, similar surface crystalline sizes (La) in
all the carbon fiber samples treated with acids and plasma processes. These results indicate a similar ordering of the graphitic structures. Based on the evidence of the slight differences in the ID/IG ratios, it was concluded that the superficial treatments did not modify the graphitic structure of the carbon fiber samples.
3.2.4. X-ray photoelectron spectroscopy
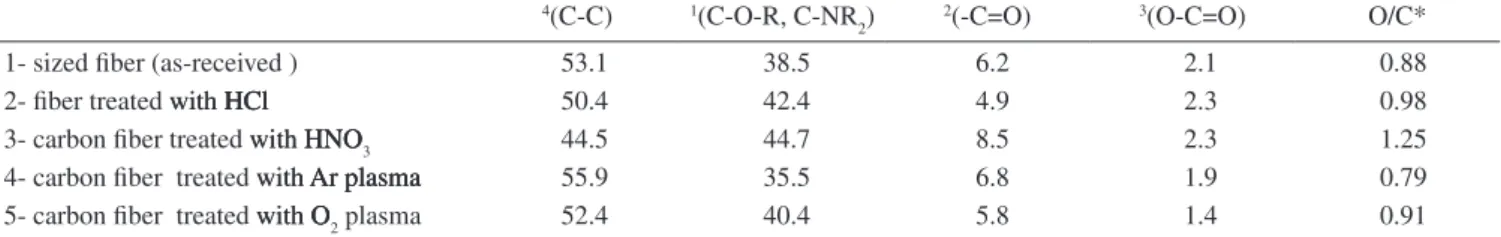
The untreated and treated carbon fiber samples were analyzed by X-ray photoelectron spectroscopy (XPS). Table 4 shows the
percent-age of chemical groups on carbon fiber surfaces, indicating that the relative ratio of oxygen to carbon changed according to the conditions of the surface treatment.
As expected, the as-received carbon fiber (sample 1) presented the lowest O/C ratio, except for the sample treated by argon plasma. The number of functional groups for the as-received sample was attributed to the residual groups of the polymeric precursor, poly-acrylonitrile and was probably due to the carbonization temperature (below 1400 °C)17 and the polymeric sizing on the carbon fibers. This assumption was supported by a thermogravimetric analysis of this carbon fiber sample in an inert atmosphere, which indicated a weight loss of 5% close to 1200 °C.
Among the superficially treated samples, the ones treated with nitric acid presented the largest number (1.25) of functional groups on the surface. This number was nearly 1.4-fold higher than the as-received fiber. The hydrochloric acid treatment led to a slight increase, which was determined by the lower O/C ratio (0.98), because this acid is less oxidizing than nitric acid.
The sample subjected to oxygen plasma showed an O/C ratio of 0.91. This value was similar to that of the as-received sample (O/C = 0.88), and was attributed to the energy conditions of the oxy-gen plasma, which favored the ablation of the carbon fiber, removing carbon atoms in form of CO and CO2. As expected, the sample treated with argon plasma displayed the lowest O/C ratio, because this type of treatment does not introduce functional groups but favors changes of superficial roughness, as observed in the AFM analysis.
4. Conclusions
Two different surface treatment methods for reinforcing carbon fibers were studied here. The first involved hydrochloric and nitric acid solutions and the second involved cold argon and oxygen plasma. SEM revealed that the fibers treated with nitric acid showed greater changes on their surface topographies, evidenced by the increased roughness caused by the acid attack. The carbon fibers treated with argon and oxygen plasma showed depth striations. A marked change in the topography of these treated fibers was also observed by AFM, with well defined grooves and etching.
The treated carbon fibers analyzed by Raman spectroscopy showed that all the samples displayed similar surface crystalline sizes and ordering of their graphitic structures, indicating that the carbon fiber structures were unaffected by the treatments. The XPS
100
80
60
40
20
0
Sample
Roughness (nm) HCl HNO3
Oxygen Plasma Argon Plasma
Sized
1000 1100 1200 1300 1400 1500 1600 1700 1800 1900 Raman Spectras of Carbon Fibers
G D
O2 plasma
Ar plasma
HNO3
HCl as-received
reference
Intensity (a.u.)
Raman Shift (cm-1) Figure 4. Correlation between the average surface roughness values and the
results indicated that, of all the treatments tested here, the nitric acid treatment produced the largest number of functional groups on the carbon fiber surface. In contrast, the oxygen plasma method resulted in the removal of carbon atoms in the form of CO and CO2 instead of increasing the number of polar groups on the carbon fiber surface.
The chemical treatments (hydrochloric and nitric acids) occurred preferentially in the outermost area of the fiber tow, causing more profound changes in the external fibers. This heterogeneous attack occurred due to the great number of filaments (~ 3000) in the fiber tow, which make it difficult for the acid to reach the core of the tow. A comparative analysis of the average tensile strength of the as-received carbon fibers and the fibers treated with hydrochloric and nitric acids indicated that the tensile strength decreased as the oxidation time increased from 5 to 20 minutes. However, this property was found to decrease more drastically in the samples treated with nitric acid than in those treated with hydrochloric acid, a fact that was attributed to the greater acidity of nitric acid.
An analysis of the uncertainties in the measurements of the tensile strength of argon and oxygen plasma-treated carbon fibers showed similar tensile strength values which were lower than those of fibers treated with hydrochloric and nitric acids. This behavior was attributed to two possible factors: the inherent characteristic of plasma treat-ments, or the presence of a homogeneous plasma layer covering the substrate from the core of carbon fiber tow to the outermost fibers of the tow. The chemical treatment proved more reliable, since it is easier to control the variables by this method (time, concentration of the acid, temperature) than by the plasma treatment (gas flow) technique.
Acknowledgments
The authors thank the Brazilian research funding agencies FAPESP (Process Nº 00/15107-5) and CNPq (Process Nº 303528-2003-6) for their financial support of this work.
References
1. Burakowski L. Estudo da interface de compósitos termoplásticos
estruturais processados a partir de fibras de carbono com superfícies modificadas. [MSc thesis]. Instituto Tecnológico de Aeronáutica; São José dos Campos; 2001.
2. Burakowski L, Rezende MC. Modificação da rugosidade de fibras de carbono por método químico para aplicação em compósitos poliméricos. Polímeros: Ciência e Tecnologia. 2001; 11(2):51-57.
3. Zielke U, Hüttinger KJ, Hoffman WP. Surface-oxidized carbon fibers: I.
surface structure and chemistry. Carbon. 1996; 34(8):983-998.
4. Pittman Jr. CU, He GR, Wu B, Gardner SD. Chemical modification of carbon fiber surfaces by nitric acid oxidation followed by reaction with
tetraethylenepentamine. Carbon. 1997; 35(3):317-331.
5. Hull D, Clyne TW. An introduction to composite materials. 2nd edition.
Melbourne: Cambridge University Press; 1996.
6. Fujimaki H, et al. Process for the surface treatment of carbon fibers. U.S.
patent. 4,009,305, 1977.
7. Yue ZR, Jiang W, Wang L, Gardner SD, Pittman Jr. CU. Surface
char-acterization of eletrochemically oxidized carbon fibers. Carbon. 1999;
37(11):1785-1796.
8. Yosomiya R, Morimoto K, Nakajima A, Ikada Y, Suzuki T. Adhesion and
bonding in composites. New York: Marcel Dekker, 1990.
9. Lee JS, Kang TJ. Changes in physico-chemical and morphological
proper-ties of carbon fiber by surface treatment. Carbon. 1997; 35(2):209-216.
10. Cahn RW, Haasen P, Kramer EJ, Chou TW. editors. Materials Science and
Technology: A Comprehensive Treatment. v. 13: Structure and proper-ties of composites. Wiley-VCH Verlag GmbH, Weinheim, September 1, 1993.
11. Torayca. General properties of torayca yarn. Data Sheet; 1985.
12. Li Rongzhi, Ye Lin, Mai YW. Application of plasma technologies in fibre-reinforced polymer composites: a review of recent
develop-ments. Composites Part A: Applied Science and Manufacturing. 1997;
28(1):73-86.
13. ASTM Standard test method for tensile strength and young’s modulus for high-modulus single-filament materials. Philadelphia, PA: ASTM, 1982 (ASTM D 3379-75).
14. Peebles LH. Carbon Fibers: formation, structure, and properties. 1st
Edition, Boca Raton: CRC Press; 1995.
15. Botelho EC. Compósitos aeronáuticos processados a partir de fibras de
carbono impregnadas com poliamida 6/6 via processo de polimerização interfacial. [Doctoral thesis]. Instituto Tecnológico de Aeronáutica; São José dos Campos; 2002.
16. Rashkovan IA, Korabel’nikov YuG. The effect of fiber surface treatment
on its strength and adhesion to the matrix. Composites Science and
Technology. 1997; 57(8):1017-1022
17. Jenkins GM, Kawamura K. Polymeric carbons: carbon fibre, glass and
char. 1st Edition. Cambridge University Press: Cambridge, 1976.
18. Dilsiz N, Wightman JP. Surface analysis of unsized and sized carbon
fibers. Carbon. 1999; 37(7):1105-1114.
19. Brame EG, Jr, Grasselli JG. Infrared and Raman Spectroscopy. Marcel
Dekker: New York, 1977.
20. Matthews MJ, Pimenta MA, Dresselhaus G, Dresselhaus MS, et al. Origin
of dispersive effects of the raman d band in carbon materials. Physical
Review B. 1999; 59(10):6585-6588.
21. Angoni K. A study of highly ordered carbons by use of macroscopic and
microscopic raman spectroscopy. Journal of Materials Sciences. 1998;
33(14):3693-3698.
22. Tuinstra F, Koenig JL. Raman spectrum of graphite. The Journal of
Chemical Physics. 1970; 53(3):1126-1130.
23. Pesin LA. Review - Structure and properties of glass-like carbon. Journal
of Materials Science. 2002; 37(1):1-28.
24. Knight DS, White WB. Characterization of diamond films by raman
spectroscopy. J .Mater. Res. 1989; 4(2):385-393.
25. Fukunaga A, Komami T, Ueda S, Nagumo M. Plasma treatment
of pitch-based ultra high modulus carbon fibers. Carbon. 1999;
37(7):1087-1091.
26. Ferrari AC, Robertson J. Interpretation of raman spectra of disordered and
amorphous carbon. Physical Review B. 2000; 61(20):14095-14107.
Table 4. Percentage of chemical groups revealed by XPS analyses of untreated and treated carbon fibers. 4(C-C) 1(C-O-R, C-NR
2) 2(-C=O) 3(O-C=O) O/C*
1- sized fiber (as-received ) 53.1 38.5 6.2 2.1 0.88
2- fiber treated with HClwith HCl HCl 50.4 42.4 4.9 2.3 0.98
3- carbon fiber treated with HNOwith HNO HNO3 44.5 44.7 8.5 2.3 1.25
4- carbon fiber treated with Ar plasmawith Ar plasma Ar plasma 55.9 35.5 6.8 1.9 0.79
5- carbon fiber treated with Owith O O2 plasma 52.4 40.4 5.8 1.4 0.91