Effect of Process Parameters on Microstructure and Mechanical Properties of Friction Stir
Welded Cast Nickel Aluminum Bronze Alloy (C95800)
Siva Selvarajua* , Sampathkumar Senthamaraikannana, Sudha Jayaprakashama , Anirudh Ramesh Madiqa
Received: June 27, 2017; Revised: January 19, 2018; Accepted: February 28, 2018
In the present study, Friction Stir Welding (FSW) of Nickel Aluminum Bronze (NAB) alloy was carried out by varying the axial load, rotation speed and welding speed rate. Micro-structural analyses of these
samples revealed the different grain sizes and shapes of the various zones. Hardness and tensile strength tests were carried out for the samples welded at different conditions such as axial load, welding speed and rotational speed. Grain refinement in the weld nugget zones was achieved for all welding conditions. The refined grains in weld nugget zone (WNZ) make a main contribution to the increase of mechanical properties of FSW welded NAB alloy. The microhardness of the stir zone and Thermo-Mechanically Affected Zone (TMAZ) was found to be higher than that of the base metal. Transverse tensile strength of weld joint was
higher than that of the base metal. On the other hand, a lower or similar tensile strength value compared to
the base metal was seen from other variable welding parameters. This was due to the tunnel defect in the welded nugget zone. ANOVA test result was used for finding out the contribution of the process parameter.
Keywords: Friction Stir Welding, Nickel Aluminum Bronze (NAB) Alloy, Microstructure, Micro- hardness, Tensile Strength, ANOVA.
*e-mail: [email protected]
1. Introduction
Nickel Aluminum Bronze (NAB) alloy is used extensively in the manufacture of engineering components in propulsion and sea water handling systems due to the good combination of strength, fracture toughness, and corrosion resistance. In
the NAB alloy copper (Cu) is the major alloying element
as 79.56% and other minor alloying elements are Al 8.5 to 9.5% (two phase alloy), Fe 3.5 to 4.5% (increases the
strength and hardness), Ni 4 to 5% and Mn 0.8 to1.5%. This combination offers a wide range of benefits such as better
castability, higher strength, toughness and better corrosion resistance under extreme environmental conditions1-3. NAB
alloys, which are metallurgically multifaceted alloys, have
several solid solution phases like α, β', κi, κii, κiii (nickel rich) and κiv.
4. Moreover, the physical metallurgy of the
NAB alloys undergoes several microstructural changes through use of the slow cooling process, depending on
the paths traversed by the different cooling stages. The microstructure of the NAB alloy remains as β phase until it begins to cool down from 1030ºC. The transformation of the β phase (fcc structure) to the α phase (bcc structure)
with a Widmanstatten morphology starts at 930ºC, tailed by
intermetallic phase, nucleation of globular κii phase starts formation in the β' phase which is nominally Fe3Al with a
DO3 structure. When the temperature reaches 860ºC fine
precipitation of κiv phase (Fe3Al) begins starts formation in the α phase. The remaining β' phase is transformed into the intermetallic α + κiii (NiAl) phase by the eutectoid reaction at 800ºC with a B2 structure. The weight percentage of Fe content in NAB alloy is above 5%, the κi phase tends to
appear as large dark black shaped morphology within the α
phase matrix structure5. In addition, the cooling rate plays
an important role in the phase composition of the NAB alloy
and α transforms to β' phase with a martensitic microstructure when the cooling rate increases. The higher volume of β phase has a negative effect on the corrosion resistance of
the NAB alloy6. The common problem in cast NAB alloy
is the reduction in mechanical and physical properties, due to the presence of shrinkage porosity. Coarse grains are prone to appear in the cast alloy due to poor casting7. Past researchers have found several problems such as insufficient penetration, loss of strength, high distortion, Heat Affected Zone (HAZ) cracks and formation of brittle phase from the
fusion welding of aluminum bronze arising from the formation
of transformation products of β' phases as the result of fast
cooling.8,17. It is necessary to modify the microstructure of
the castings in order to improve the mechanical properties
of the NAB alloy. However, no suitable technique appears
to have been established for modifying the structure of NAB alloy castings until the employment Friction Stir Welding (FSW) and Friction Stir Processing (FSP). corroborated
Friction stir welding is a solid-state joining process which
involves the mechanical mixing of the two pieces of metal through application of axial force, tool rotation speed and Welding speed.
FSW is widely engaged in the joining of aluminum alloys for
industrial purposes and where fusion welding cannot be taken up. FSW of high melting temperature like nickel, copper, steel and titanium alloys have been investigated in recent years9-10. The FSW suggest a possibility of joining NAB alloy for producing good quality weld compared to the fusion welding process11-13.
This is due to the presence of a higher copper content in NAB alloys which has a high thermal diffusivity about 10 to 100 times that of steel - nickel alloy. Hence, the heat input required for
welding is much higher than for any other material14-15. FSW is
employed for generating a suitable heat input by controlling the axial load and rotational speed, tool shoulder and pin, plunged in between the two work pieces and generates frictional heat by stirring action to overcome the problems seen in the fusion welding process. Once the material is heated to the plastic state, the tool is traversed along the welding direction, the plasticized
material flows from the advancing side to the retreating side
of the tool through the application of an axial force applied by the tool shoulder for softening up the material16.
During recent years, some researchers have conducted Friction Stir Processing (FSP) of cast NAB alloys with
different performance characteristics. These are presented below. OH-Ishi et al, Fuller et al. and Mahoney et al. 17-19 have made a study of friction stir processing on the
microstructure and mechanical properties of the NAB alloy.
Change of coarse microstructure to fine microstructure
and elimination of porosity defects were demonstrated.
Highly improved hardness, tensile strength and ductility
in FSP NAB alloy were seen compared to the base metal. Further, Oh-ishiet al20 reported that the observation of
higher and lower angle boundaries in the upper region of
weld nugget zone, and also the retention of α phase during
FSP without dynamic recrystallization. Ni et al.7,21 pointed out to the greatly refined and the inhomogeneous features of the microstructure formed during FSP. This was as a consequence of different deformation degrees in the stir
zone found to be incomplete dynamic recrystallization. Moreover, the plastic deformation of NAB alloy through
FSP causes significant improvement in the mechanical
properties of the base metal arising as the results of elimination of the porosity in the stir zone of the material. Behnam Sabbaghzadeh et al.22 have made an attempt on the gas tungsten arc welding of NAB alloy. They observe
enhancement of corrosion resistance in the welded sample
under DC and AC electrochemical test after 72hr. However, this type of fusion welding process has a significant effect on the mechanical properties of the welded region. This
result owes it, to the formation of a large number inter-metallic phase in the welded regions23.
Microstructure and the mechanical properties of FW,
FSW and FSP of NAB alloy are subjected to variations
depending on the welding parameters and dimensions
of the Nab alloy. This has been indicated by previous researchers. The studies conducted on the as-cast NAB alloys are limited by FSP and FSW. Hence, this study
aims at the investigation of the commercial UNS C95800
Nickel Aluminum Bronze (NAB) alloy of 6mm thickness
plate welded by FSW. This is subject to various welding
conditions under variable tool rotation speeds, welding
speeds and axial loads as major topics for research for
evaluation of the weld region of the NAB alloy24,25,26. The
macrostructure, microstructure, micro-hardness and tensile properties of the processes were examined after the FSW.
2. Materials and Welding
Nickel aluminum bronze alloy has been sectioned from an as-cast ingot with a dimension of 100mm x 60mm x 6mm
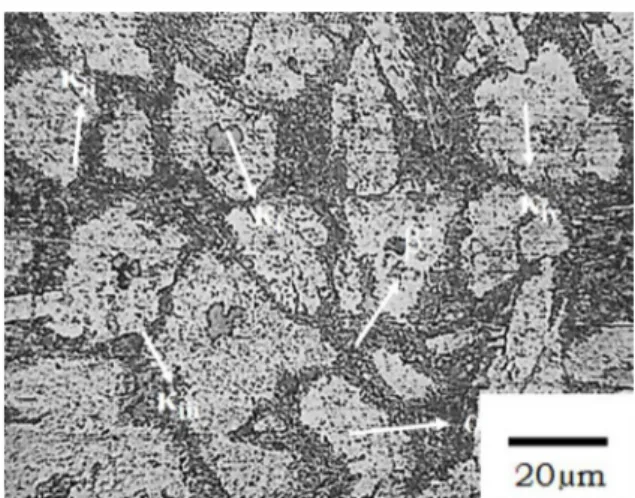
were used in this study. The micrograph of the base metal is shown in Fig. 1. It has three phases namely α phase, β' phase and κ (κi, κii, κiii, κiv) phase. The α phase featuring light etching with a size of 150µm, while β' phase has been found by dark
etching constituents with various transformation products20,22. The alloy used in the study has iron content higher than 5%. κi
phase (dendritic morphology) is present in the alpha phase with
dark etching; this is reported to be iron rich. κii phase (globular
particles) is also seen with sphere-shaped appearance and with
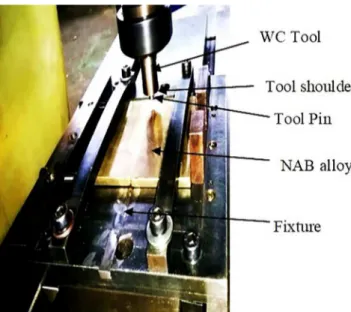
irregular distribution at the boundaries of α and β' phases. The fine participates seen distributed in α grains constitute the κiv phase. The κi, κii, and κiv phases are iron rich, while κiii phase nickel rich. The chemical composition NAB alloy is shown in Table 1. A similar butt welding was carried out using FSW machine. The experimental setup is shown in Fig. 2. The NAB alloy plate was clamped tightly to the steel back plate. The welding process
was performed by a variable load FSW machine. Details of the
input process parameters and their levels are given in Table 2.
L9 orthogonal array was used for designing the experiments by Minitab 14 software on the basis of the input process parameters
and their levels. This values are shown in table 3. Table 4 shows
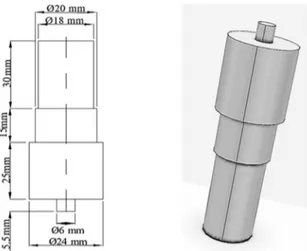
the mechanical properties of the NAB alloy. WC-based (tungsten carbide) alloy tool was selected for the welding of NAB alloy.
Figure 1. Micrograph of the base metal
Table 1. Chemical composition of NAB alloy
Elements Cu Al Fe Ni Mn Zn Sn Si
Figure 2. Experimental setup of FSW for NAB alloy
Table 2. FSW process parameters and their levels
Factors Levels
1 2 3
Welding speed (mm/min) 60 80 100
Tool rotation (rpm) 1200 1400 1600
Axial load (kN) 12 14 16
Table 3. shows the L9 Orthogonal array
E. No
Welding Speed (mm/
min)
Tool Rotation
Speed (rpm)
Axial Load (kN)
E1 60 1200 12
E2 60 1400 14
E3 60 1600 16
E4 80 1200 14
E5 80 1400 16
E6 80 1600 12
E7 100 1200 16
E8 100 1400 12
E9 100 1600 14
Table 4. Essential properties of NAB alloy Mechanical Properties
Tensile strength 485MPa
Melting point (solidus) 1043º C
Density 7.64 gm/cm3
Thermal conductivity 36.0 W/mºK
The dimensions of the tool are shown in Fig. 3.
After welding, the optical microscope was employed
for examining the microstructure of the weld joints
under different welding conditions and the stir zone for all FSW parameters might divided into four zones A,
B, C, D from surface to bottom is shown in Fig. 4. The
micrographs which were taken with a magnification of
500X. The average grain size in the SZ was measured using the chart comparison method as per the ASTM
E112-13 standard guidelines. For this study, the etchant consisting of 5g of FeCl3, 2 ml of HCl and 95ml of C2H5OH solution was used in the weld zones Ni et al.7.
Tensile test was carried out in the weld zone as per ASTM E8/E8M standard under four different experimental conditions using an instron-type testing machine. Tensile test was performed in a direction perpendicular to the weld joint. The dimensions of tensile specimen are detailed in Fig. 5.
Microhardness measurements were made by Vicker's Wilson equipment with a load of 1 kg applied on the
welded sample along with the vertical and cross-sectional areas with a dwell time of 10s. Analysis of variance (ANOVA) was carried out for evaluating the influence of various process parameters welding speed, rotation speed and axial load to determine the percentage of contribution on hardness and tensile strength.
3. Results and Discussion
3.1 Effect of FSW Process Parameters on weld
Formation
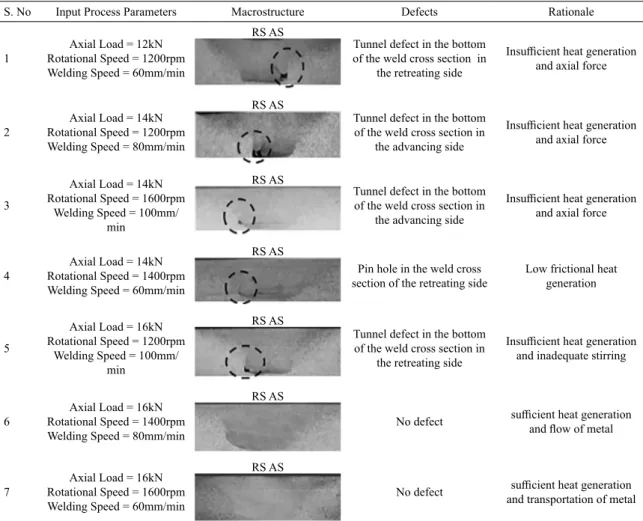
Table 5 shows the macrostructure under different experimental
conditions of FSW samples, most of which show defects on
the welded region, caused by insufficient heat generation. This is due to the abnormal stirring of FSW samples under various conditions. The heat input and material flow behavior are influenced mainly by FSW process parameters such as tool rotational speed, welding speed, and axial force. This
is prominent in the samples welded with the axial load of
Figure 4. Schematic diagram of FSW material and the various zones (A, B, C, D) examined in the present study
Figure 5. Dimensions of tensile specimen
combination of higher axial load with any welding speed and rotation speed causes plastic deformation in the
material. The shoulder force is directly responsible for
the plunge depth of the tool pin into the work piece and the load characteristics associated with the linear friction stir weld. As the axial load increases, both the hydrostatic pressure under the shoulder and the temperature in the stir zone also increase. It is well known that the lower axial load results in a defect in the weld as a result of
the insufficient joining of the transferred material. There
is an increase in the area of the weld nugget zone and decrease in defects size following the increase in the
higher axial load compared to the lower axial load. The
heat input during FSW increases following the increase in tool interaction and the material around getting hotter
tends to lose its mechanical strength. This is followed
by increase in the plastic flow of material. In contrast, action of the primary heating source as a tool shoulder
is seen. This explains impossibility of generating heat
at a lower axial load for plasticizing the material when
compared to the higher axial load was also seen. On the other hand, it is also noticed that the reduction of the rotation speed and an increase of the welding speed result in a reduction in the mixture of the metals. When the tool rotation speed increases, the heat input with in the stirred zone also increases due to the higher friction heat, which in turn results in more intense stirring and mixing of materials12. At lower rotational speed, the heat input is insufficient, and inadequate stirring causes
a tunnel defect in the stir zone of the retreating side reduced the tensile strength. Further, the hardness of the
weld joint decreases by increasing the rotation speed. Higher rotational speeds could raise the temperature
causing more heat dissipate to work piece resulting formation coarser grain structure to weld nugget zone
and reduces the hardness of the material. Higher welding
speeds are associated with low heat inputs, which result
in faster cooling rates of the welded joint and increases
the hardness weld nugget.
There is also a complete departure of the tunnel defect, pin
hole in the specimen at the welding condition of 16kN/60mm min-1/1600rpm and 16kN/80mm min-1/1400rpm, generating sufficient temperature in the weld region. Defects were
observed in the weld nugget under the lower axial load
conditions. The insufficient bonding of the weld nugget to
the base material despite the employment of a rotational speed of 1200rpm and Welding speed of 100mm/min along with the higher axial load defect is observed at the bottom weld nugget. As axial load increases the tensile strength also increases due to the elimination of defects as shown
in table 5. The highest tensile strength is obtained for the
welding speed of 60mm/min, tool rotation speed of 1600rpm
and axial load of 16kN. This combination offers a higher hydrostatic pressure that exceeds the flow stress of the
material and temperature in the welded region, resulting in a higher grain size in the surface and the subsurface zones.
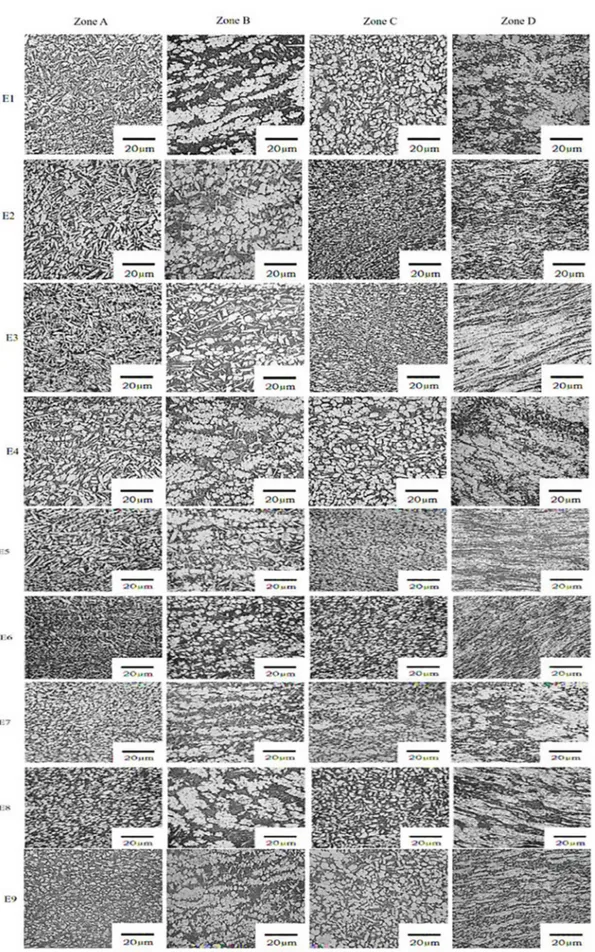
3.2 Microstructure
Details of microstructure of the welds obtained under
different welding conditions are shown in Fig. 6. The microstructures of the FSW consist mainly of α and β'
phase with varying volumes, depending on the local peak temperature caused by increasing rotation speed, decreasing
the Welding speed and shoulder diameter. The schematic diagram of the various zones shows differentiation as Zones
A, B, C and D as shown in Fig. 4. Figure 6. shows zone A
corresponding to the stir zone consisting of the primary α phase with an average grain size of 23.6µm. Zone B, which is present in the subsurface consists of elongated α and β' phases. The center of the stir zone is considered as zone C which is composed of equiaxed α and β' phases with an average grain size of 22.3µm. The bottom of the stir zone is
considered as zone D with an average grain size of 13.2µm.
Table 5. macrostructure analysis of the welded joints under different level of parameters.
S. No Input Process Parameters Macrostructure Defects Rationale
1
Axial Load = 12kN Rotational Speed = 1200rpm Welding Speed = 60mm/min
RS AS
Tunnel defect in the bottom
of the weld cross section in the retreating side
Insufficient heat generation
and axial force
2
Axial Load = 14kN Rotational Speed = 1200rpm Welding Speed = 80mm/min
RS AS
Tunnel defect in the bottom
of the weld cross section in the advancing side
Insufficient heat generation
and axial force
3
Axial Load = 14kN Rotational Speed = 1600rpm
Welding Speed = 100mm/ min
RS AS
Tunnel defect in the bottom
of the weld cross section in the advancing side
Insufficient heat generation
and axial force
4
Axial Load = 14kN Rotational Speed = 1400rpm Welding Speed = 60mm/min
RS AS
Pin hole in the weld cross section of the retreating side
Low frictional heat generation
5
Axial Load = 16kN Rotational Speed = 1200rpm
Welding Speed = 100mm/ min
RS AS
Tunnel defect in the bottom
of the weld cross section in the retreating side
Insufficient heat generation and inadequate stirring
6
Axial Load = 16kN Rotational Speed = 1400rpm Welding Speed = 80mm/min
RS AS
No defect sufficient heat generation and flow of metal
7
Axial Load = 16kN Rotational Speed = 1600rpm Welding Speed = 60mm/min
RS AS
No defect sufficient heat generation and transportation of metal
of the optimum welding condition for improved properties inclusive of hardness and tensile strength.
The microstructure demonstrates the possibility of grain refinement in the weld nugget zone under all welding conditions. This is the result of the plastic deformation caused by the tool pin. The diameter of the shoulder, is triggered by sufficient or insufficient heat generation to the
weld nugget zones. Previous researchers saw the occurrence
of grain refinement in the weld nugget zone on pure Cu, Cu
alloy and brass27-31. The higher volume of the light etching
phase in the microstructure of all welding condition is also
clearly seen. This is the feature when compared to the dark
etching phase that is elongated in a direction perpendicular
to the axis of the tool rotation. There is also the suggestion of the higher amount of α phase having a positive effect
on corrosion resistance. It noticed from the Fig. 6 the
differences among the microstructures of the NAB alloy
in this investigation are related to processing parameters. Under all the welding conditions at zone A, a smaller the grain size is found to be 20µm under the welding condition
of 100mm/min, 1400rpm and 12kN. This occurrence is due to the effect of a combination of a higher Welding speed, a
moderate rotation speed and a lower axial load that provide a
sufficient heat transfer rate across the surface zone, resulting in α phase. Further it is also noticed zone A, consist of coarser Widmanstätten α phase which is the transformation product of β formed on the crystallographic planes in the β phases during a subsequent cooling rate. Similar results
were observed by Oh-Ishi et al. and Mustafa et al21,32. This phenomenon is due to the effect of a higher heat flow to the
surface arising from the lower welding speed. Compared to a higher welding speed, the lower and moderate welding speed resulted in the generation of severe deformation and
dynamic recrystallization, causing Widmanstätten α in the top surface zone. A higher Widmanstätten α was observed
mainly in the upper surface of samples (E1-E6). Further,
a lower amount of Widmanstätten α was seen in the E7, E8 and E9 samples. This result indicated the higher peak
temperature in near surface zone (zone A) is higher for E1 to E6 samples when compared to the temperature attained in E7, E8 and E9 samples. Oh-ishi et al.17,21 observed a similar
kind of result for the increase in localized temperature in the
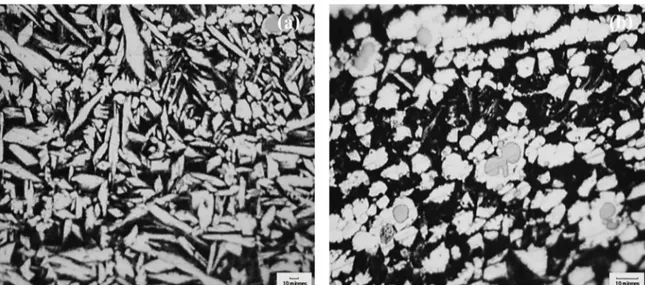
SZ. During, E1 to E6 welding conditions indicated that the
in Fig. 7a17. In the microstructures of the samples E7 to E9 having α phase combined with β transformation products, α
phase is elongated in the traverse direction perpendicular to the tool axis as shown in Fig. 7b. In addition, as can be seen
from the Fig. 7b, the amount of the β constituent appears to be higher while compared to Fig. 7a. The existence of β phase is due to the reverse eutectoid reaction α + κiii → β,
which indicates the increase in temperature above 930•C21. This is due to the employment of higher welding speed. The
increase in size of the globular particles as can be seen in Fig. 7b was larger in size when compared to Fig. 7a.
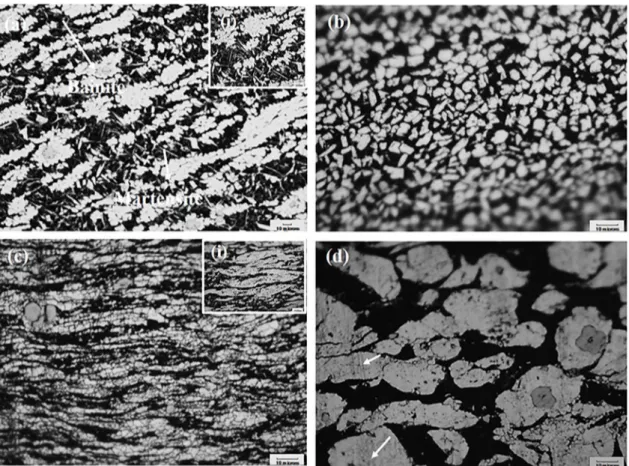
Zone B has an elongated band like structure, consisting of α and β' grains. The elongated and banded structures
appear in the horizontal direction of the welded sample.
α and β' phases are also seen in the FSW samples for all
welding conditions. Samples welded under the axial of load 16kN and tool rotation speed of 1600rpm along with the Welding speed of 60mm min-1, consisted of Widmanstätten α phases and equiaxed α and β transformation products (see Fig. 6). This was due to the change in heat input and material flow in SZ. Which leads to higher temperature
gradient and strain gradient when compared to other welding conditions. In the above mentioned welding condition, the temperature gradient and strain gradient could have been
higher compared to other welding conditions. The remaining welded samples displayed banded α structure in larger in
size due to incomplete recrystallization, followed by a severe deformation. As a result, the microstructure consists
of very little amount of Widmanstätten α phase and higher amount of elongated banded α in zone B. Compared to Fig. 7a Widmanstätten α grain is finer in Fig. 8a. Furthermore,
the dark etching areas seen in the images, consist of a
combination of, Widmanstätten α, bainite and martensite. This indicated the peak temperature exceeding the eutectoid
temperature in the SZ during the welding process. A similar
kind of result was noticed by Oh-Ishi and Mcnelley17. As can be seen from the microstructure, twins were identified in the α phase, especially in the banded and stream like α
structure (see Fig. 8a-i and c-i) as reported by D.R. Ni et al 22. Zone C was seen located at the middle of the stir zone and consisted of equiaxed grains of α phase surrounded by the transformation product of the β' phase (see Fig. 8b). This is the consequence of the dynamic recrystallization resulting severe deformation effect produced in the middle of the stir zone despite the formation of equiaxed α and β' phase transformation products through a sufficient heat flow into the region. The amount of β'is lower in this zone when compared zone B. The fine grain microstructure in Zone C (13.5µm and 15.7µm) was
also observed when a welding speed of 60mm-1 min/80mm -1min, rotation speed of 1600rpm/1400rpm and an axial load of 16kN were employed. The presence of globular particles in κii phase is obvious. This is seen in all zones of welding conditions in the vicinity of the interface. Incomplete dissolution of the κii
particles has been observed throughout the welding conditions from the microstructure which is the result of below the solvus
temperature. Further the primary α phase consisting of a lamellar structure α+ κiii phase in cast material has been retransformed in to β'. This happened as a result of SPD by FSW. Therefore, lamellar structure α+ κiii phases were not seen in the micrograph.
The bottom of the stir zone is considered as zone D. The stream like pattern in zone D consists of elongated α and β' grains aligned in a horizontal direction (see Fig. 8c). This
stream-like pattern observed arises as a result of tool rotation and material in this region exhibiting deformation producing
much finer grains of α and β' phases. In zone D, the cooling rate being the most beneficial parameter for the formation of fine microstructure reported by Ni et al 7. The average grain size in Zone D was found to be 10µm, lower than that seen in
the other zones such as zone A, zone B and zone C. A lower Welding speed, irrespective of the axial load and rotational
speed results in a stream like pattern. This has been caused
by a severe deformation and a dynamic recrystallization in
the bottom zone resulting in much fine grains with elongated
stream like structure. Moreover, the edge of the pin acts
as a tool shoulder for the bottom of the stir zone. This, in
turn, increases the temperature at the bottom of the weld
nugget zone. However, as seen from the microstructure the presence of β' phase was lower (see Fig. 8c), compared to other zones. This was due to the smaller strain and lower
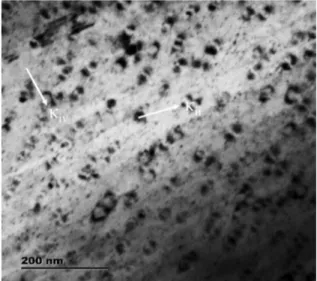
peak temperatures at zone D. Further, the annealing twins are
apparent still at higher magnification in the primary α grains
indicated by white arrows (see Fig. 8d), this indicated the concurrent occurrence of the recovery and recrystallization occurs concurrently with phase transformations during FSW.
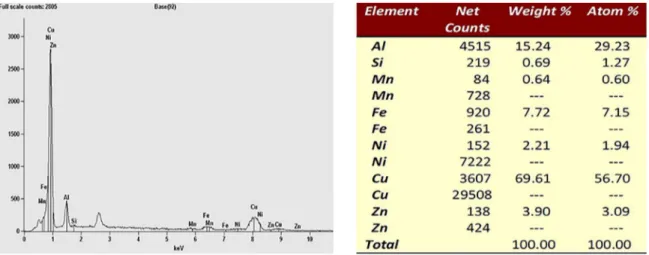
The experimental results of macrostructure, microstructure, hardness, and joint strength, shows the joint fabricated using a 1600 rpm, 60 mm/min, and 16kN showed a defect free weld joint in comparison with other welding joints. A detailed analysis of this particular joint
was made using scanning electron microscope (SEM),
and energy dispersive spectrum (EDS). The results are
Figure 8. Optical micrograph for different processing condition of FSW of NAB alloy : (a) zone B and (b) zone C (c) zone D and (d) Higher magnification image of C
presented in Figs. 9 and 10. The SEM picture shows the distribution of different zones from top to bottom. The EDS results reveal the composition of the stir zone. The cooling rate has also influenced the microstructure of the various zones. The top and bottom zone of the welded area experiences fast cooling and efficient heat transfer takes
place, as the top face was exposed to air cooling and the bottom face transfer the heat through the steel backing plate, whereas the inner part experiences slow cooling
rate. As a result, the fast cooling rate was a benefit for the formation of fine microstructure, which is also observed by
the earlier investigation7,21. Further, a complete dynamic recrystallization was observed in single phase and quasi-
single phase metallic materials during FSW33,34. Plastic flow and the recrystallization process are quite difficult
in the multiple-phases materials during FSW. Xie et al.35 stated that during FSW dual-phase brass (Cu-38Zn
alloy) lead to incomplete dynamic recrystallization in
the SZ. This was observed in the nugget zones, surface zone was characterized by fine completely recrystallized
grains, while the remaining zones consist of coarse and
non-recrystallized grains. This is due to the fact that the presence large amount of residue of fine β' phase (CuZn),
Figure 9. SEM images of various zones (a) Surface zone (b) Subsurface zone (c) Middle zone (d) Bottom zone (e) RS-TMAZ (f) AS-TAMZ
Figure 10. EDS results at the stir zone and Quantitative Results for Base 92
3.3 Effect of FSW Process Parameters on
Microhardness
Fig. 11. shows the hardness distribution of the FSW
specimens under different welding conditions. In this study, Vicker's hardness measurements were taken for the FSW samples in the range of -10mm to +10mm at intervals of 1mm. These measurements were taken by varying the axial load and rotational speed along with the welding speeds. Higher
hardness values were found for all FSW conditions in the stir zone at the center within a distance of about -2mm to
+2mm. The hardness of the stir zone was found to be higher than that of the base materials, TMAZ and HAZ. Hardness
was observed as more for 100mm/min, 1400rpm and 12kN
than for the other welding parameters. This happened as
a consequence of the retention of heat generation in the
stir zone for a short duration, in the case of a low Welding speed. As a result, the cooling rate was lower, leading to grain growth in the stir zone. Moreover, heat retention in the material behind the tool was less in the case of a higher Welding speed 100mm/min as the tool moved faster causing
faster cooling down for the material. This led to a restriction
in grain growth while the sizes of the grains were found to
be 20µm. Hence, hardness value was higher in the stir zone
for a higher Welding speed. On the other hand, a higher rotation speed could be also seen as leading to the increase
in hardness over the lower rotation speed. This happened due to the effect of dynamic recrystallization taken up by
region from top to bottom were noticed. It is worth pointing out the microstructure subsurface and middle of the stir zone showed a higher grain size compared to the upper surface and bottom surface in the lower axial load. In the higher axial
load, the behavior of the microstructure was different from
that seen in the lower axial load, displaying coarse grains in the upper surface more than in the other surfaces of the stir
zone. This was due to the high intensity of heat input and
lower heat transfer rate to the zone B, zone C and zone D.
also confirmed by the presence of coarse grains in the FSW samples this is shown in Fig. 13.
Figure 11. Microhardness of the various FSW zones of the NAB alloy
Under the welding condition of 16kN/60mm -1min/1600rpm and 16kN/80mm-1min/1400rpm homogeneous distribution of fine κi (Fe- rich phase) and κii particles
was observed throughout the microstructure in the stir zone due to the higher stirring action of the FSW tool.
The higher number of coarser globular κii particles
wrecked into smaller particles by severe deformation during FSW as shown in Fig. 12. Further, even though local peak temperatures attained above the solvus
temperature, 930 °C for this phase. The attainment
of such peak temperatures was observed in the faster
processes during FSW but κii need more time and strain
to dissolve the coarse particles. Sherburn et al36. found κii continuous heating was necessary for dissolving the coarse particles. The excessive plastic deformation
taking place during FSW is the main reason for the slight deviation in hardness in the middle region of the weld
nugget. Increase in the hardness values in TMAZ is the
result of formation of an elongated fine grain observed this is shown in Fig.13. It is attributed to the effect of mechanical string action and heating triggered by both
tool pin and shoulder. Below the tool shoulder in TMAZ, the lamellar morphology α+ κiii phase is reverted to β'
phase which is the initial stage of the Base NAB alloys
during heating. This microstructure indicates α and β'
phase undergone well-suited deformation temperature at
above the eutectoid, but below the κiv solvus temperature in TMAZ. The heat affected zone (HAZ) is usually seen
as characterized by the lower hardness values of the FSW
samples. HAZ is caused by the mechanical welding force and frictional heat by the FSW tool shoulder. HAZ is
Figure 12. κiv and κii Particles
Figure 13. Heat affected zone (HAZ) and Thermomechnnical affected zone (TMAZ)
Tensile test was carried out for NAB alloy and FSW joints and the results are displayed in Fig. 14. The tensile property of the FSW weld joints depends on the welding
condition and the composition of the base metal. Among
all the welding joints, the sample, welded under the axial
load of 16kN, at a welding speed of 60 mm/min and tool rotational speed of 1600 rpm, results in the fractured within
the HAZ where the strength was the lower in the traverse
tensile specimen, as characterized by large grains compared
with the SZ, well matching with the hardness measurement.
Despite the presence of defects in the weld nugget zone,
fracture occurred in the HAZ. This is due to the occurrence
of dynamic recrystallization in weld nugget zone, therefore
strained rate which leads to crack initiation in HAZ. Hence,
the tensile strength was higher or similar to the base metal.
This result indicates the stir zone (SZ) having a higher yield
strength compared to the base metal, while the fracture region has the lowest hardness among the various zones of weld sample. In addition, the hardness plays the role of protection in the weld nugget zone. Among all the welding condition lower tensile strength values were displayed by the specimens welded under the tool rotational speed of 1400rpm, welding speed of 100mm/min and axial load of 12kN, fracture took place in the middle region of the stir
zone. This is the consequence of inadequate heat generation
(cold bonding) which gives rise to the tunnel defect in the
weld region. The mechanical properties of any welded specimen have different microstructures arising as the result of inadequate heat generation from top to bottom leading to the formation of tunnel defect in the weld generation. The mechanical properties of the joints are likely to vary from standard tensile specimens' test taken out from the joints.
3.4 Analysis of variance
The S/N ratio of each process parameters was calculated
for corresponding results of hardness and tensile strength. It
is calculated based on higher the better quality characteristics.
Analysis of variance can be used for determining the percentage of contribution using Minitab software. Details of the results of ANOVA for the hardness and tensile strength are given
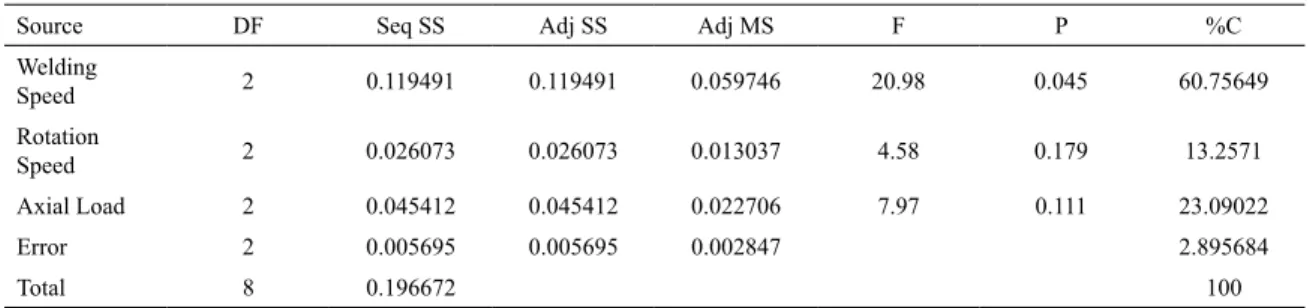
in Table 6 and 7. Table 6 displays the welding speed is most
contributing factor to a 60.76% to the hardness, followed
by the axial load 23.09% and rotation speed 13.26%. This
happened due to the higher the welding speed lesser will be
the heat dissipation at the weld joint. Table 7 shows axial
load as most contributing factor to a 34.80%, followed by
Table 6. Analysis of variance for S/N ratio
Source DF Seq SS Adj SS Adj MS F P %C
Welding
Speed 2 0.119491 0.119491 0.059746 20.98 0.045 60.75649
Rotation
Speed 2 0.026073 0.026073 0.013037 4.58 0.179 13.2571
Axial Load 2 0.045412 0.045412 0.022706 7.97 0.111 23.09022
Error 2 0.005695 0.005695 0.002847 2.895684
Total 8 0.196672 100
Table 7. Analysis of variance for S/N ratio
Source DF Seq SS Adj SS Adj MS F P %C
Welding
Speed 2 1.2186 1.2186 0.6093 15.82 0.059 30.65568
Rotation
Speed 2 1.29581 1.29581 0.64791 16.83 0.056 32.59801
Axial Load 2 1.3837 1.3837 0.69185 17.97 0.053 34.80901
Error 2 0.07701 0.07701 0.0385 1.9373
Total 8 3.97512 100
Figure 14. Tensile strenght of the base metal and the FSW samples
rotation speed 32.60% and welding speed 30.66% on the tensile strength.
4. Conclusions
Friction stir welding of NAB alloy is the subject
matterof this experimental study. Welding was carried out by varying the tool rotation speed, welding speed and axial load. Study of macrostructures, microstructures, tensile strength and microhardness of the friction stir
welded NAB alloy has been done. The major conclusions
drawn from the investigation are given below.
i. There is the possibility of grain refinement in the
weld nugget zones for all welding conditions.
This is the result of the occurrence of plastic
the weld nugget zones, and in-turn arising from the tool pin and diameter of the shoulder.
ii. The SZs for all FSW parameters could be divided
in to four zones from the surface to bottom:
Widmanstätten α, α phase and β transformation products in the zone A, banded α and β' phase in zone B, equiaxed α and β' in the zone C and streamlike in the α and β'.
iii The banded α structure that appeared in the zone B,
resulted from the incomplete dynamic recrystallization and intense plastic deformation of FSW.
iv The development of coarse Widmanstätten α is proof
of that the local peak temperature during FSW being
1000 °C. Retention of the κii phase throughout all stir zones in this investigation indicates the inadequacy of
the time at the temperature for complete dissolution
of the constituent into the β' phase.
v The β'phase seen in the images, consist of a combination of, Widmanstätten α, bainite and martensite. This indicated the peak temperature exceeding the eutectoid temperature in the SZ
during the welding process.
vi Considering the various zones of the FSW samples into consideration, the maximum hardness seen in
stir zone satisfies the Hall-Petch relationship.
vii Of all the FSW conditions, defect free weld was observed under the employment of an axial load of 16kN, Welding speed of 60mm min-1/ 80mm
min-1 and rotational speeds of 1400/1600rpm.
A fine microstructure in the zone C and zone D of the stir zone was also observed under these welding conditions due to the low content of heat input in this welded area.
viii The sample with and without defects results in a fracture on the HAZ. This is due to the occurrence of dynamic
recrystallization in weld nugget zone and hardness behaves as protection in the weld nugget zone. ix Based on the ANOVA, it is observed that, the
percentage contribution of welding speed, rotation speed and axial load on hardness as 60.76%, 23.09%
and 13.26% are respectively. The percentage
contribution of welding speed, rotation speed and axial load on tensile strength were 34.80%, 32.60% and 30.66% respectively.
5. Acknowledgements
The authors are grateful to Anna University, Chennai for their financial support under the scheme of Anna Centenary
Research Fellowship (ACRF) to carry out this research
work. The authors also acknowledge the experimental
facilities provided by Dr. V.S. Senthil Kumar, Associate Professor,Department of Mechanical Engineering, CEGC, Anna University, Chennai-25.
6. References
1. Culpan EA, Rose G. Corrosion Behaviour of Cast Nickel Aluminium Bronze in Sea Water. British Corrosion Journal. 1979;14(3):160-166.
2. Lorimer GW, Hasan F, Iqbal J, Ridley N. Observation of
microstructure and corrosion behaviour of some aluminium bronzes. British Corrosion Journal. 1986;21(4):244-248.
3. Cenoz I. Metallography of aluminium bronze alloy as cast in permanent iron die. Association of Metallurgical Engineers of
Serbia. 2010;16(2):115-122.
4. Wharton JA, Barik RC, Kear G, Wood RJK, Stokes KR, Walsh
FC. The corrosion of nickel-aluminium bronze in seawater.
Corrosion Science. 2005;47(12):3336-3367.
5. Olson DL, Siewert TA, Liu S, Edwards GR, eds. ASM Handbook
Volume 6: Welding, Brazing, and Soldering. Materials Park:
ASM International; 1993.
6. Anantapong J, Uthaisangsuk V, Suranuntchai S, Manonukul A.
Effect of hot working on microstructure evolution of as-cast
Nickel Aluminium Bronze alloy. Materials & Design. 2014; 60: 233-243.
7. Ni DR, Xue P, Wang D, Xiao BL, Ma ZY. Inhomogeneous
microstructure and mechanical properties of friction stir processed NiAl bronze. Materials Science and Engineering: A. 2009;524(1-2):119-128.
8. Fuller MD, McNelley TR. Friction stir processing and fusion welding in nickel aluminum propeller bronze. Monterey, California: Naval Postgraduate School. March 2006.
9. Liu HJ, Zhou L, Liu QW. Microstructural characteristics and mechanical properties of friction stir welded joints of Ti-6Al-4V titanium alloy. Materials & Design. 2009;31(3):1650-1655.
10. Sato YS, Arkom P, Kokawa H, Nelson TW, Steel RJ. Effect
of microstructure on properties of friction stir welded Inconel Alloy 600. Materials Science and Engineering: A. 2008;477(1-2):250-258.
11. Rhodes CG, Mahoney MW, Bingel WH, Spurling RA, Bampton CC. Effects of friction stir welding on microstructure of 7075
aluminum. Scripta Materialia. 1997;36(1):69-75.
12. Mishra RS, Ma ZY. Friction stir welding and processing. Materials
Science and Engineering: R: Reports. 2005;50(1-2):1-78.
13. Avula D, Singh RKR, Dwivedi DK, Mehta NK. Effect of Friction
Stir Welding on Microstructural and Mechanical Properties of Copper Alloy. World Academy of Science, Engineering and
Technology. 2011; 74:214-222.
14. Chao YJ, Qi X, Tang W. Heat Transfer in Friction Stir
Welding-Experimental and Numerical Studies. Journal of Manufacturing
Science and Engineering. 2003;125(1):138-145.
15. Lee WB, Jung SB. The joint properties of copper by friction
stir welding. Materials Letters. 2004;58(6):1041-1046.
16. Li HB, Jiang ZH, Feng H, Zhang SC, Li L, Han PD, et al.
Microstructure, mechanical and corrosion properties of friction stir welded high nitrogen nickel-free austenitic stainless steel.
17. Oh-Ishi K, McNelley TR. Microstructural modification of
as-cast NiAl bronze by friction stir processing. Metallurgical
and Materials Transactions A. 2004; 35: 2951-2961.
18. Fuller M.D., Swaminathan S, Zhilyaev AP, McNelley TR.
Microstructural transformations and mechanical properties of cast NiAl bronze: Effects of fusion welding and friction stir processing. Materials Science and Engineering: A. 2007;463(1-2):128-137.
19. Mahoney MW, Bingel WH, Sharma SR, Mishra RS.
Microstructural Modification and Resultant Properties of Friction Stir Processed Cast NiAl Bronze. Material Science
Forum. 2003;426-432:2843-2848.
20. Lotfollahi M, Shamanian M, Saatchi A. Effect of friction stir processing on erosion-corrosion behavior of nickel-aluminum bronze. Materials & Design (1980-2015). 2014;62: 282-287.
21. Oh-Ishi K, McNelley TR. The influence of friction stir processing
parameters on microstructure of as-cast NiAl bronze. Metallurgical
and Materials Transactions A. 2005;36(6):1575-1585.
22. Ni DR, Xiao BL, Ma ZY, Qiao YX, Zheng YG. Corrosion
properties of friction-stir processed cast NiAl bronze. Corrosion
Science. 2010;52(5):1610-1617.
23. Sabbaghzadeh B, Parvizi R, Davoodi A, Moayed MH.
Corrosion evaluation of multi-pass welded nickel-aluminum bronze alloy in 3.5% sodium chloride solution: A restorative application of gas tungsten arc welding process. Materials
& Design. 2014; 58:346-356.
24. Joo SM. Joining of dissimilar AZ31B magnesium alloy and
SS400 mild steel by hybrid gas tungsten arc friction stir welding.
Metals and Materials International. 2013;19(6):1251-1257.
25. Kumar S, Kumar S. Multi-response optimization of process
parameters for friction stir welding of joining dissimilar Al alloys by gray relation analysis and Taguchi method. Journal of
the Brazilian Society of Mechanical Sciences and Engineering.
2015;37(2):665-674.
26. Palanivel R, Laubscher RF, Dinaharan I, Murugan N. Tensile
strength prediction of dissimilar friction stir-welded
AA6351-AA5083 using artificial neural network technique. Journal of
the Brazilian Society of Mechanical Sciences and Engineering.
2016;38(6):1647-1657.
27. Park HS, Kimura T, Murakami T, Nagano Y, Nakata K, Ushio
M. Microstructures and mechanical properties of friction stir
welds of 60% Cu-40% Zn copper alloy. Materials Science and
Engineering: A. 2004;371(1-2):160-169.
28. Xie GM, Ma ZY, Geng L. Development of a fine-grained
microstructure and the properties of a nugget zone in friction stir welded pure copper. Scripta Materialia. 2007;57(2):73-76.
29. Shen JJ, Liu HJ, Cui F. Effect of welding speed on microstructure
and mechanical properties of friction stir welded copper.
Materials & Design. 2010;31(8):3937-3942.
30. Meran C. The joint properties of brass plates by friction stir
welding. Materials & Design. 2006;27(9):719-726.
31. Moghaddam MS, Parvizi R, Haddad-Sabzevar M, Davoodi
A. Microstructural and mechanical properties of friction stir
welded Cu-30Zn brass alloy at various feed speeds: Influence
of stir bands. Materials & Design. 2011;32(5):2749-2755.
32. Rizi MS, Kokabi AH. Microstructure evolution and microhardness
of friction stir welded cast aluminum bronze. Journal of Materials Processing Technology. 2014;214(8):1524-1529.
33. Xie GM, Ma ZY, Geng L, Chen RS. Microstructural evolution and mechanical properties of friction stir welded Mg-Zn-Y-Zr
alloy. Materials Science and Engineering: A. 2007;471(1-2):63-68.
34. Jata KV, Semiatin SL. Continuous dynamic recrystallization during friction stir welding of high strength aluminum alloys.
Scripta Materialia. 2000;43(8):743-749.
35. Xie GM, Ma ZY, Geng L. Partial recrystallization in the nugget zone of friction stir welded dual-phase Cu-Zn alloy.
Philosophical Magazine. 2009;89(18):1505-1516.