ISSN 0104-6632 Printed in Brazil
www.abeq.org.br/bjche
Vol. 23, No. 03, pp. 405 - 415, July - September, 2006
Brazilian Journal
of Chemical
Engineering
PHASE BEHAVIOR OF OLIVE AND
SOYBEAN OILS IN COMPRESSED PROPANE
AND N-BUTANE
P. M. Ndiaye
1, M. Lanza
2, F. W. Tavares
1, C. Dariva
2, D. Oliveira
2and J. Vladimir Oliveira
2*1
Escola de Química, Universidade Federal do Rio de Janeiro, Cidade Universitária, Rio de Janeiro, 21949-900, RJ, Brazil.
2
Department of Food Engineering, URI-Campus de Erechim, Av. Sete de Setembro, 1621, Erechim-RS, 99700-000, Fax: +55-54-3520-9000, Brazil.
E-mail: [email protected]
(Received: October 20, 2004 ; Accepted: April 14, 2006)
Abstract - The aim of this work is to report the experimental data and thermodynamic modeling of phase equilibrium of binary systems containing soybean and olive oils with propane and n-butane. Phase equilibrium experiments were carried out using the static synthetic method in a high-pressure variable-volume view cell in the temperature range from 30 to 70oC and varying the solvent overall composition from 5 to 98 wt%. Vapor-liquid, liquid-liquid and vapor-liquid-liquid phase transitions were observed at relatively low pressures. The Peng-Robinson and the SAFT equations of state without any binary interaction parameters were employed in an attempt at representing the phase behavior of the systems. Results show the satisfactory performance of SAFT-EoS in predicting qualitatively all phase transitions reported in this work.
Keywords: Vapor-liquid equilibria; Liquid-liquid equilibria; Triglycerides; Propane; N-butane.
INTRODUCTION
Triglycerides and their fatty acid esters are important raw materials in many industrial processes. Their transformation provides products with high market values such as monoglycerides, widely used as emulsifiers in the food, cosmetics and pharmaceutical industries (Schmid, 1987; Ranalli and Mattia, 1997; Shiomori et al., 1995; Bhaskar et al., 1993). Furthermore, the transesterification of oil and fats produces a mixture of esters known as biodiesel. Such products have attracted considerable environmental interest in the past few years, mainly due to the low levels of pollutant emitted by user engines. Generally, the oil transformation in industrial scale is commonly accomplished by an acid or base-catalyzed reaction. However, yields
reported as well as the quality of the products are usually low (Al Saadi and Jeffreys, 1981).
406 P.M. Ndiaye, M. Lanza, F.W. Tavares, C. Dariva, D. Oliveira and J. Vladimir Oliveira
The majority of these studies was carried out using supercritical carbon dioxide because it is a nonflammable and nontoxic solvent and is inexpensive and readily available at a high purity (Florusse et al., 2004; Bruin, 1999). Carbon dioxide, either as an expanded liquid or as a supercritical fluid, may be a viable solvent for a variety of conventional reactions. However, a limiting factor in the use of carbon dioxide is the triglycerides solubility, which requires relatively high pressures. Moreover, as shown by Oliveira and Oliveira (2001), the partial solubility of carbon dioxide can significantly affect the reaction yields.
Thus, more studies are needed on the phase equilibrium of triglyceride mixtures and their fatty acid esters in an alternative medium, which would allow the use of moderate pressures. Propane or n-butane could be a good choice since their critical pressures are relatively low compared to that of carbon dioxide. Numerous studies have reported a relatively high solubility of triglycerides and their fatty acids and in propane (Pareda et al., 2002; Straver et al., 1998; De la Fuente et al., 1994, 1997; Coorens et al., 1988). Nevertheless, to our knowledge, no phase equilibrium experimental data involving soybean and olive oils in propane and n-butane have been reported in the literature. In this context, the aim of this work is to investigate the
phase behavior and thermodynamic modeling of binary systems consisting of soybean and olive oils in propane and n-butane.
EXPERIMENTAL
Materials
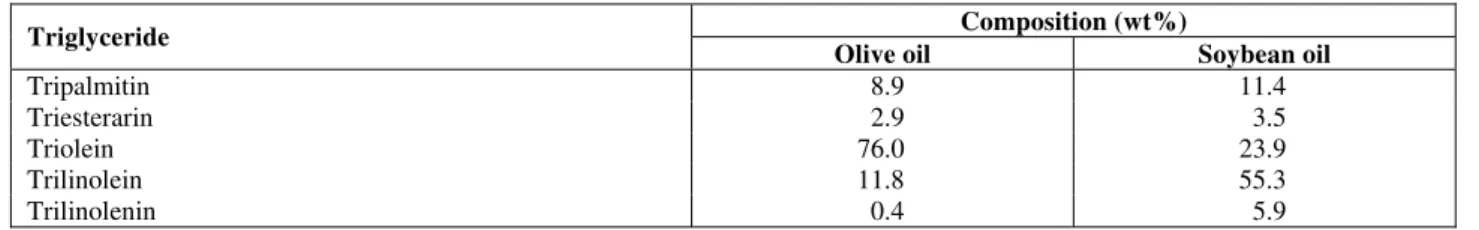
The propane and n-butane used in this work were supplied by White Martins S.A at a purity higher than 99.5%. The vegetable oils (olive – Otoyan, and soybean - Soya) were purchased from a commercial household and were used without any additional treatment. The oils were stored in a dry place and protected from sunlight prior to use. The fatty acid composition of soybean and olive oils was determined using a gas chromatograph (Agilent 6850 Series GC System). The following instrumentation and conditions were used: capillary column DB-23 Agilent (50% cyanopropyl-methylpolysiloxane, 60 m x 0.25 mm i.d. x 0.25 μm film thickness); split ratio: 1:50; injection volume: 1.0 μL. Column temperature was programmed from 175 °C to 215 °C - 5 °Cmin-1. Helium was the carrier gas, and the injection and detector temperatures were 250 °C and 280 °C, respectively. The chemical compositions of the vegetable oils used in this work are presented in Table 1.
Table 1: Chemical composition of vegetable oils used in this work.
Composition (wt%) Triglyceride
Olive oil Soybean oil
Tripalmitin 8.9 11.4
Triesterarin 2.9 3.5
Triolein 76.0 23.9
Trilinolein 11.8 55.3
Trilinolenin 0.4 5.9
Experimental Procedure
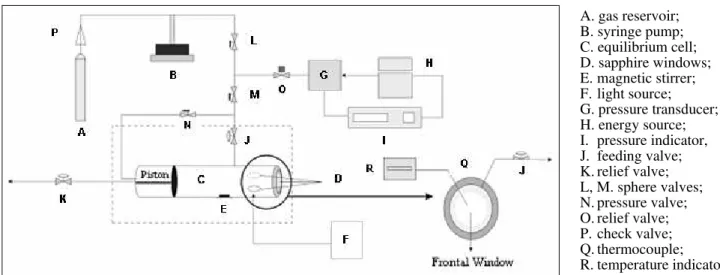
The experimental apparatus and procedure used in this study are described in detail elsewhere (Dariva et al., 2001; Corazza et al., 2003). Phase equilibrium experiments (cloud points) were carried out in a high-pressure variable-volume view cell. The apparatus basically consists of a view cell with two sapphire windows for visual observations, an absolute pressure transducer (Smar LD 301) with a precision of ± 0.31 bar, a portable programmer (Smar, HT 201) for the pressure data acquisition, and a syringe pump (ISCO 500D). The equilibrium cell includes a movable piston, which permits pressure control inside the cell. Phase transitions were observed visually through manipulation of the pressure using the syringe pump with the solvent as pressurizing fluid. The experimental apparatus is
schematically presented in Figure 1.
A. gas reservoir; B. syringe pump; C. equilibrium cell; D. sapphire windows; E. magnetic stirrer; F. light source; G. pressure transducer; H. energy source; I. pressure indicator, J. feeding valve; K. relief valve; L, M. sphere valves; N. pressure valve; O. relief valve; P. check valve; Q. thermocouple; R. temperature indicator.
Figure 1: Schematic Diagram of the Experimental Apparatus.
THERMODYNAMIC MODELING
In this work, two equations of state were employed for representing the phase equilibrium experimental data: the Peng-Robinson-EoS (Peng and Robinson, 1976) and the SAFT-EoS (Huang and Radosz 1990, 1991). In the Peng-Robinson model, the conventional van der Waals mixing and combining rules were used:
( )
1n n 2
i j i j i 1 j 1
a x x a a
= =
=
∑∑
(1)n n
i j i j
i 1 j 1
b b
b x x
2
= =
+
⎛ ⎞
= ⎜ ⎟
⎝ ⎠
∑∑
(2)In these equations, the binary interaction parameters were set to zero. Experimental information about the critical properties of pure component and acentric factors needed to describe the phase behavior of vegetable oils through an equation of state. In this work, the Constantinou and Gani group contribution method (Constantinou and Gani, 1994) was adopted to estimate triglyceride critical constants and the acentric factor. Oils were treated as pseudocomponents, and critical properties were obtained by weighing the individual values of oil triglyceride constituents with their respective compositions, as presented in Table 1. In Table 2 the properties of pure compounds employed in this work are listed. For propane and n-butane they were taken from the literature (Reid et al., 1987).
Table 2: Parameters of the compounds investigated in this work.
Compound Tc (K) Pc (bar) w MW(g/gmol)
Soybean oil 969.8 3.3 2.280 871.9
Olive oil 993.4 3.3 2.540 925.9
Propane 369.4 42.5 0.213 44.0
n-Butane 425.9 3.0 0.644 46.1
SAFT-EoS
Over the past decade, the Statistical Associating Fluid Theory (SAFT) (Huang and Radosz 1990, 1991) has been successfully employed in the calculation of phase equilibrium of systems containing macromolecules, especially those with polymers (Ndiaye et al., 2001; Chen et al., 1992;
408 P.M. Ndiaye, M. Lanza, F.W. Tavares, C. Dariva, D. Oliveira and J. Vladimir Oliveira
(association effect). A detailed description of SAFT-EoS can be found elsewhere (Huang and Radosz 1990, 1991). Briefly, this equation is written in terms of the residual Helmholtz free energy (ares),
res ref pert
a a a
RT = RT + RT (3)
where aref and apert are the reference and perturbation terms, respectively. The reference part of the SAFT-EoS includes the hard-sphere, chain and association contributions, while the perturbation part accounts for the relatively weaker mean-field dispersion-like effects. The reference term of SAFT-EoS is given by
ref hs chain ass
a a a a
RT =RT+ RT + RT (4)
where ahs, achain and aass denote free energy contribution to hard-spheres, chain formation and association, respectively.
The perturbation part, or dispersion term, of the SAFT-EoS is a power series in temperature and density, as proposed originally by Alder et al. (1972) and has been extended to mixtures using the van der Waals one-fluid theory. This free energy contribution is j i disp 3 ij i j a u m D RT kT ξ ⎡ ⎤ ⎡ ⎤ = ⎢ ⎥ ⎢ ⎥ τ ⎣ ⎦ ⎣ ⎦
∑∑
(5)where Dij are universal constants determined by
Chen and Kreglewski (1977) and τ=0.74048. For mixtures, the segment number m is expressed as
i i i
m=
∑
x m (6)and the dispersion energy, u
kT, is calculated using a based-volume fraction mixing rule, as suggested by Huang and Radosz (1991)
ij i j i j u u f f kT kT ⎛ ⎞ = ⎜ ⎟ ⎝ ⎠
∑∑
(7)The volume fraction of component i (f ) is i defined as
o i i i i o
j j j j
x m v f
x m v
=
∑
(8)and the cross-interaction energy term, uij,is given by
the combining rule
( )
1/ 2 ij i ju = u u (9)
with
0 i i
e
u u 1
kT
⎛ ⎞
= ⎜ − ⎟
⎝ ⎠ (10)
o i
v is the temperature-dependent segment molar volume, related to the temperature-independent
(vooi )
o o oo i i i
3u v v 1 C exp
kT
⎡ ⎛ ⎞⎤
= ⎢ − ⎜⎜− ⎟⎟⎥
⎢ ⎝ ⎠⎥
⎣ ⎦ (11)
where C is a universal constant (in this work,
C=0.12),
o i
u
k is the temperature-independent segment energy and e/k is a universal constant (e/k=10 K for all compounds in this work).
The final form of the SAFT-EoS is given in terms of the compressibility factor and is obtained by taking the derivative of the residual Helmholtz free energy with respect to density as
res
hs disp chain ass
T,x
a RT
Z 1 Z Z Z Z
⎛ ⎛ ⎞⎞
∂
⎜ ⎜⎜ ⎟⎟⎟
⎜ ⎝ ⎠⎟
= + + + + = ρ⎜ ⎟
∂ρ
⎜ ⎟
⎜ ⎟
⎝ ⎠
(12)
compressed liquid density (Acosta et al., 1996; Ndiaye et al., 2004). SAFT-EoS parameters for propane and n-butane were taken from the literature (Huang and Radosz 1990). In Table 3 the SAFT-EoS parameters for all components employed in this work are presented.
RESULTS AND DISCUSSION
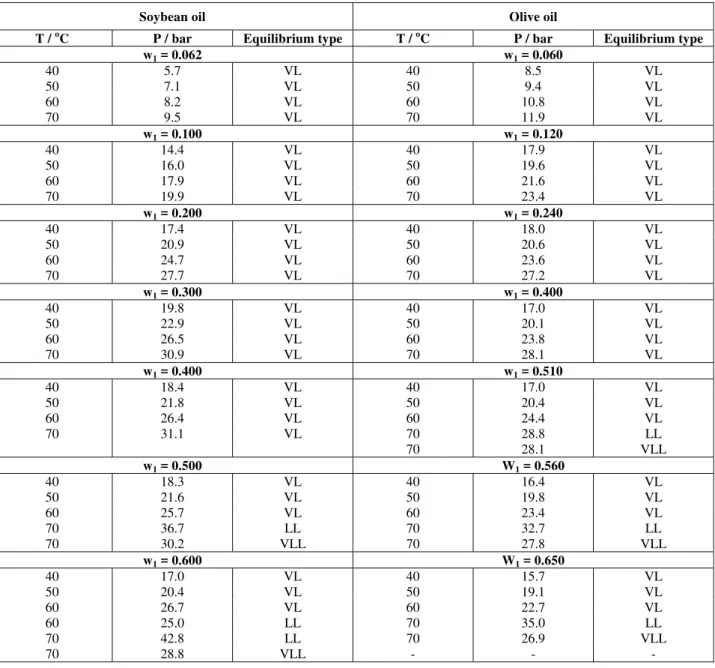
In Table 4 the P-T-x data for the binary systems soybean and olive oils in propane are presented while in Table 5 the P-T-x data for n-butane/soybean oil and n-butane/olive oil systems are shown.
Table 3. SAFT-EoS parameters.
Parameter Compounds
m v
oo
[mol/mL]
o u
k
[K]
Soybean oil 40.32 12.00 218.91
Olive oil 40.53 12.00 212.32
Propane 2.696 13.457 193.03
n-Butane 3.458 12.599 195.11
Table 4 P-T-x data for propane(1)/soybean oil (2) and for propane (1)/olive oil (2).
Soybean oil Olive oil
T / oC P / bar Equilibrium type T / oC P / bar Equilibrium type
w1 = 0.062 w1 = 0.060
40 5.7 VL 40 8.5 VL
50 7.1 VL 50 9.4 VL
60 8.2 VL 60 10.8 VL
70 9.5 VL 70 11.9 VL
w1 = 0.100 w1 = 0.120
40 14.4 VL 40 17.9 VL
50 16.0 VL 50 19.6 VL
60 17.9 VL 60 21.6 VL
70 19.9 VL 70 23.4 VL
w1 = 0.200 w1 = 0.240
40 17.4 VL 40 18.0 VL
50 20.9 VL 50 20.6 VL
60 24.7 VL 60 23.6 VL
70 27.7 VL 70 27.2 VL
w1 = 0.300 w1 = 0.400
40 19.8 VL 40 17.0 VL
50 22.9 VL 50 20.1 VL
60 26.5 VL 60 23.8 VL
70 30.9 VL 70 28.1 VL
w1 = 0.400 w1 = 0.510
40 18.4 VL 40 17.0 VL
50 21.8 VL 50 20.4 VL
60 26.4 VL 60 24.4 VL
70 31.1 VL 70 28.8 LL
70 28.1 VLL
w1 = 0.500 W1 = 0.560
40 18.3 VL 40 16.4 VL
50 21.6 VL 50 19.8 VL
60 25.7 VL 60 23.4 VL
70 36.7 LL 70 32.7 LL
70 30.2 VLL 70 27.8 VLL
w1 = 0.600 W1 = 0.650
40 17.0 VL 40 15.7 VL
50 20.4 VL 50 19.1 VL
60 26.7 VL 60 22.7 VL
60 25.0 LL 70 35.0 LL
70 42.8 LL 70 26.9 VLL
410 P.M. Ndiaye, M. Lanza, F.W. Tavares, C. Dariva, D. Oliveira and J. Vladimir Oliveira
Continuation Table 4
Soybean oil Olive oil
T / oC P / bar Equilibrium type T / oC P / bar Equilibrium type
w1 = 0.700 w1 = 0.800
40 17.6 VL 40 15.0 VL
50 20.8 VL 50 18.2 VL
60 29.1 LL 60 21.9 VL
60 25.2 VLL 70 34.1 LL
70 45.8 LL 70 26.4 VLL
70 29.0 VLL - - -
w1 = 0.750 w1 = 0.830
40 16.3 VL 40 15.0 VL
50 19.6 VL 50 18.4 VL
60 26.1 LL 60 22.3 VL
60 24.8 VLL 70 32.8 LL
70 42.9 LL 70 26.7 VLL
70 28.2 VLL - - -
w1 = 0.850 w1 = 0.880
40 16.8 VL 40 14.5 VL
50 19.7 VL 50 17.8 VL
60 24.8 VL 60 21.7 VL
70 40.2 LL 70 29.4 LL
70 29.0 VLL 70 26.0 VLL
w1 = 0.920 w1 = 0.920
40 16.0 VL 40 14.7 VL
50 19.2 VL 50 17.9 VL
60 23.9 VL 60 21.6 VL
70 31.4 LL 70 26.3 VL
70 28.4 VLL
w1 = 0.950 w1 = 0.960
40 14.2 VL 50 17.2 VL
50 17.5 VL 60 21.0 VL
60 21.4 VL 70 25.1 VL
70 25.7 VL - - -
w1 = 0.980 -
40 13.1 VL - - -
50 16.2 VL - - -
60 20.0 VL - - -
70 24.1 VL - - -
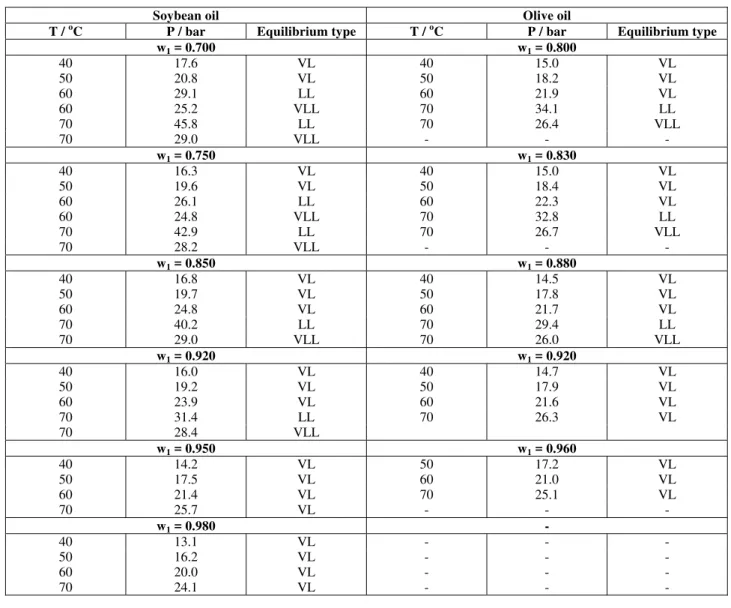
Table 5: P-T-x data for n-butane(1)/soybean oil (2) and for n-butane(1)/olive oil (2).
Soybean oil Olive oil
T / oC P / bar Equilibrium type T / oC P / bar Equilibrium type
w1 = 0.050 w1 = 0.051
30 2.9 VL 30 2.5 VL 40 3.0 VL 40 2.7 VL 50 3.2 VL 50 2.9 VL 60 3.6 VL 60 3.2 VL 70 4.2 VL 70 3.5 VL
w1 = 0.075 w1 = 0.100
30 4.2 VL 30 5.1 VL 40 4.7 VL 40 5.3 VL 50 5.3 VL 50 5.6 VL 60 6.0 VL 60 5.7 VL 70 6.6 VL 70 5.8 VL
w1 = 0.100 w1 = 0.125
Continuation Table 5
Soybean oil Olive oil
T / oC P / bar Equilibrium type T / oC P / bar Equilibrium type
w1 = 0.110 w1 = 0.150
30 7.8 VL 30 10.4 VL
40 8.0 VL 40 10.7 VL
50 8.4 VL 50 10.9 VL
60 9.0 VL 60 11.5 VL
70 9.7 VL 70 12.2 VL
w1 = 0.125 w1 = 0.220
30 14.6 VL 30 12.1 VL 40 14.8 VL 40 12.7 VL 50 15.1 VL 50 13.3 VL 60 15.4 VL 60 13.9 VL 70 15.9 VL 70 14.8 VL
w1 = 0.150 w1 = 0.300
30 13.7 VL 30 10.4 VL 40 14.1 VL 40 11.0 VL 50 14.6 VL 50 11.9 VL 60 15.1 VL 60 13.0 VL 70 15.8 VL 70 14.1 VL
w1 = 0.200 w1 = 0.400
30 12.2 VL 30 9.1 VL 40 12.6 VL 40 9.9 VL 50 13.4 VL 50 10.7 VL 60 14.1 VL 60 12.0 VL 70 15.2 VL 70 13.5 VL
w1 = 0.300 w1 = 0.500
30 10.7 VL 30 7.7 VL 40 11.3 VL 40 8.5 VL 50 12.2 VL 50 9.5 VL 60 13.2 VL 60 10.7 VL 70 14.4 VL 70 12.0 VL
w1 = 0.400 w1 = 0.65
30 9.1 VL 30 7.2 VL 40 10.0 VL 40 7.9 VL 50 11.1 VL 50 9.0 VL 60 12.4 VL 60 10.1 VL 70 13.7 VL 70 11.4 VL
w1 = 0.500 w1 = 0.800
30 8.8 VL 30 5.5 VL 40 9.7 VL 40 6.4 VL 50 10.7 VL 50 7.6 VL 60 11.7 VL 60 8.8 VL 70 12.9 VL 70 10.1 VL
w1 = 0.800 w1 = 0.900
30 6.3 VL 30 5.3 VL 40 7.2 VL 40 6.1 VL 50 8.4 VL 50 7.2 VL 60 9.6 VL 60 8.6 VL 70 11.1 VL 70 10.0 VL
w1 = 0.950 -
30 4.4 VL - - - 40 4.7 VL - - - 50 5.8 VL - - - 60 7.0 VL - - - 70 8.7 VL - - -
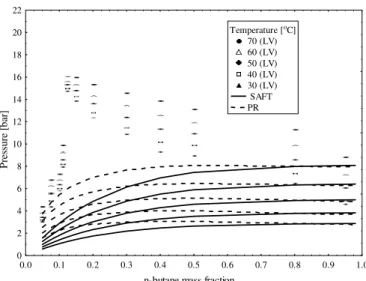
Figures 2 to 5 are experimental P-x projections at various temperatures for the systems investigated. Points are experimental data, whereas dashed and full lines are respectively the Peng-Robinson and SAFT EoS calculations. These figures show that
412 P.M. Ndiaye, M. Lanza, F.W. Tavares, C. Dariva, D. Oliveira and J. Vladimir Oliveira
temperatures up to 60 oC. At 70 oC, in addition to the vapor-liquid transition, liquid and liquid-liquid-vapor transitions were recorded. In all these figures one can observe a pressure maximum in the P-x projection at low solvent composition especially for n-butane. Because all temperatures investigated here are below the solvent critical temperature, a maximum in pressure in the P-x plane for vapor-liquid equilibrium of a true-binary system should indicate the formation of an azeotrope. However, the formation of an azeotrope was not experimentally observed. Thus, the maximum observed in the P-x diagrams for vapor-liquid coexistence might be explained by the polydisperse nature of soybean and olive oils (see Table 1). This fact also explains why the vapor-liquid-liquid region is not a line, as one would expect for a true binary system, but rather a
band. For systems with propane and soybean oil or olive oil, the same trend is observed with a slightly smaller effect of polydisperse oils.
It may be important to call attention to the fact that both thermodynamic equations of state were used without any binary interaction parameters. Results show that, in contrast to the Peng-Robinson EoS, which predicts only vapor-liquid transition at all temperatures and compositions investigated, the SAFT-EoS is able to predict all transitions experimentally observed but with an overprediction for the liquid-liquid immiscibility region. It is believed that to improve the performance of both models, the polydisperse nature of vegetable oils should be taken into account. This topic is now under investigation within our working group.
propane mass fraction
P[b
ar
]
0.0 0.2 0.4 0.6 0.8 1.0
0 5 10 15 20 25 30 35 40 45 50 55 60 65 70
Temperature [oC] 70 (LL) 70 (LLV) 70 (LV) 60 (LL) 60 (LLV) 60 (LV) 50 (LV) 40 (LV) PR EOS SAFT EOS
Figure 2: Pressure versus composition phase diagram for the propane/soybean oil system. Comparison of experimental values and predictive calculations using the PR and the SAFT equations of state.
propane mass fraction
P
re
ssu
re
[b
ar
]
0.0 0.1 0.2 0.3 0.4 0.5 0.6 0.7 0.8 0.9 1.0
0 5 10 15 20 25 30 35 40 45 50 55 60 65 70
Temperature [o C] 70 (LL) 70 (LLV) 70 (LV) 60 (LV) 50 (LV) 40 (LV) 30 (LV) SAFT PR
n-butane mass fraction
P
re
ss
u
re
[b
ar]
0.0 0.1 0.2 0.3 0.4 0.5 0.6 0.7 0.8 0.9 1.0
0 2 4 6 8 10 12 14 16 18 20 22
Temperature [oC] 70 (LV) 60 (LV) 50 (LV) 40 (LV) 30 (LV) SAFT PR
Figure 4: Pressure versus composition phase diagram for the n-butane/soybean oil system. Comparison of experimental values and predictive calculations using the PR and the SAFT equations of state.
n-butane mass fraction
P
re
ssu
re
[b
ar
]
0.0 0.1 0.2 0.3 0.4 0.5 0.6 0.7 0.8 0.9 1.0
0 2 4 6 8 10 12 14 16 18 20 22
Temperature [oC] 70 60 50 40 30 SAFT PR
Figure 5: Pressure versus composition phase diagram for n-butane/olive oil system. Comparison of experimental values and predictive calculations using the PR and the SAFT equations of state.
CONCLUSIONS
The phase behavior of soybean and olive oils were experimentally investigated in this work. Vapor-liquid, liquid-liquid and vapor-liquid-liquid transitions were observed when propane was used as solvent, while for systems with n-butane, only vapor-liquid phase equilibrium was detected. In all cases investigated a complete miscibility was reached in the overall composition range investigated at relatively low pressures. The polydisperse nature of vegetable oils is more outstanding at low solvent concentrations. This means that compressed propane or butane may be an alternative medium for fractionating the vegetable oils. The Peng-Robinson and the SAFT EoS presented only a qualitative
representation of the experimental data when no binary interaction parameters were employed in the calculations.
ACKNOWLEDGEMENTS
The authors thank CNPq, CAPES, FAPERGS and ANP/FINEP - PETROBRAS for the scholarship and financial support of this work.
REFERENCES
414 P.M. Ndiaye, M. Lanza, F.W. Tavares, C. Dariva, D. Oliveira and J. Vladimir Oliveira
Trilaurin, Triolein, and n-Tridecane from 303 K to 353 K from Atmospheric Pressure to 150 MPa, J. Chem. Eng. Data, 41,961 (1996).
Alder, B.J., Young, D.A., Mark, M.A., Studies in Molecular Dynamics 10. Corrections to Augmented van der Waals Theory for Square-Well fluid, J. Chem. Phys., 56, 3013 (1972). Al Saadi, A.N. and Jeffreys, G.V., Esterification of
Butanol in a Two-Phase Liquid-Liquid System. AIChE J., 27, 754 (1981).
Bhaskar, A.R., Rizvi, S.S.H. and Sherbon, J.W., Anhydrous Milk Fat Fractionation with Continuous Countercurrent Super-critical Carbon Dioxide, Journal of Food Science, 58, 748 (1993). Bruin, S., Phase Equilibria for Food Product and
Process Design, Fluid Phase Equilibria, 158-160, 657 (1999).
Chen, S.J., Economou, I.G. and Radosz, M., Density-Tuned Polyolefin Phase-Equilibria 2. Multicomponent Solutions of Alternating Poly(Ethylene Propylene) in Subcritical and Supercritical Olefins - Experiment and SAFT Model, Macromolecules, 25, 4987 (1992).
Chen, S.S. and Kreglewski, A., Applications of Augmented van der Waals Theory of Fluids. 1. Pure fluids, Ber. Bunsen-Ces. Phys. Chem., 81, 1048 (1977).
Constantinou, L. and Gani, R., New Group Contribution Method for Estimating Properties of Pure Compounds. AIChE J., 40, 1697 (1994). Coorens, H.G.A., Peters, C.J. and Arons, J.S., Phase
Equilibria in Binary Mixture of Propane and Tripalmitin, Fluid Phase Equilibria, 40, 135 (1988).
Corraza, M.L., Cardozo, L.F., Antunes, O.A.C. and Dariva, C., Phase Behavior of the Reaction Medium of Limonene Oxidation in Supercritical Carbon Dioxide, Ind. Eng. Chem. Res., 42, 13, 3150 (2003).
Dariva, C., Oliveira, J.V., Tavares, F.W. and Pinto, J.C., Phase Equilibria of Polypropylene Samples with Hydrocarbon Solvents at High Pressures, Journal of Applied Polymer Science, 81, 3044 (2001).
De la Fuente, J.C., Mabe, G.D., Brignole, E.A. and Bottini, S.B., Phase Equilibria in Binay Mixtures of Ethane and Propane with Sunflower oil, Fluid Phase Equilibria, 101, 247 (1994).
De la Fuente, J.C., Fornari, T., Brignole, E.A. and Bottini, S.B., Phase Equilibria in Mixtures of Triglycerides with Low-Molecular Weight Alkanes, Fluid Phase Equilibria, 128, 1, 2, 221 (1997). Florusse, L.J., Fornari, T., Bottini, S.B. and Peter,
C.J., Phase Behavior of Carbon
Dioxide-Low-Molecular Weight Triglycerides Binary Systems: Measurements and Thermodynamic Modeling, J. Supercrit. Fluids, 31, 123 (2004).
Huang, S.H. and Radosz, M., Equation of State for Small, Large, Polydisperse and Association Molecules, Ind. Chem. Eng. Res., 29, 2284 (1990).
Huang, S.H. and Radosz, M., Equation of State for Small Large, Polydisperse and Associating Molecules: Extention to Fluid Mixtures, Ind. Chem. Eng. Res., 30,1994 (1991).
Jackson, M.A. and King, J.W., Lipase-Catalyzed Glycerolysis of Soybean Oil in Supercritical Carbon Dioxide, J. Am. Oil Chem. Soc, 74, 2, 103 (1997).
King, M.B., Bott, T.R., Barr, M.J. and Mahmud, R.S., Equilibrium and Rate Data for the Extraction of Lipids using Compressed Carbon Dioxide, Separation Science Technology, 22, 1103 (1987).
Ndiaye, P.M., Dariva, C., Oliveira, J.V. and Tavares, F.W., Phase Behavior of Isotactic Polypropylene/c4-Solvents at High Pressure. Experimental Data and SAFT Modeling, J. Supercrit. Fluids, 21, 93 (2001).
Ndiaye P.M., Oilveira D., Dariva C., Oliveira J.V. and Tavares F.W., Vapor Pressure Data of Soybean Oil, Castor Oil and their Fatty Acid Ethyl Ester Derivatives, J. Chem. Eng. Data, 50, 2, 330 (2005).
Oliveira, D. and Oliveira, J.V., Kinetics of Enzymatic Alcoholysis of Palm Kernel Oil in Supercritical CO2, Ind. Eng. Chem. Res., 39, 12, 4450 (2000).
Oliveira, D. and Oliveira, J.V., Enzymatic Alcoholysis of Palm Kernel Oil in n-Hexane and in SCCO2, J. Supercrit. Fluids, 19, 141 (2001). Pareda, S., Bottini, S.B. and Brignole, E.A.,
Gas-Liquid Reactions under Supercritical Conditions Phase Equilibria and Thermodynamic Modeling, Fluid Phase Equilibria, 194-197, 493 (2002). Peng, S.Y. and Robinson, D.B. A New
Two-Constant Equation of State, Ind. Eng. Chem. Fund.,8, 59 (1976).
Ranalli, A. and Mattia, G., Characterization of Olive Oil Produced with a New Enzyme Processing aid, J. Am. Oil Chem. Soc., 74, 9, 1105 (1997).
Reid, R.C., Prausnitz, J.M. and Poling, B.E., The Properties of Gases and Liquids, McGraw-Hill Book Company, 4th Edition, 1987.
Savage, P.E., Gopalan, S., Mizan, T.I., Martino, C.J. and Brock, E.E., Reactions at Supercritical Conditions: Applications and Fundamentals, AIChE J., 41, 1723 (1995).
Schmid, R.D., Biotechnology: Application to Oleochemistry, J. Am. Oil Chem. Soc., 64, 4, 563 (1987).
Shiomori, K., Hayashi, K.T., Baba, Y., Kawano, Y.
and Hano, T., Hydrolysis Rates of Olive Oil by Lipase in a Monodispersed o/w Emulsion System using Membrane Emulsification, Journal of Fermentation and Bioengineering, 80, 6, 522 (1995). Straver, E.J.M., de Roo, J.L., Peters, C.J. and Arons,