*Departamento de Engenharia de Estruturas, Escola de Engenharia de São Carlos, USP,Departamento de Engenharia de Estruturas, Escola de Engenharia de São Carlos, USP,Escola de Engenharia de São Carlos, USP, Av. Trabalhador São-carlense, 400, 13560-970 São Carlos - SP, Brazil, e-mail: [email protected]: [email protected]
A Study of Steel Bar Reinforcement Corrosion in Concretes with SF and SRH
Using Electrochemical Impedance Spectroscopy
Fernanda Giannotti da Silvaa*, Jefferson Benedicto Libardi Liboriob
a
Department of Materials Engineering and Science,
University of São Paulo, São Carlos - SP, Brazil
b
Department of Structure Engineering, University of São Paulo, São Carlos - SP, Brazil
Received: September 21, 2005; Revised: March 31, 2006
Several electrochemical techniques can be used to monitor corrosion, among them are open circuit potential (OCP) and eletrochemical impedance spectroscopy (EIS). Monitoring OCP is the most typical procedure for routine inspection of reinforced concrete structures and can be easily carried out, however it only gives an approximate idea of the corrosion process. EIS is a more complete technique, which supplies information regarding the mechanism and kinetics of reaction electrochemistries, but only used in the laboratory. Based on these two techniques, this study is related to the steel corrosion in high-performance concrete with silica fume and silica from rice husk. The acceleration of the corrosion was carried out using immersion cycles in a 3.5% NaCl solution. As well as high compressive strength values, the addition of silica fume presented low corrosion risks and high impedance module values and significant increases of the concrete resistivity after 22 months of alternate immersion/drying cycles were obtained.
Keywords: high-performance concrete, silica fume, corrosion, eletrochemical techniques
1. Introduction
One of the worst problems related to civil building is steel cor-rosion in reinforced concrete structures. It is considered to be one of the worst and most frequent pathologies of civil building engineering and, as well as being a technical-economical-social problem, it still
represents a great waste of natural resources1,2.
Embedded steel in concrete is protected against corrosion by two
mechanisms: physical and chemical3,4. The chemical protection is
guar-anteed by high pH solution contained in the concrete pores (around 12.5), which causes steel passivation. The physical protection is guaranteed by concrete cover, which impedes aggressive agents reaching the steel.
With the aim of increasing the durability of concretes, new materials are being incorporated into the concrete to improve their properties such as porosity and especially permeability. Therefore, additions which are finer than the cement are being incorporated into the concrete, such as silica fume.
When added to the fresh concrete, silica fume reacts in two ways: a pozzolanic reaction and a filler effect. In the pozzolanic reaction, it reacts with the calcium hydroxide (CH) chemically to produce an additional amount of calcium silicate hydrate (C-S-H), which is responsible for the resistance of the concrete. There is an
obstruc-tion of concrete pores and a reducobstruc-tion of permeability4,5. Moreover,
it still produces a filler effect, filling the spaces created by the free water in the cement matrix and packing the materials in a better way, whose property is due to extreme thinness of material (particles are
100 times smaller than cement grains)6.
Another factor should be mentioned: the ecological issue. These additions are residues from the manufacturing of silicon metal and ferrosilicon alloys, in the case of silica fume, and silica from rice
husk, which are left in the air and pollute the environment7.
As well as endeavoring to have better durability of reinforced concrete structures, there is more and more research being done concerning the standardization of tests to analyse such parameters. Some international standards already recognize some items, however in Brazil there is still much to be done in this area.
Therefore, there are two main aims to this work: to verify the capacity of high-performance concrete in protecting the steel of con-crete structures exposed to harsh environments, such as the sea, and to contribute to a larger knowledge of electrochemical techniques.
The open circuit potential technique is based on the potential dif-ferences of the measurement between metal and solution. Therefore, the voltage difference measurement is done between the steel bar and a
reference electrode, placed in contact with the surface of the concrete1.
The open circuit potential monitoring is a typical procedure in routine inspections of reinforced concrete structures when diagnosing corro-sion. Its use and interpretation are described in the ASTM Standard Test Method for Half-Cell Potential of Reinforcing Steel in Con-crete8. In spite of being very used this method is qualitative, although it is not sufficient in the analysis of the corrosion process.
Furthermore, other techniques have been used when monitoring corrosion, such as electrochemical impedance spectroscopy. The impedance can measure the global physical resistance of metal in a specific environment, with a potential difference or imposed current in alternate signals, which is interpreted as resistive, capacitive and
inductive components9,10. The larger the impedance of the system is,
the more passive the system will be. In other words, the larger the restriction of the electrode to the current passage is and, consequently, the smaller the corrosion rate is. It offers some advantages in rela-tion to the continuous current techniques: it uses very small signals that do not disturb the electrode properties to be measured, it studies corrosion reactions and estimates corrosion rates in low conductivity materials and it also determines the polarization resistance and the
double layer capacitance in the same measurement11.
This technique has been used by an increasing number of re-searches in determining the corrosion rate of reinforcing steel in con-crete. However, interpretation of an impedance spectrum is difficult due to the complexity of cement paste and concrete microstructural changes taking place on steel surfaces. Thus, it is necessary the
2. Experimental
2.1. Production of concretes
For the production of high-performance concrete analyzed in this
work, the following materials were used: portland cement - ABNT14,
whose chemical properties are shown in Table 1; silica fume and silica extracted from rice husk in volumetric partial substitution of portland cement in proportion of 10%, whose chemical compositions are shown in Table 1; quartzous sand with a maximum diameter of 2.4 mm; coarse aggregate of basaltic origin with a maximum diam-eter of 9.5 mm and superplasticizer admixture (SP) whose base is polycarboxylate, added at percentages from 0.4% to 1%.
It is important to highlight that the studied silica fume is already used commercially and silica from rice husk is produced at the laboratory, whose process is described as follows. The rice husk is immersed in an acid solution, followed by washing it in water until the pH of the solution becomes neutral. After being dried, the husk
is burnt, ground and burnt again at a temperature of 600 °C7, which
makes the product white and amorphous (Figure 1).
The ratio of mixtures in this work is 1:3.5, being 3.5 the total of aggregates. The materials constituent used in the mixture is presented in Table 2.
After mixing the materials, the cylindrical and prismatic samples were prepared for the compressive strength and electrochemical tests, respectively. The cylindrical samples had a dimension of 5 cm
diameter by 10 cm in height and the prismatic samples, 5 cm x
5 cm x 12 cm. One commercial steel bar with a diameter of 1 cm was
embedded in each prismatic sample, with a concrete cover of 2 cm. The rest of the bar was sealed with insulating tape and the exposed
rebar area was 9.42 cm2 (Figure 2).
The concretes were cured in a humid chamber kept at 95% of relative humidity and room temperature of 22 ± 2 °C. In the elec-trochemical tests, the samples were cured for 15 days and in the compressive strength tests, the samples were kept in the chamber until the test day. This period is the required time for the development of hydration reactions of material, mainly of the complete formation of
C-S-H, which is responsible for the resistance of concretes15.
2.2. Exposure
The prismatic samples were vertically immersed to a depth of 6 cm (partial immersion) in a 3.5% NaCl solution. For 4 days a week, the samples were partially immersed in a NaCl solution and in the
4 subsequent days in a laboratory atmosphere. After the 19th month
of exposure, the solution concentration was increased from 3.5% to 10%, with the objective of accelerating the penetration of chloride ions into the concrete.
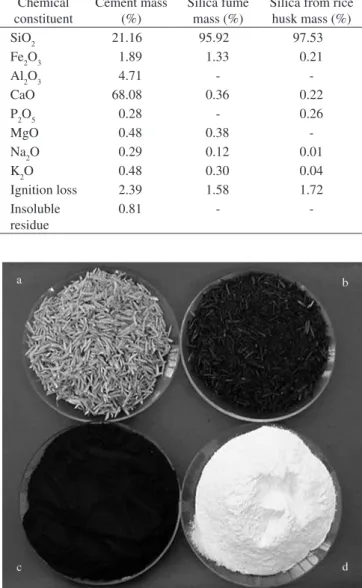
Table 1. Chemical composition of portland cement, silica fume and silica from rice husk.
Chemical constituent
Cement mass (%)
Silica fume mass (%)
Silica from rice husk mass (%)
SiO2 21.16 95.92 97.53
Fe2O3 1.89 1.33 0.21
Al2O3 4.71 -
-CaO 68.08 0.36 0.22
P2O5 0.28 - 0.26
MgO 0.48 0.38
-Na2O 0.29 0.12 0.01
K2O 0.48 0.30 0.04
Ignition loss 2.39 1.58 1.72
Insoluble residue
0.81 -
-Table 2. Mixture proportions and fresh concrete properties. Concrete
Control SF SRH
Cement (Kg/m3) 503.3 454.9 451.4
Silica fume (Kg/m3) - 33.7
-Rice husk silica - - 35.0
Total water (Kg/m3) 176.2 171.0 170.2
Superplasticizer (Kg/m3) 2.52 2.93 5.84
Coarse aggregate (Kg/m3) 792.7 796.1 798.9
Sand (Kg/m3) 968.8 973.0 965.5
Water/binder ratio 0.35 0.35 0.35
Fresh density (Kg/m3) 2432 2417 2400
Figure 1. Phases of silica from rice husk production: rice husk a), rice husk ash before b) and after c) of grinding and silica from rice husk d).
12
cm
5 cm
10
cm
3
cm
2.3. Tests
Concerning the description of the concretes, the compressive
strength tests were done at the 1st, 3rd, 7th, 28th, 63rd and 91st days.
Before the tests, all the samples were checked in order to have a better distribution of the load.
The open circuit potential measurements were taken using the ref-erence electrode of copper/sulfate of copper. A sponge soaked in water and a detergent solution was used to increase the ionic conduction be-tween the electrode and the concrete surface. The measurements were taken as close as possible to the steel using a high impedance voltmeter. All the potential measurements were taken across a concrete cover thickness of only 2 cm, after the immersion period of the samples.
The electrochemical impedance spectroscopy test was carried out using a three- electrode system: the working-electrode consist-ing of the rebar, the reference electrode of copper copper/sulfate and counter electrode consisting of lead. The used equipment was a 1260 Solartron Impedance/Gain-Phase Analyser and 1287 Solartron Electrochemical Interface. Firstly, the 10 mV sine wave was applied, however as the materials were very resistive the sine wave of 30 mV was used, making sure that the system would not be damaged. In all the measurements the same conditions were adopted, with the purpose of preventing errors when comparing and interpreting the results.
3. Results
The compressive strength was tested in 4 samples on the 1st, 3rd,
7th, 28th, 63rd and 91st days. The average results are given in Table 3.
In the analysis of Table 3, it is observed that with the increase of age and silica fume presence, the compressive strength of concretes presented significant resistance increases.
When comparing the two silica types (SF and SRH), it was no-ticed that the difference of the values was small and there was a slight increase in the use of SF. This increase of resistance is associated to the largest efficiency of the silica fume and to the use of additive in its composition. The reaction of silica fume is due to the effect filler and to the pozzolanic reaction. Moreover, the additive reaction is responsible for better defloculation of cement grains and consequently an increase in the hydration rate.
The volumetric substitution of silica in the proposed content increased the maximum resistance by approximately 18% in rela-tion to the concrete without silica considering the period of 91 days. Therefore, the use of silica fume and silica from rice husk reduces the consumption of cement to obtain the same resistance level.
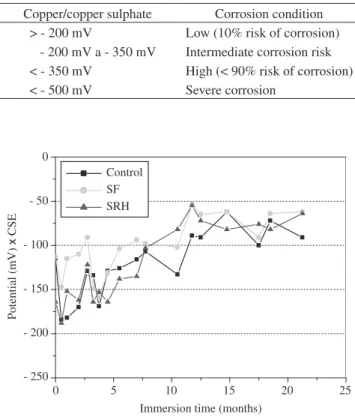
The open circuit potential measurements for the test time pro-vide qualitative information of corrosion, showing its probability of happening. In the graphs in Figure 2, potential values for immersion time are shown.
In Figure 3, the corrosion potential behavior of concretes with SF, SRH and concretes without silica can be observed. The potential values oscillate from - 188 mV to - 62 mV. At the beginning of the cycles, the concretes with SF presented more positive potentials than the concretes with SRH, however it can be noticed that the difference decreased in the last cycles. After 22 months of partial immersion of samples in the NaCl solution, the potential still continues to be at low risk concerning the corrosion, according to ASTM C876 (Table 4), which may suggest passivation of the steel bar, although the above observation alone cannot be taken as conclusive evidence of the passive state of the steel.
It is important to emphasize that the potential oscillation is caused by drying/immersion cycles, in other words, by concrete
humidity16. When the concrete surface is humidified, a decrease in
the resistivity happens, increasing the current flow and changing the potential values.
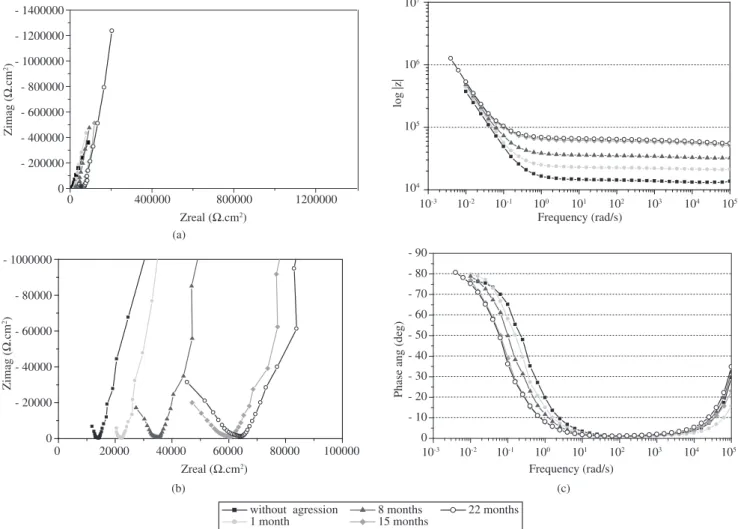
The results obtained by OPC were confirmed in the EIS, by Nyquist and Bode diagrams (Figures 4-6). The Nyquist complex plane
graph is a plot of the resistive Zreal against the capacitive Zimag, while
Bode diagrams are plots of the logarithm of the impedance modulus Z and phase angle against the logarithm of frequency.
In the Nyquist diagram, it can be observed that most of the spectra present similar characteristics, which are described by an electric resistance in series with a RC network (Figure 7). The series
resistance (Rc) accounts for a ionic conduction in the electrolyte
fill-ing the pores, whereas the other elements refer to the double layer
capacitance at the steel/concrete interface (Cdl) and the charge transfer
resistance (Rct).
In some cases, the Nyquist diagram presents a third semicircle in intermediate frequencies, as shown in Figure 5. This semicircle can suggest the formation of new products on the steel surface, among
them the corrosion. However, the capacitive arch between 104 Hz and
10 Hz is related to a fine deposit of calcium hydroxide that grows
on the steel surface slowly after being immersed in concrete17, since
the estimated diameter of the semicircle formed in high frequencies is extremely large. This indicates that the charge transfer resistance
is very high (> 106Ω) and could not be measured in the range of
frequencies tested.
Table 3. Compressive strength of hardened concrete.
Mixture Compressive strength (MPa)
1 day 3 days 7 days 28 days 63 days 91 days
Control 42.3 65.2 78.5 86.0 90.9 93.1
SF 45.4 68.7 83.3 103.2 107.7 110.4
SRH 45.8 65.0 86.9 99.5 105.8 109.2
0 5 10 15 20 25
Potential (mV)
x
CSE
Immersion time (months) 0
- 50
- 100
- 150
- 200
- 250
Control SF SRH
Figure 3. OPC evolution of concrete samples partially immersed in a 3.5% NaCl solution.
Table 4. ASTM criteria for corrosion of steel in concrete.
Copper/copper sulphate Corrosion condition
> - 200 mV Low (10% risk of corrosion)
- 200 mV a - 350 mV Intermediate corrosion risk
< - 350 mV High (< 90% risk of corrosion)
without agression
1 month 8 months 15 months 22 months
0 400000 800000 1200000
- 1400000
- 1200000
- 1000000
- 800000
- 600000
- 400000
- 200000
0
Zimag (
7
.cm
2)
Zreal (7.cm2)
10-3 10-2 10-1 100 101 102 103 104 105
107
106
105
104
log |z|
Frequency (rad/s) (a)
0 20000 40000 60000 80000 100000
- 1000000
- 80000
- 60000
- 40000
- 20000
0
Zimag (
7
.cm
2)
Zreal (7.cm2)
10-3 10-2 10-1 100 101 102 103 104 105
Phase ang (de
g)
Frequency (rad/s) - 90
- 80
- 70 - 60
- 50
- 40 - 30
- 20 - 10
0
(b) (c)
Figure 4. Impedance spectra evolution of concrete sample without silica fume (control) during 22 months of immersion in 3.5% NaCl: a) Nyquist diagram; b) Nyquist diagram - high frequencies; and c) Bode diagrams.
Therefore, in general, all the bars analyzed in the concretes without silica or with SF or SRH are in a passive situation after 22 months of drying/immersion cycles in NaCl solution, according to potential readings.
It can be observed that throughout time and with the increasing number of cycles, the concrete resistivity increases (a shift to larger real impedance values). This increase is caused by the hydration and pozzolanic reactions of the material. Similar behaviors were obtained
by Montemor et al.11, who monitored the corrosion of steel bars in
concrete with fly ash by EIS. The increasing factor of resistivity for concretes without addition was 4 while for concretes with 50% of fly ash, in the same conditions, this fact was 40.
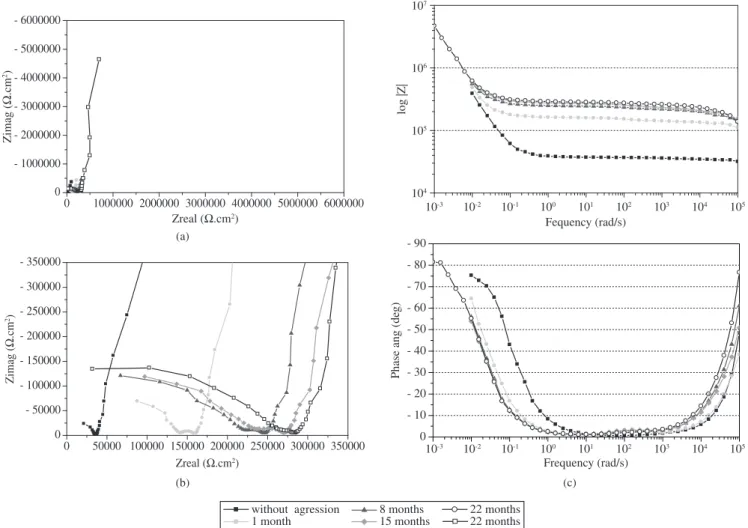
The resistivity evolution for concretes studied in this work was different. Comparing Figures 4-6, the resistivity values of the con-cretes with SF were larger than the concon-cretes with SRH and concon-cretes without silica. After 22 months of analysis, the resistivity of concrete without silica and with SRH was from 4.1 to 4.7 times larger than the resistivity of the concrete before the cycles (for both cement types) and from 7.0 to 7.6 times larger than the concretes with SF, when compared to the initial resistivity (without aggression).
This difference can be seen better in Table 5, where the total
im-pedance values are presented in the frequencies of 102 rad/s, 103 rad/s
and 104 rad/s for the first and last cycles. It can be highlighted that
the adopted frequency values are only related to the resistive part of the material.
Analysing Table 5, it can be observed that the concretes present high total impedance values, especially in the cases in which SF is used. The high impedance values obtained suggest the passivity of the system, in other words, a larger restriction to the current flow.
Figure 8 presents the resistivity evolution of the concrete for the immersion time. The resistivity was estimated by the division of |Z|
(see values shown in Table 5 for frequencies of 104 rad/s) for the
thickness of the sample11.
The increase of concrete resistivity with an increase of immer-sion time can also be observed in the Bode diagrams of Figures 3-5
from |Z| vs. the frequency. A shift can be observed for high values of
|Z| in frequencies above 10 rad/s. It can also be noticed that with the increase of the number of cycles, the resistive part of the material has ever decreasing lower frequencies, as Figure 3 clearly shows.
Still related to the first incomplete arch observed at high
fre-quencies (104 rad/s to 105 rad/s), it was not possible to estimate the
0 1000000 2000000 3000000 4000000 5000000 6000000 0
- 1000000 - 2000000 - 3000000 - 4000000 - 5000000 - 6000000
Zimag (
7
.cm
2)
Zreal (7.cm2)
without agression
1 month 8 months 15 months 22 months 22 months
10-3 10-2 10-1 100 101 102 103 104 105
104
105
106
107
log |Z|
Fequency (rad/s)
0 50000 100000 150000 200000 250000 300000 350000
0 - 50000 - 100000 - 150000 - 200000 - 250000 - 300000 - 350000
Zimag (
7
.cm
2)
Zreal (7.cm2)
10-3 10-2 10-1 100 101 102 103 104 105
0 - 10 - 20 - 30 - 40 - 50 - 60 - 70 - 80 - 90
Phase ang (de
g)
Frequency (rad/s) (a)
(b) (c)
Figure 5. Impedance spectra evolution of concrete sample with silica fume (SF) during 22 months of immersion in 3.5% NaCl: a) Nyquist diagram; b) Nyquist diagram - high frequencies; and c) Bode diagrams.
Table 5. Total impedance values of concretes in 102 rad/s, 103 rad/s and 104 rad/s.
Concretes Immersion time
(months)
Total impedance - |Z|
102 rad/s 103 rad/s 104 rad/s
Control Without agression 14190 13774 13180
1 22412 21942 21317
22 63984 62028 58851
SF Without agression 36789 36039 34555
1 152000 142000 134000
22 274000 261000 234000
SRH Without agression 15635 15269 14444
1 26378 25969 25287
22 73187 70759 66916
especially at high frequencies, where the capacitive arches can be affected by variations of the distance of the reference electrode to the
work electrode, especially in materials of low conductivity18,19.
In Figures 4-6, it can be observed that there was no change in the behavior of samples at low frequencies, and there was no sign of any closing of the third arch, even after 22 months of partial immersion
cycles in NaCl solution. This suggests a high polarization resistance, which is related to the arch diameter, and a smaller corrosion current density. Some extrapolation attempts were made, but the tendency of the points to form the semicircle is small, making the approximate determination of the values impossible.
In the Bode diagrams, the beginning of the corrosion can be
observed by the change of inclination of |Z| vs. frequency and by
obtaining smaller phase angles related to the capacitive effect of double layer capacitance.
In the Bode diagrams it can be observed that not all the concretes have a defined maximum phase angle. In the concretes in which it is possible to identify the maximum phase angle, it can be seen that the same ones have close values to the increase of immersion time, and no significant decrease was observed.
4. Conclusions
0 400000 800000 1200000 0
- 200000 - 400000 - 600000 - 800000 - 1000000 - 1200000 - 1400000
Zimag (
7
.cm
2)
Zreal (7.cm2)
without agression
1 month 8 months 15 months 22 months
10-3 10-2 10-1 100 101 102 103 104 105
104
105
106
107
log |Z|
Frequency (rad/s)
0 20000 40000 60000 80000 100000
0 - 20000 - 40000 - 60000 - 80000 - 100000
Zimag (
7
.cm
2)
Zreal (7.cm2)
10-3 10-2 10-1 100 101 102 103 104 105
Frequency (rad/s) 10
0 - 10 - 20 - 30 - 40 - 50 - 60 - 70 - 80 - 90
Phase ang (de
g)
(a)
(b) (c)
Figure 6. Impedance spectra evolution of concrete sample with silica from rice husk (SHR) during 22 months of immersion in 3.5% NaCl: a) Nyquist diagram; b) Nyquist diagram - high frequencies; and c) Bode diagrams.
Figure 7. Equivalent circuit.
Rc
Rct
Cdl
0 5 10 15 20 25
0 10000 20000 30000 40000 50000
Resisti
vity (
7
.cm)
Immersion time (months)
Control
SF SRH
Figure 8. Resistivity evolution of concrete samples partially immersed in a 3.5% NaCl solution.
In spite of the corrosion process not being observed, even after 22 months of drying/immersion cycles of samples in 3.5% NaCl solution, it can be observed that there is an increase of durability in the concretes by the increase of the total impedance values and resistivity of the materials. The open circuit potential values also show the passivity of the steel bars, the corrosion potential is more than - 200 mV in relation to the reference electrode copper/copper sulphate, in which the low risk of steel corrosion is considered. Thus, the corrosion resistance of the specimens with and without silica appears to follow the sequence: silica fume > silica extracted from rice husk > control.
It is important to emphasize that due to the high resistivity pre-sented by concretes, ways of minimizing the resistance that can be offered to the signal passage, such as the humidity of the concrete,
the preconditioned environment of the samples before reading (OCP or EIS), or even larger variation values of potential applied in the system should be sought.
recom-mended as they proved to be better than the results obtained in con-cretes without silica. Both are residues that pollute the environment, but if added to the concrete, improve its properties.
Concrete without silica also presented satisfactory results after 22 months of immersion/drying cycles, indicating that the execution process of concretes is fundamental: rigorous quality control and careful selection of materials, their best combination, their compat-ibility, mainly of the cement-admixture, their ideal proportions, low water/cement ratio, among other, besides the careful curing process of concretes.
Acknowledgments
The authors would like to thank FAPESP for their financial sup-port. The authors gratefully acknowledge Prof. Sebastião Kuri and Maria Aparecida G. T. Machado for all the support provided during the project.
References
1. Broomfield JP. Corrosion of steel in concrete. St. Edmundbury Press Limited; 1997.
2. Mehta PK. Reducing the Environmental Impact of Concrete. Concrete
International. 2001; 23(10):61-66.
3. Malhotra VM, Carette GG. Silica fume: a pozzolan of new interest for use in some concretes. Concrete Construction. 1982; May: 445-446. 4. Kayali O, Zhu B. Corrosion performance of medium-strength and silica
fume high-strength reinforced concrete in a chloride solutions. Cement
and Concrete Composites. 2005; 27(1):117-124.
5. Bentz DP, Jensen OM, Coats AM, Glasser FP. Influence of silica fume on diffusivity in cement-based materials: I. Experimental and computer modeling studies on cement pastes. Cement and Concrete Research. 2000; 30(6):953-952.
6. Aïtcin PC. Concreto de Alto Desempenho. Tradução Geraldo Serra. São Paulo: Editora Pini; 2000.
7. Liborio JBL. Concreto de alto desempenho com sílica ativa da casca de
arroz. Projeto Temático FAPESP 98/08112-0; 1998.
8. American Society for Testing and Materials. Standard Method for Half Cell Potential of Uncoated Reinforcing Steel in Concrete. ASTM C876. Annual Book of ASTM Standards. Philadelphia; 1991.
9. Ford SJ, Shane JD, Mason TO. Assignment of features in impedance spectra of the cement-paste/steel system. Cement and Concrete Research. 1998; 28(12):1737-1751.
10. Lay, P. et al. An a.c. impedance study of steel in concrete. Journal of
applied electrochemistry. 1985; 15(5):755-766.
11. Montemor MF, Simões AMP, Salta MM. Effect of fly ash on concrete reinforcement corrosion studied by EIS. Cement and Concrete Compos-ites. 2000; 22(3):175-185.
12. Rodríguez P, Ramírez E, Gonzalez JA. Methods for studying corrosion in reinforced concrete. Magazine of Concrete Research. 1994: 46(167): 81-90.
13. Gu, P. et al. A Study of Corrosion Inhibitor Performance in Chloride Contaminated Concrete by Electrochemical Impedance Spectroscopy.
ACI Materials Journal. 1997; 94(5):385-394.
14. Associação Brasileira de Normas Técnicas. Cimento Portland de alta resistência inicial. NBR 5733. Rio de Janeiro; 1991.
15. Taylor HFW. Cement chemistry. London: Thomas Telford Edition; 1997.
16. Silva FG, Tommaselli MAG, Liborio JBL, Kuri SE. A influência da umidade na análise de impedância eletroquímica em concretos. XXIV Congresso Brasileiro De Corrosão, 21 a 25 junho; 2004; Rio de Janeiro.
Anais; 2004.
17. Lemoine L, Wenger F, Galand J. Sutdy of the corrosion of concrete reinforcement by eletrochemical impedance measurement. Corrosion rates of steel in concrete. ASTM STP 1065. 1990; 118-133.
18. Selmo, SMS. Aço carbono em pastas de gesso de construção: estimativas de taxa de corrosão por impedância e por método gravimétrico conjugado
à análise de imagem. Tese (Doutorado) - Escola Politécnica, Universidade
de São Paulo; 1997.