The effect of methotrexate and
azathioprine on the serum levels
of IgA-
αα
αα
α
1
-antitrypsin complex in
juvenile chronic arthritis
1Hochrhein-Institute for Rheumatism Research and Prevention, 79713 Bad Säckingen, Germany
2Department of Rheumatology, Karol Marcinkowski
University School of Medical Sciences, 61-626 Poznan, Poland
3Pediatric Rheumatology Center, 82467 Garmisch-Partenkirchen, Germany J.K. Lacki1,2, K. Klama1,2,
H. Michels3, H. Truckenbrodt3, S. Mackiewicz2 and W. Muller1
Abstract
In the present study we investigated the influence of methotrexate (MTX) and azathioprine (AZA) on the serum levels of the IgA-α1
-antitrypsin (IgA-AT) complex in patients with the systemic form of juvenile chronic arthritis (JCA). Fifty-six JCA patients (22 treated with MTX, 18 treated with AZA, and 16 not treated with any immuno-suppressive agent) were enrolled in the study. MTX dosage ranged from 0.3 to 0.5 mg kg-1 week-1, while AZA was given daily at an
average dose of 1 mg/kg. MTX was given for 13 months (SD = 7 months) whereas AZA for 11 months (SD = 6 months). The average value of the complex was higher in JCA patients than in both control groups (0.74 ± 0.73 U vs 0.37 ± 0.13 U (control children), P<0.001 and vs 0.23 ± 0.12 U (control adults), P<0.001). Values exceeding the
normal range were found in twenty-two JCA patients (39.4%). Serum IgA-AT level was lowest in the MTX group compared to AZA and non-treated patients (0.56 ± 0.24 U, 0.76 ± 0.43 U, 0.95 ± 0.52 U, respectively, P<0.05). IgA values exceeding normal levels for age were found in 14% of the patients. A correlation between the levels of the IgA-AT complex and C-reactive protein (r = 0.43, P<0.01), α1
-acid-glycoprotein (r = 0.45, P<0.01), α1-antichymotrypsin (r = 0.52,
P<0.01), α1-antitrypsin (r = 0.40, P<0.01) and IgA (r = 0.56, P<0.01)
was established.
Correspondence
J.K. Lacki
Department of Rheumatology Karol Marcinkowski University School of Medical Sciences ul. Winogrady 144 61-626 Poznan Poland
Received May 21, 1996 Accepted March 14, 1997
Key words
•Juvenile chronic arthritis •IgA-α1-antitrypsin complex
•Methotrexate •Azathioprine •C-reactive protein •α1-Acid-glycoprotein
•α1-Antichymotrypsin
Introduction
Juvenile chronic arthritis (JCA), the most frequent connective tissue disease in chil-dren, is actually a collection of conditions that together constitute the major forms of chronic arthritis in childhood. The heteroge-neous patterns of symptoms and clinical fea-tures make the uniform assessment of
the inflammatory activity in JCA.
Increased levels of immunoglobulin A-α1-antitrypsin (IgA-AT) complex have been
found in the serum of patients with rheuma-toid arthritis (2-6), ankylosing spondylitis (7,8), and lupus erythematosus (9). In pro-spective studies of early rheumatoid arthritis the complex level at the onset of the disease was significantly higher in the group of pa-tients who developed erosions (2,5). IgA-AT is a nonimmune complex formed by a disulfide bridge between an active thiol group available on the cysteine residue of the alpha heavy chains of IgA and a cysteine at posi-tion 232 of the α1-antitrypsin single
polypep-tide chain (4). Formation of the complex was proved to depend on the level of IgA (3,4,8). The pathological implications of the com-plex formation are still unknown.
The utility of methotrexate (MTX) and azathioprine (AZA) in the treatment of juve-nile chronic arthritis has been shown in nu-merous studies (10-12). Although its mode of action is unknown, clinical improvement during MTX therapy appears a few weeks after the beginning of treatment and the num-ber of side effects is relatively low. The aim of the present study was to estimate the influence of MTX and AZA on the levels of the IgA-AT complex in the systemic and polyarticular form of JCA and the relation-ship between the concentrations of the com-plex and its constituent components and other laboratory markers of inflammation for the disease.
Material and Methods
Patients
Fifty-six patients with the systemic and polyarticular form of JCA (25 females and 31 males, mean age 123 ± 69 months) were stud-ied and their diagnosis was confirmed after at least 6 months of observation. All patients fulfilled the criteria of JCA (1). On the aver-age, disease duration was 76 ± 62 months. Blood samples were obtained at the time of clinical examination. Serum samples were stored at less than -80oC. Twenty-two patients
were treated with MTX, 18 with AZA, and 16 were not treated with any immunosuppressive drug. The clinical data are summarized in Table 1. Patients were randomly assigned to one of two immunosuppressive procedures. MTX dosage ranged from 0.3 to 0.5 mg kg-1
week-1, while AZA was given daily at an
average dose of 1 mg/kg. MTX was given for 13 months (SD = 7 months) and AZA for 11 months (SD = 6 months). Sera from 16 chil-dren (9 females and 7 males, mean age 114 ± 54 months) with congenital malformations served as control. A second control group comprised 22 healthy adult volunteers (7 fe-males and 15 fe-males, mean age 25.6 ± 4.5 years). In all cases systemic connective tissue diseases were excluded.
Immunological methods
The IgA-α1-antitrypsin complex was
evaluated by a double antibody enzyme im-munoassay (EIA) on microtiter plates coated with monoclonal antibody against the IgA-AT complex. Briefly, sera diluted 1:100 were incubated at 37oC for 90 min, the plates were
then emptied and washed 5 times. Bound IgA-AT complex was located by the addi-tion of sheep anti-human IgA antibody and the second antibody, donkey anti-sheep IgG conjugated with peroxidase, was added. OPD peroxidase substrate tablets (Sigma Chemi-cal Co., St. Louis, MO) served as substrate.
Table 1 - Clinical characteristics of the juvenile chronic arthritis (JCA) patients and control populations.
Control adults Control children JCA patients
N = 22 N = 16 N = 56
Fever 0 2 10
Rash 0 0 2
Lymphadenopathy 0 2 4
Hepato- and/or splenomegaly 0 1 22
The plates were read with a spectrophotom-eter at 494 nm. The results were calculated using a calibration curve based on six con-centrations of the reference complex and are reported as arbitrary units (U). Values less than 0.6 U were considered to be normal. Kits were provided by Peptide Therapeutics Limited (Birmingham, England). C-reactive protein (CRP) was estimated by nephelom-etry and CRP values less than 5 mg/l were considered to be normal. α1-Antitrypsin (AT),
α1-acid-glycoprotein (AGP), and α1
-antichy-motrypsin (ACT) levels were measured by immunoelectrophoresis according to Laurell (13). The following range values were con-sidered to be normal for adults: 2-4 g/l for AT, 0.45-1.4 g/l for AGP and 0.30-0.60 g/l for ACT (14). Children tend to have 80% of the adult values of AT, and 90% of AGP and ACT. IgA levels were estimated by radial immunodiffusion according to Mancini et al. (15) on NOR-Partigen IgA plates (Behring, Marburg, Germany).
Statistical analysis
Methods of descriptive statistics were used. Relationships between continuous vari-ables were examined using the Spearman rank correlation coefficient. The chi-square test was used to evaluate the relationship between the complex, erythrocyte sedimen-tation rate (ESR), CRP and clinical manifes-tations of the disease such as fever and hepato-and/or splenomegaly. The Mann-Whitney U-test was applied to determine differences between variables for the groups studied.
Results
The average value of the complex was higher in JCA patients than in both control groups (0.74 ± 0.73 U vs control children:
0.37 ± 0.13 U, P<0.001 and vs control adults:
0.23 ± 0.12 U, P<0.001). Values exceeding the normal range were found in 22 JCA patients (39.4%). We observed the lowest
values of the IgA-AT complex in patients treated with MTX (Figure 1). The increased levels of the complex were correlated with the occurrence of fever (chi-square value with Yates correction = 11.31, P<0.001) and the number of affected joints (r = 0.35, P<0.01) but not with hepato- and/or spleno-megaly. Data for other systemic symptoms were not analyzed statistically because of the small number of patients. The levels of all acute phase proteins (APP) were signifi-cantly increased in the JCA patients com-pared to the controls (Table 2). IgA levels exceeding normal values were found in 8 patients (14.3%), who had increased serum levels of IgA-AT.
The level of the complex was correlated with the levels of its constituent compo-nents: IgA, r = 0.56, P<0.01, and AT, r = 0.40, P<0.01 in JCA patients. There was no correlation between IgA and AT in both control groups. Correlations between IgA-AT complex levels and the acute phase pro-teins CRP (r = 0.43, P<0.01), AGP (r = 0.45, P<0.01), and ACT (r = 0.52, P<0.01) in JCA patients were established.
Discussion
No studies on the IgA-AT complex in
IgA-AT (U)
3.0
All patients N = 56
MTX-treated N = 22
AZA-treated N = 18
Non-treated N = 16 2.5
2.0
1.5
1.0
0.5
0
JCA have been published previously. The present results show that patients with JCA display higher levels of IgA-AT complex than control children and control adults. These higher than normal values were found in 39% of JCA patients and most of them demonstrated an active form of the disease with high APP levels. Elevated levels of the IgA-AT complex have been detected in sera from rheumatoid arthritis patients at frequen-cies of 14 to 60% depending on the popula-tion studied (2,4). Increased levels of the complex were also found in 34-50% of pa-tients with ankylosing spondylitis (7,8), and were correlated with “extraspinal” manifes-tations of the disease such as synovitis, ante-rior uveitis and increased values of ESR, CRP and IgA (8).
Changes in APP levels are of great value in estimating the intensity of inflammation in JCA (16,17) and rheumatoid arthritis (14,17,18). APP constitute a group of pro-teins synthesized mainly by the liver whose concentration increases or decreases in re-sponse to inflammation or injury (14,19).
The correlation between complex level and clinical manifestation of the disease, such as fever and joint involvement, and the acute phase proteins suggests that the IgA-AT com-plex may be a part of the response to inflam-matory stimuli in JCA patients. On the other hand, we found no correlation between the level of the complex and ESR. However, some findings suggest that ESR does not closely reflect the changes in disease activity in children with JCA (20). Due to the slow dynamics of fibrinogen synthesis and its long half-life, ESR increases slowly and persists longer and it is also affected by the immuno-globulin concentration which is relatively low in children.
We noticed that MTX-treated patients had significantly lower levels of IgA-AT complex compared to control groups, sug-gesting a relation with disease activity or a direct destructive action of MTX on the com-plex. There is evidence that some disease-modifying antirheumatic drugs such as gold salts, D-penicillamine, or sulfasalazine may destroy covalent linkage between IgA and
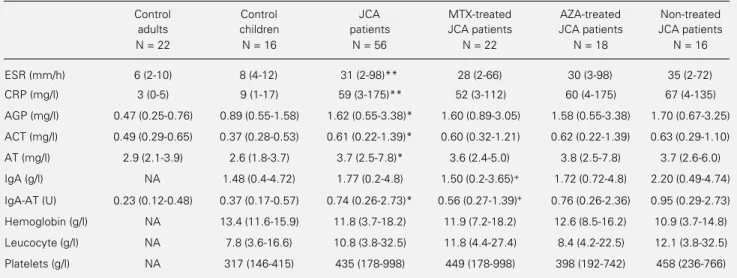
Table 2 - Levels of the IgA-AT complex, acute phase response markers and other laboratory parameters of juvenile chronic arthritis (JCA) patients undergoing immunosuppressive therapy.
ESR, Erythrocyte sedimentation rate; CRP, C-reactive protein; AGP, α1-acid-glycoprotein; ACT, α1-antichymotrypsin; AT, α1-antitrypsin; MTX, methotrexate (0.3-0.5 mg kg-1 week-1 for 13 months); AZA, azathioprine (1 mg/kg for 11 months); Non, not treated with immunosuppressive drugs. Data are reported as means (range). *P<0.01 and **P<0.001 vs control children; +P<0.05 vs non-treated JCA patients (Mann-Whitney U-test). NA, Not analyzed.
Control Control JCA MTX-treated AZA-treated Non-treated
adults children patients JCA patients JCA patients JCA patients
N = 22 N = 16 N = 56 N = 22 N = 18 N = 16
ESR (mm/h) 6 (2-10) 8 (4-12) 31 (2-98)** 28 (2-66) 30 (3-98) 35 (2-72)
CRP (mg/l) 3 (0-5) 9 (1-17) 59 (3-175)** 52 (3-112) 60 (4-175) 67 (4-135)
AGP (mg/l) 0.47 (0.25-0.76) 0.89 (0.55-1.58) 1.62 (0.55-3.38)* 1.60 (0.89-3.05) 1.58 (0.55-3.38) 1.70 (0.67-3.25)
ACT (mg/l) 0.49 (0.29-0.65) 0.37 (0.28-0.53) 0.61 (0.22-1.39)* 0.60 (0.32-1.21) 0.62 (0.22-1.39) 0.63 (0.29-1.10)
AT (mg/l) 2.9 (2.1-3.9) 2.6 (1.8-3.7) 3.7 (2.5-7.8)* 3.6 (2.4-5.0) 3.8 (2.5-7.8) 3.7 (2.6-6.0)
IgA (g/l) NA 1.48 (0.4-4.72) 1.77 (0.2-4.8) 1.50 (0.2-3.65)+ 1.72 (0.72-4.8) 2.20 (0.49-4.74)
IgA-AT (U) 0.23 (0.12-0.48) 0.37 (0.17-0.57) 0.74 (0.26-2.73)* 0.56 (0.27-1.39)+ 0.76 (0.26-2.36) 0.95 (0.29-2.73)
Hemoglobin (g/l) NA 13.4 (11.6-15.9) 11.8 (3.7-18.2) 11.9 (7.2-18.2) 12.6 (8.5-16.2) 10.9 (3.7-14.8)
Leucocyte (g/l) NA 7.8 (3.6-16.6) 10.8 (3.8-32.5) 11.8 (4.4-27.4) 8.4 (4.2-22.5) 12.1 (3.8-32.5)
antitrypsin (3,7,8). Our findings show that such an effect may be also elicited by MTX. A recent study provided evidence that serum IgA is the component organizing the complex (21). The presence of high IgA levels in serum from patients with ankylosing spondylitis (7,8), rheumatoid arthritis (4), and JCA and its correlation with IgA-AT levels suggest that IgA and IgA-AT not only reflect disease activity but may contribute to the pathogenesis itself. The complex is prob-ably produced within inflamed rheumatoid joints, since larger amounts of the IgA-AT
complex are found in synovial fluid than in serum. The complex consumes large amounts of α1-antitrypsin which is a major
antiprote-ase, and may elicit the release of lysosomal enzymes from macrophages by a process dependent on alternative complement path-way activation, thus destroying cartilage and bones and causing erosions. Accordingly, previous reports suggest that persistently in-creased complex levels might be a prognos-tic factor of erosion development in rheuma-toid arthritis (3,6), but this hypothesis re-quires further study.
References
1. Cassidy JT, Levinson JE & Bass JC (1986). A study of classification criteria for a diag-nosis of juvenile rheumatoid arthritis. Ar-thritis and Rheumatism, 29: 274-282. 2. Davis MJ, Dawes PT, Fowler PD,
Shadforth MF, Lewin IV & Stanworth DR (1991). The association and predictive value of the complex immunoglobulin A-alpha 1-antitrypsin in the development of erosions in early rheumatoid arthritis.
Scandinavian Journal of Rheumatology, 20: 23-27.
3. Dawes PT, Jackson R, Shadforth MF, Lewin IV & Stanworth DR (1987). The relationship between the complex of IgA and alpha 1-antitrypsin, its constituent components and the acute phase re-sponse as measured by C-reactive pro-tein in rheumatoid arthritis treated with gold or D-penicillamine. British Journal of Rheumatology, 26: 351-353.
4. Stanworth DR (1985). IgA dysfunction in rheumatoid arthritis. Immunology Today, 6: 43-45.
5. Lacki JK, Schochat T, Porawska W, Mackiewicz SH & Muller W (1995). Does the serum level of IgA-AT complex corre-late with radiological progression of early RA? Rheumatology International, 14: 227-230.
6. Lacki JK, Schochat T, Klama K, Mackiewicz U & Muller W (1995). Does methotrexate affect IgA-AT complex in early RA patients? Clinical Rheumatology, 14: 566-569.
7. Davis MJ, Dawes PT, Bestwick E, Lewin IV & Stanworth DR (1989). Sulphasalazine therapy in ankylosing spondylitis: its ef-fect on disease activity, immunoglobulin A and the complex immunoglobulin A-alpha 1-antitrypsin. British Journal of Rheumatology, 28: 410-413.
8. Struthers GR, Lewin IV & Stanworth DR (1989). IgA-alpha 1-antitrypsin complex in ankylosing spondylitis. Annals of the Rheumatic Diseases, 48: 30-34. 9. Lacki JK, Schochat T, Leszczynski P,
Mackiewicz SH & Muller W (1995). IgA-AT complex in lupus erythematosus patients. Preliminary report. Lupus, 4: 221-224. 10. Ravelli A, Viola S, Ramenghi B, Di-Fuccia
G, Ruperto N, Zonta L & Martini A (1995). Evaluation of response to methotrexate by a functional index in juvenile chronic arthritis. Clinical Rheumatology, 14: 322-326.
11. Ravelli A, Ramenghi B, Di-Fuccia G, Ruperto N, Zonta L & Martini A (1994). Factors associated with response to methotrexate in systemic onset juvenile chronic arthritis. Acta Paediatrica, 83: 428-432.
12. Corona F, Bardare M, Cimaz R & Rognoni MG (1993). Methotrexate in juvenile chronic arthritis. Clinical and Experimental Rheumatology, 11: 346-347.
13. Laurell CB (1973). Quantitative estimation of proteins by electrophoresis in agarose gel containing antibodies. Scandinavian Journal of Clinical Investigation, 124 (Suppl): 2-28.
14. Kushner I & Mackiewicz A (1987). Acute phase proteins as disease markers. Dis-ease Markers, 5: 1-11.
15. Mancini G, Carbonara AO & Heremans JF (1965). Immunochemical quantitation of antigens by single radial immunodiffusion.
Immunochemistry, 2: 235-254.
16. Berner-Berntzen H, Fagerhol MK, Ostensen M, Mowinckel P & Hoyeraal HM (1991). The L1 protein as a new indi-cator of inflammatory activity in patients with juvenile rheumatoid arthritis. Journal of Rheumatology, 18: 133-138.
17. Gwyther M, Schwarz H, Howard A & Ansell BM (1982). C-reactive protein in juvenile chronic arthritis: an indicator of disease activity and possibly amyloidosis.
Annals of the Rheumatic Diseases, 41: 259-262.
18. Hussein A, Stein J & Ehrich JHH (1987). C-reactive protein in the assessment of disease activity in juvenile rheumatoid ar-thritis and juvenile spondyloarar-thritis. Scan-dinavian Journal of Rheumatology, 16: 101-105.
19. Schultz DR & Arnold PI (1990). Properties of four acute phase proteins: C-reactive protein, serum amyloid A protein, alpha1-acid glycoprotein, and fibrinogen. Semi-nars in Arthritis and Rheumatism, 20: 129-147.
20. Giannini EH & Brewer EJ (1987). Poor correlation between the erythrocyte sedi-mentation rate and clinical activity in juve-nile rheumatoid arthritis. Clinical Rheuma-tology, 13: 197-201.