450
ABSTRACT
Introduction: Aerobic fitness is a component of physical fitness related to health and has great importance in the prevention of cardiovascular diseases. Objective: To verify the secular changes in aerobic fitness levels and to identify factors over a decade related to low levels of aerobic fitness in Brazilian children. Methods: This secular change study was carried out from 1999 to 2010 with 11,083 children aged from six to nine years, of both sexes, living in all regions of Brazil. The aerobic fitness was assessed by the 9-minute run test. The independent variables were sex, age, geographic region, area of residence, and nutritional status. The “t” test was used for independent samples and analysis of variance, chi-square test, and Poisson regression were used to estimate prevalence ratio (PR) and confidence intervals of 95% (CI 95%). Results: No significant changes in the distance covered in the 9-minute run test and in the prevalence of low levels of aerobic fitness were observed from 1999 to 2010. The population subgroups most likely to have low aerobic fitness levels were students aged seven years, those in the Midwestern, Southeast, and South of Brazil, those living in rural areas and those with overweight and obesity. Conclusions: Over a decade, low levels of aerobic fitness were present in four fifths of Brazilian children and this picture did not change. Low levels of aerobic fitness affected more children above six years old, living in the economically most favored regions of Brazil, in rural areas and with overweight.
Keywords: physical endurance; physical fitness; exercise; health inequalities.
RESUMO
Introdução: A aptidão aeróbica é um componente da aptidão física relacionado com a saúde e tem grande importância na prevenção de doenças cardiovasculares. Objetivo: Verificar as mudanças seculares nos níveis de aptidão aeróbica e identificar os fatores ao longo de uma década relacionados com os baixos níveis de aptidão ae-róbica em crianças brasileiras. Métodos: Este estudo de mudança secular foi conduzido de 1999 a 2010 com 11.083 crianças de seis a nove anos de idade, de ambos os sexos, residentes em todas as regiões do Brasil. A aptidão aeróbia foi avaliada pelo teste de corrida de nove minutos. As variáveis independentes foram sexo, idade, região geográfica, zona de domicílio e estado nutricional. Empregou-se o teste “t” para amostras independentes, e a análise de variân-cia, o teste qui-quadrado e a regressão de Poisson foram usadas para estimar razão de prevalência (RP) e intervalos de confiança de 95% (IC 95%). Resultados: De 1999 a 2010 não se observaram alterações significativas na distância percorrida no teste de corrida de nove minutos e na prevalência de baixos níveis de aptidão aeróbica. Os subgrupos populacionais com maior probabilidade de ter baixos níveis de aptidão aeróbica foram os estudantes a partir de sete anos de idade, os da região centro-oeste, sudeste e sul do Brasil, os que vivem na zona rural e os com sobrepeso e obesidade. Conclusões: No decorrer de uma década, baixos níveis de aptidão aeróbica estavam presentes em mais de quatro quintos das crianças brasileiras e esse quadro não se modificou. Os baixos níveis de aptidão aeróbica atingiram mais as crianças acima de seis anos, residentes nas regiões brasileiras mais favorecidas economicamente, na zona rural e com sobrepeso.
Descritores: resistência física; aptidão física; exercício; desigualdades em saúde.
RESUMEN
Introducción: La aptitud aeróbica es un componente de la aptitud física relacionado con la salud y tiene gran importancia en la prevención de enfermedades cardiovasculares. Objetivo: Investigar los cambios seculares en la apti-tud aeróbica a lo largo de una década e identificar los factores relacionados con los bajos niveles de aptiapti-tud aeróbica en niños brasileños. Método: Este estudio de cambio secular fue realizado de 1999 a 2010 con 11.083 niños de seis a nueve años de edad, de ambos sexos, residentes en todas las regiones de Brasil. La aptitud aeróbica fue analizada por la prueba de carrera de nueve minutos. Las variables independientes fueron sexo, edad, región geográfica, zona de domicilio y estado nutricional. Se utilizó la prueba “t” para muestras independientes y el análisis de varianza, la prueba del chi-cuadrado y la regresión de Poisson para estimar la razón de prevalencia (RP) e intervalos de confianza del 95% (IC 95%). Resultados: De 1999 a 2010 no se observaron cambios significativos en la distancia recorrida en la prueba de carrera de nueve minutos y en la prevalencia de bajos niveles de aptitud aeróbica. Los subgrupos poblacionales con mayor probabilidad de tener bajos niveles de aptitud aeróbica fueron los estudiantes a partir de siete años de
SECULAR CHANGES IN AEROBIC FITNESS LEVELS
IN BRAZILIAN CHILDREN
MUDANÇAS SECULARES EM NÍVEIS DE APTIDÃO AERÓBICA EM CRIANÇAS BRASILEIRAS
CAMBIOS SECULARES EN NIVELES DE APTITUD AERÓBICA EN NIÑOS BRASILEÑOS
Diego Augusto Santos Silva1
(Physical Education Professional)
Edio Luiz Petroski1
(Physical Education Professional)
Adroaldo Cezar Araujo Gaya2
(Physical Education Professional)
1. Universidade Federal de Santa Catarina Programa de Pós-Graduação em Educação Física, Florianópolis, SC, Brazil. 2. Universidade Federal do Rio Grande do Sul, Porto Alegre, RS, Brazil.
Correspondence:
Universidade Federal de Santa Catarina – Centros de Desportos - Núcleo de Pesquisa em Cineantropometria e Desempenho Humano - Campus Universitário Trindade, Florianópolis, SC, Brazil. 88040-900.
ORIGINAL ARTICLE
ARTIGO ORIGINAL
451
edad, los de la región centro-oeste, sudeste y sur de Brasil, los que viven en la zona rural y aquellos con sobrepeso y obesidad. Conclusión: En el transcurso de una década, bajos niveles de aptitud aeróbica estaban presentes en más de cuatro quintos de los niños brasileños y este cuadro no se modificó. Los bajos niveles de aptitud aeróbica afectaron más a los niños mayores de seis años, residentes en las regiones brasileñas más favorecidas económicamente, en la zona rural y con sobrepeso.
Descriptores: resistencia física; aptitud física; ejercicio; desigualdades en la salud.
Article received on 06/03/2015 accepted on 06/08/2017 DOI: http://dx.doi.org/10.1590/1517-869220172306150424
INTRODUCTION
Among the health problems caused by insufficient aerobic fitness levels, cardiovascular diseases and premature death in adult life stand out1. Thus,
stimulation and improvement of aerobic fitness levels during childhood becomes important, so that such behavior is maintained at advanced ages.
The prevalence of low aerobic fitness levels reaches different rates around the world2-4. In a city in Russia, only 5% of children were
de-tected with low aerobic fitness levels.2 In other countries such as the
United States and Colombia, these values exceeded 50%3,4. The results
of these studies show that aerobic fitness is influenced by several factors, including genetic and biological factors, which are not modifiable5, and
environmental factors, which are modifiable6-8.
The present study has the following objectives: 1) to assess secular changes in aerobic fitness levels over a decade and, 2) to identify factors (demographic and nutritional status) associated to low aerobic fitness levels in children from all Brazilian regions.
METHODS
For this school-based secular change study carried out from 1999 to 2010, data were extracted from the “Esporte Brasil” Project (PROESP-BR) - National Secretariat of High-Performance Sports, Ministry of Sports9.
Population and sample
The study population consisted of students of both sexes from six to nine years of age enrolled in public and private schools from Brazil.
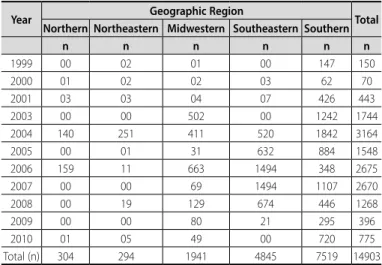
The sample was selected in a non-probabilistic way, so that the PROESP-BR is disclosed in schools of all Brazilian states and Physical Education teachers have the option to participate in the project, assess-ing their students and forwardassess-ing the data to the project coordination. From 1999 to 2010, 14903 children (7931 males and 6972 females) from all Brazilian regions were assessed in years 1999 (n=150, 84 males and 66 females), 2000 (n=70, 29 males and 41 females), 2001 (n=443, and 231 males and 212 females), 2003 (n=1744, 824 males and 920 females), 2004 (n=3164, 1691 males and 1473 females), 2005 (n = 1548, 863 males and 685 females), 2006 (n=2675, 1440 males and 1235 females), 2007 (n=2670, 1367 males and 1303 females); 2008 (n=1268, 774 males and 494 females), 2009 (n=396, 233 males and 163 females), 2010 (n=775, 395 males and 380 females). The distribution of the sample by geographical region in each year of the study is shown in Table 1.
Each child was evaluated only once. In 2002, few children were evaluated by PROESP-BR, and for this reason, data from that year were not included in the study.
Physical Education teachers who participated in the project were trained by members of the Physical Education School, Federal University of Rio Grande do Sul, Porto Alegre, Brazil. The training of PROESP-BR is carried out in a virtual way, in which teachers should read the project manual that teaches how to apply it. Then the procedure of each of the tests is shown by video.
Throughout the fieldwork, students were informed at least one day in advance about the research procedures.
Dependent variable
Aerobic fitness was the dependent variable. It was evaluated by the 9-minute running test of the American Alliance for Health, Physical Educa-tion, Recreation and Dance – AAHPERD10, which was validated for children11
and adolescents12. Students were instructed to run the greatest possible
distance in nine minutes. Walking during the test was allowed, but the goal was to travel the greatest distance possible in a stipulated time. All teachers were instructed to apply the test without an influence from the intense sun and on a flat floor surface. The tests were applied throughout the year, so that between the application in one city and another there was climatic variation, but this situation was not controlled in the study.
The distance was measured in meters, so that it was later dichoto-mized into “high” and “low” aerobic fitness level. For this classification, the cutoffs established in the AAHPERD Manual were used10, which
establishes 50th percentile as the minimum level for adequate
cardiores-piratory function. The AAHPERD10 cutoff points are in yards and for the
present study, they were converted into meters (1 yard = 0.91 meters).
Independent variables
The following variables were considered as independent: sex (male and female), age in years (six, seven, eight and nine); Brazilian geographic region (Northern, Northeastern, Midwestern, Southeastern and Southern) area of residence (urban and rural), and nutritional status. The area of residence was defined for each city according to the criteria established by the Brazilian Institute of Geography and Statistics13. Nutritional status
was verified by body mass index (BMI), which was calculated by the quotient of body weight in kilograms by the squared height in meters. Body mass was determined by means of a digital anthropometric scale graduated from 0 to 150 kg, with resolution of 500 grams and height by means of a portable stadiometer fixed to the wall, graded from 0 to 200 cm, with precision scale of 0.2 cm9. Nutritional status was categorized
into four categories (underweight, normal weight, overweight and obesity), according to BMI values14 .
Table 1. Sample distribution according to geographic region and year of the study.
Year Geographic Region Total
Northern Northeastern Midwestern Southeastern Southern
n n n n n n
1999 00 02 01 00 147 150
2000 01 02 02 03 62 70
2001 03 03 04 07 426 443
2003 00 00 502 00 1242 1744
2004 140 251 411 520 1842 3164
2005 00 01 31 632 884 1548
2006 159 11 663 1494 348 2675
2007 00 00 69 1494 1107 2670
2008 00 19 129 674 446 1268
2009 00 00 80 21 295 396
2010 01 05 49 00 720 775
452
Statistical analysis
Mean values, standard deviation (SD) and absolute and relative fre-quency were used for sample description. Two-way analysis of variance (ANOVA) was used to verify differences between the mean values of the 9-minute test according to assessment year and sex, followed by Bonferroni post hoc test. The chi-square test for comparison of two proportions was used to identify differences in the prevalence of low aerobic fitness levels in each assessment year.
The chi-Square test of heterogeneity and / or linear trend was used to verify differences between the prevalence of low aerobic fitness levels according to each independent variable. The Student “t” test was used to verify differences between the mean values of the 9-minute test according to sex and area of residence. One-way ANOVA was used to verify differences between the mean values of the 9-minute test according to age, geographic region and nutritional status, followed by Bonferroni post hoc test.
To identify factors associated with low aerobic fitness levels, Poisson regression was used, estimating prevalence ratios (PR) with confidence intervals of 95% (CI95%)15. The adjusted analysis followed a model that
determines low aerobic fitness levels hierarchically, hypothetically temporal16. The statistical modeling followed the division into three
blocks of variables; the first, more distal to the outcome, was compo-sed of demographic variables sex and age. The second was formed by demographic variables that may be considered socioeconomic indicators (geographic region and area of residence), which were adjusted to each other and by the variables of the first block. The block more proximal to the outcome was formed by nutritional status, which was adjusted to each other and by variables of the other blocks. All variables were included in the adjusted model, regardless of the
p-value in the crude analysis. To select the method of selection of input variables in the multivariate model, forward and backward methods were tested, which showed similar results; therefore the backward method was selected. Adjustments were made for variables of the same level and levels above that showed p-value ≤ 0.20 in the Wald test in the adjusted analysis, which remained in the model.17 Since
the first level of the adjusted analysis, the variable collection year was included in the multivariate model and remained throughout mode-ling. For all inferential analyses, significance level of 5% was adopted. Additionally, possible interaction and effect modification were tested in the associations of variable sex with other independent variables (age, geographic region, area of residence and nutritional status). All analyses were performed using the Stata software (Stata Corp., College Station, USA) version 11.0.
The study was approved by the Ethics Committee on Human Re-search of the Federal University of Santa Catarina (Process No. 218/08).
RESULTS
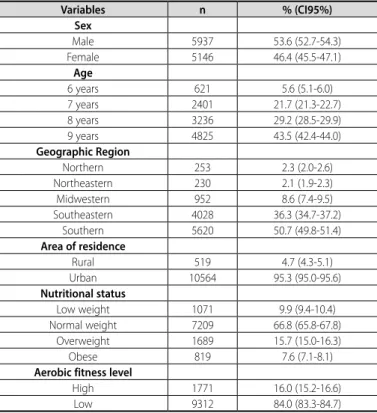
Of the 14,903 children tested from 1999 to 2010 by PROESP-BR, 11,083 performed the 9-minutes test and comprised the study sample. Table 2 shows the distribution and characterization of sample that did the aerobic fitness test.
The distribution of nutritional status was similar in the different geographic regions of Brazil (Table 3) and in the different ages (Table 4).
On average, Brazilian children ran 1230.7 meters in nine minutes (SD = 287.5). Boys ran on average 1284.3 meters (SD = 294.6) in nine minutes over the evaluation years and girls ran the distance of 1167.9 meters (SD = 265.7). In general, in most years, boys ran a longer distance in nine minutes compared to girls (Figure 1). Throughout the decade, a decline of -8.7% was found in the aerobic fitness; in males, this decline was -9.9% and in females, it was -4.4%.
In most evaluation years (Figure 2), the prevalence of low aerobic fitness levels exceeded 80% in both sexes.
The prevalence of low aerobic fitness levels was greater in male students with nine years of age, in those living in Midwestern Brazil, in those living in rural areas, and in obese children. Schoolchildren who ran the greatest distance in the aerobic fitness test were male, older, resident in northern Brazil, in the urban area, those with underweight and normal weight (Table 5).
In the adjusted analysis, subgroups most likely to have low aerobic fitness levels were students from the age of seven, those living in Mid-western, Southeastern and Southern Brazil, those living in rural areas and those with overweight and obesity. Female students of seven, eight and nine years were less likely to have low aerobic fitness levels. Moreover, girls living in Midwestern Brazil were more likely to have low aerobic fitness levels (Table 6).
Table 2. Sample distribution in relation to demographic variables, nutritional status and aerobic fitness.
Variables n % (CI95%)
Sex
Male 5937 53.6 (52.7-54.3)
Female 5146 46.4 (45.5-47.1)
Age
6 years 621 5.6 (5.1-6.0)
7 years 2401 21.7 (21.3-22.7)
8 years 3236 29.2 (28.5-29.9)
9 years 4825 43.5 (42.4-44.0)
Geographic Region
Northern 253 2.3 (2.0-2.6)
Northeastern 230 2.1 (1.9-2.3)
Midwestern 952 8.6 (7.4-9.5)
Southeastern 4028 36.3 (34.7-37.2)
Southern 5620 50.7 (49.8-51.4)
Area of residence
Rural 519 4.7 (4.3-5.1)
Urban 10564 95.3 (95.0-95.6)
Nutritional status
Low weight 1071 9.9 (9.4-10.4)
Normal weight 7209 66.8 (65.8-67.8)
Overweight 1689 15.7 (15.0-16.3)
Obese 819 7.6 (7.1-8.1)
Aerobic fitness level
High 1771 16.0 (15.2-16.6)
Low 9312 84.0 (83.3-84.7)
CI 95%: confidence interval of 95%.
Table 3. Distribution of nutritional status by geographic region.
Geographic region
Nutritional status
Normal weight Low weight Overweight Obese
n (%) n (%) n (%) n (%)
Northern 164 (66.1) 32 (12.9) 37 (14.9) 15 (6.1)
Northeastern 146 (67.0) 23 (10.6) 35 (16.0) 14 (6.4)
Midwestern 624 (66.4) 97 (10.3) 153 (16.3) 66 (7.0)
Southeastern 2593 (66.6) 410 (10.5) 614 (15.8) 277 (7.1)
Southern 3682 (67.1) 509 (9.3) 850 (15.5) 447 (8.1)
p = 0.463 (chi-square test of heterogeneity).
Table 4. Distribution of nutritional status by age.
Age (years) Nutritional status
Normal weight Low weight Overweight Obese
n (%) n (%) n (%) n (%)
6 384 (63.9) 76 (12.6) 81 (13.5) 60 (10.0)
7 1604 (68.9) 217 (9.3) 326 (14.0) 180 (7.8)
8 2091 (66.1) 282 (8.9) 526 (16.6) 264 (8.4)
9 3130 (66.6) 496 (10.6) 756 (16.1) 315 (6.7)
453
DISCUSSION
Tomkinson and Olds7 analyzed secular changes in the aerobic
fit-ness over the past five decades of children and adolescents around the world and reported that there has been a decline of -0.36% per year in the aerobic fitness level of young people. A study that verified secular changes in physical fitness level of Asian children and adolescents with information from the year 1917 found that from the decade of 80, there was a sharp decline in the aerobic fitness level of adolescents from Hong Kong, Japan, Vietnam, Thailand, Korea and Taiwan8. Malina5 analyzed
a series of results of surveys conducted in the United States since the 1930s and reported that the aerobic fitness of North American children increase until 1970 and decline from 1990. This study analyzed data from Brazilian children from the end of the decade of 1990 and found significant changes in aerobic fitness levels over the decade, and in this period, there was a decline of -8.7% in the aerobic strength.
The prevalence of low aerobic fitness levels identified in this study (84.0%) is higher than values reported for American children in California5,
in which approximately 45% of the students had inadequate aerobic fitness levels. The Helena European study found that 31.6% of boys and 42.4% of girls had inadequate aerobic fitness levels18.
The literature emphasizes that physical fitness measures are largely related to body size and biological maturation5. However, research
carried out in Lithuania examined secular changes in aerobic fitness in schoolchildren over a decade (1992-2002) and reported that anthropo-metric variables (body mass, height and BMI) had no significant effect on aerobic fitness changes19. Thus, another factor related to changes in
physical fitness tests are changes in lifestyle, especially the reduction of physical activity levels and increased sedentary behavior, which causes a reduction in aerobic fitness levels and increased overweight and obesity rates20.
Table 5. Prevalence of low aerobic fitness levels and mean values and standard de-viation of the distance ran in the 9-minute test according to demographic variables and nutritional status.
Variables Low aerobic fitness 9-min running test (me-ters)
n % (CI95%)p p Mean (SD) p
Total 9312 84.0 (83.3-84.7) 1230.7 (287.5) Sex
Male 5075 85.5 (84.6-86.3) <0.01 1284.3 (294.6) <0.01
Female 4237 82.3 (81.2-83.3) 1167.9 (265.7)
Age
6 years 413 66.5 (62.7-70.2) <0.01 1156.5 (275.7) <0.01
7 years 2018 84.0 (82.5-85.5) 1169.3 (266.2)
8 years 2748 84.9 (83.6-86.1) 1220.4 (288.7)*†
9 years 4133 85.7 (84.6-86.6) 1276.6 (290.1)*†‡
Geographic Region
Northern 173 68.4 (62.6-74.1) <0.01 1397.5 (318.5)§‖¶** <0.01
Northeastern 186 80.9 (75.7-85.9) 1319.9 (308.3)‖¶**
Midwestern 904 95.0 (93.5-96.3) 1118.2 (246.3)
Southeastern 3311 82.2 (81.0-83.3) 1234.1 (295.5)‖
Southern 4738 84.3 (83.3-85.2) 1235.3 (279.2)‖
Area of residence
Rural 475 91.5 (89.1-93.9) <0.01 1156.2 (263.3) <0.01
Urban 8837 83.7 (82.9-84.3) 1233.9 (288.1)
Nutritional status
Low weight 5939 82.4 (81.5-83.2) <0.01 1254.1 (287.4)†† <0.01
Normal weight 866 80.9 (78.4-83.2) 1259.1 (275.2)††
Overweight 1487 88.0 (86.4-89.5) 1179.5 (282.0)
Obese 777 94.9 (93.3-96.3) 1068.8 (240.9)
*Compared to 6 years; †compared to 7 years; ‡compared to 8 years; §compared to the Northeastern region;
‖compared to the Midwestern region; ¶compared to the Southeastern region; **compared to the Southern region; ††compared to overweight and obesity.
Table 6. Crude and adjusted prevalence ratio between low aerobic fitness levels and demographic variables and nutritional status of Brazilian children.
Variables Crude analysis Adjusted analysis*
PR (CI95%) p PR (CI95%) p
Sex
Male 1.00 <0.01 1.00 0.87
Female 0.98 (0.97-0.99) 1.01 (0.92-1.09)
Age
6 years 1.00 <0.01 1.00 <0.01
7 years 1.10 (1.08-1.13) 1.13 (1.09-1.17)
8 years 1.11 (1.08-1.14) 1.16 (1.12-1.20)
9 years 1.12 (1.09-1.14) 1.17 (1.13-1.20)
Geographic region
Northern 1.00 <0.01 1.00 <0.01
Northeastern 1.07 (1.02-1.12) 1.03 (0.98-1.09)
Midwestern 1.15 (1.11-1.19) 1.12 (1.07-1.17)
Southeastern 1.08 (1.04-1.12) 1.09 (1.04-1.14)
Southern 1.10 (1.05-1.13) 1.08 (1.03-1.12)
Area of residence
Rural 1.00 <0.01 1.00 <0.01
Urban 0.96 (0.94-0.97) 0.97 (0.95-0.98)
Nutritional status
Low weight 1.00 <0.01 1.00 <0.01
Normal weight 0.99 (0.97-1.01) 1.01 (0.98-1.02)
Overweight 1.03 (1.02-1.04) 1.03 (1.01-1.04)
Obese 1.07 (1.05-1.08) 1.07 (1.05-1.08)
Females*7 years 0.95 (0.90-0.99) 0.04
Females*8 years 0.91 (0.87-0.95) <0.01
Females*9 years 0.91 (0.86-0.94) <0.01
Females* Midwestern
region 1.09 (1.02-1.17) 0.02
PR: prevalence ratio, CI 95%: confidence interval of 95%; * analysis adjusted for all independent variables and data collection year. Superscript numbers: 1 - Variables included in the first level; 2 - Variables included in the second level, 3 - Variables included in the third level.
Figure 1. Mean values of the route performed in the 9-minute running test by Brazilian children according to the study year. Two-way ANOVA (F = 35.9, p <0.001), * p <0.05 (comparison between sexes).
Figure 2. Prevalence and confidence intervals of 95% of low aerobic fitness levels in Brazilian children according to the study year. Chi-square test for males (x² = 179.2, p <0.001), Chi-square test for females (x² = 149.9, p <0.001), *p <0.05 (comparison between sexes - comparison test between two proportions).
1600 1400 1200 1000 800 600 400 200 0
1999 2000 2001 2003 2004 2005 2006 2007 2008 2009 2010 Male Female
Year
* * * * * *
*
9-minut
es run t
est (m)
100
90
80
70
60
50
1999 2000 2001 2003 2004 2005 2006 2007 2008 2009 2010
Year
P
rev
alenc
e of lo
w aer
obic itness (%)
454
Boys in this study ran a greater distance in nine minutes compared to girls, which is consistent to results of other studies3,5,21. However,
when analyzing the proportion of students who achieved minimum recommended levels for health, the prevalence of inadequate aerobic fitness levels for health was similar between sexes, which shows that the low aerobic fitness levels of Brazilian children is a widespread problem in both boys and girls.
This study found that children aged seven, eight and nine years were more likely to have low aerobic fitness levels than those aged six years, which is consistent with other studies4,8. A possible explanation for this
finding is the fact that the levels of habitual physical activity among children are also decreasing with increasing age, which may reflect in low aerobic fitness levels22. Children living in Midwestern, Southeastern
and Southern Brazil were more likely to have low aerobic fitness. One of the possible explanations for this finding may be the socioeconomic discrepancies between the geographical regions of Brazil. Brazilian gov-ernment reported that the Northern region of Brazil is the least socially and economically disadvantaged, followed by Northeastern, Midwestern, Southeastern and Southern regions23. The literature reports that
low-income children have less access to sports facilities and places for the practice of physical activities during leisure time, like gymnasiums, parks, and sports clubs; however, they are not less physically active because they have high energy expenditure and are involved in unstructured physical activities such as plays and outdoor activities6.
Regarding the area of residence, this study found that children living in rural areas were more likely to have low aerobic fitness levels than those living in urban areas. The literature is controversial regarding this topic3,24,25. In speculative terms, these differences may be associated
with sociocultural factors, as in urban centers, opportunities and spaces for the practice of physical activities are numerous and suitable when compared to rural areas.
As in other studies4,17,26, overweight and obese Brazilian children
are more likely to have low aerobic fitness levels compared to those of normal weight. Among the hazardous effects caused by excess weight on health, the lower involvement in sports and physical activities by pre-obese and pre-obese children stands out. This lower involvement in sports is often caused by discrimination from their normal-weight peers, which causes withdrawal and isolation social27.
This study presents external and internal validity. The nutritional sta-tus of the children was similar according to the ages and in the different geographical regions, which makes it evident that the nutritional status did not influence the association between age and aerobic fitness and between geographic region and aerobic fitness. This information is impor-tant because it reinforces that low levels of aerobic fitness is a risk factor for health, independent of obesity, as has been reported in other studies28-30.
The sample used in this study is non-probabilistic, which does not guar-antee representativeness by geographic region of Brazil. Moreover, the results are generalized only for students who were attending schools that joined the PROESP-BR project, and should not extend to children who for some reason were not in school or were in schools that have not joined the project.
CONCLUSION
It could be concluded that low aerobic fitness levels in Brazilian children is a problem that will last longer, since the analysis of the last decade showed no signs of change. In general, from 1999 to 2010, more than 80.0% of Brazilian children had low aerobic fitness levels. The factors related to low aerobic fitness levels indicated that children from the age of seven, living in the most economically disadvantaged regions, living in rural areas and with overweight were more likely to have low aerobic strength throughout the decade.
All authors declare no potential conflict of interest related to this article.
REFERENCES
1. Arraiz GA, Wigle DT, Mao Y. Risk assessment of physical activity and physical fitness in the Canada Health Survey mortality follow-up study. J Clin Epidemiol. 1992;45(4):419-28.
2. Hastie P, Sinelnikov O, Wadsworth D. Aerobic fitness status and out-of-school lifestyle of rural children in America and Russia. J Phys Act Health. 2010;7(2):150-5.
3. Powell KE, Roberts AM, Ross JG, Phillips MA, Ujamaa DA, Zhou M. Low physical fitness among fifth- and seventh-grade students, Georgia, 2006. Am J Prev Med. 2009;36(4):304-10.
4. Tovar G, Poveda JG, Pinilla MI, Lobelo F. Relationship between overweight, physical activity and physical fitness in school-aged boys in Bogotá Colombia. Arch Latinoam Nutr. 2008;58(3):265-73.
5. Malina RM. Physical fitness of children and adolescents in the United States: status and secular change. Med Sport Sci. 2007;50:67-90.
6. Dregval L, Petrauskiene A. Associations between physical activity of primary school first-graders during leisure time and family socioeconomic status. Medicina (Kaunas). 2009;45(7):549-56.
7. Tomkinson GR, Olds TS. Secular changes in pediatric aerobic fitness test performance: the global picture. Med Sport Sci. 2007;50:46-66.
8. Macfarlane DJ, Tomkinson GR. Evolution and variability in fitness test performance of Asian children and adolescents. Med Sport Sci. 2007;50:143-67.
9. Gaya A, Silva G. Manual de aplicação de medidas e testes, normas e critérios de avaliação. Porto Alegre: Projeto Esporte Brasil; 2007.
10. American Alliance for Health, Physical Education, Recreation, and Dance. AAHPERD Lifetime Health Related Physical Fitness: Test Manual. Reston, Va: American Alliance for Health, Physical Education, Recreation and Dance; 1980.
11. Turley KR, Wilmore JH, Simons-Morton B, Williston JM, Epping JR, Dahlstrom G. The reliability and validity of the 9-minute run in third-grade children. Pediatr Exerc Sci. 1994;6(2):178-87.
12. Paludo AC, Batista MB, Serassuelo-Júnior H, Cyrino ES, Ronque ERV. Aptidão cardiorrespiratória em adolescentes estimada pelo teste de corrida e/ou caminhada de 9 minutos. Rev Bras Cineantropom Desempenho Hum. 2012;14(4):401-8.
13. Instituto Brasileiro de Geografia e Estatística (IBGE). Cidades. IBGE: Brasil; 2013 [acesso em 2013 abr 8]. Disponível em <http://cidades.ibge.gov.br/xtras/home.php>
14. Cole TJ, Lobstein T. Extended international (IOTF) body mass index cut-offs for thinness, overweight and obesity. Pediatr Obes. 2012;7(4):284-94.
15. Barros AJ, Hirakata VN. Alternatives for logistic regression in cross-sectional studies: an empirical comparison of models that directly estimate the prevalence ratio. BMC Med Res Methodol. 2003;3:21. 16. Victora CG, Huttly SR, Fuchs SC, Olinto MT. The role of conceptual frameworks in epidemiological analysis:
a hierarchical approach. Int J Epidemiol. 1997;26(1):224-7.
17. Maldonado G, Greenland S. Simulation study of confounder-selection strategies. Am J Epidemiol. 1993;138(11):923-36.
18. Martinez-Gomez D, Ruiz JR, Ortega FB, Casajús JA, Veiga OL, Widhalm K, et al. Recommended levels and intensities of physical activity to avoid low-cardiorespiratory fitness in European adolescents: The HELENA study. Am J Hum Biol. 2010;22(6):750-6.
19. Volbekiene V, Griciūte A. Health-related physical fitness among schoolchildren in Lithuania: a comparison from 1992 to 2002. Scand J Public Health. 2007;35(3):235-42.
20. Photiou A, Anning JH, Mészáros J, Vajda I, Mészáros Z, Sziva A, et al. Lifestyle, body composition, and physical fitness changes in Hungarian school boys (1975-2005). Res Q Exerc Sport. 2008;79(2):166-73. 21. Luguetti CN, Ré AHN, Böhme MTS. Indicadores de aptidão física de escolares da região centro-oeste da
cidade de São Paulo. Rev. bras. cineantropom. desempenho hum. 2010;12(5):331-7.
22. Pahkala K, Hernelahti M, Heinonen OJ, Raittinen P, Hakanen M, Lagström H, et al. Body mass index, fitness and physical activity from childhood through adolescence. Br J Sports Med. 2013;47(2):71-7. 23. Brasil. Ministério do Desenvolvimento Social e Combate à Fome. Índice de Desenvolvimento da Família.
Brasília: Ministério do Desenvolvimento Social e Combate à Fome. 2009 [acesso em 2012 out 15]. Disponível em: <http://www.mds.gov.br/noticias/indice-de-desenvolvimento-da-familia-idf-aponta--o-nivel-de-vida-da-populacao-mais-pobre-e-permite-priorizar-politicas-sociais>
24. Chillón P, Ortega FB, Ferrando JA, Casajus JA. Physical fitness in rural and urban children and adolescents from Spain. J Sci Med Sport. 2011;14(5):417-23.
25. McMurray RG, Harrell JS, Bangdiwala SI, Deng S. Cardiovascular disease risk factors and obesity of rural and urban elementary school children. J Rural Health. 1999;15(4):365-74.
26. Westerstahl M, Barnekow-Bergkvist M, Hedberg G, Jansson E. Secular trends in body dimensions and physi-cal fitness among adolescents in Sweden from 1974 to 1995. Scand J Med Sci Sports. 2003;13(2):128-37. 27. Beets MW, Banda JA, Erwin HE, Beighle A. A pictorial view of the physical activity socialization of young
adolescents outside of school. Res Q Exerc Sport. 2011;82(4):769-78.
28. Silva DAS, Tremblay MS, Pelegrini A, Silva JMFL, Petroski EL. Low aerobic fitness in Brazilian adolescents. Rev Bras Med Esporte. 2015;21(2):94-8.
29. Silva DA, Tremblay M, Pelegrini A, Dos Santos Silva RJ, Cabral de Oliveira AC, Petroski EL. Association Between Aerobic Fitness And High Blood Pressure in Adolescents in Brazil: Evidence for Criterion-Referenced Cut-Points. Pediatr Exerc Sci. 2016;28(2):312-20.
30. Silva DAS, Monteiro-Teixeira D, Oliveira G, Petroski EL, Farias JM. Aerobic fitness in adolescents in southern Brazil: association with sociodemographic aspects, lifestyle and nutritional status. Rev Andal Med Deporte. 2016;9(1):17-22.