Radiological determination of cranial size and index
by measurement of skull diameters in a population
of children in Brazil*
Determinação radiológica do índice e do tamanho craniano por mensuração dos diâmetros cranianos em uma população infantil brasileira
Inês Minniti Rodrigues Pereira1, Antônio de Azevedo Barros Filho2, Beatriz Regina Alvares1, Evanisi Teresa Palomari3, Lívio Nanni4
OBJECTIVE: To measure radiologically obtained skull diameters and, based on these data, calculating the cranial index and size to compare with diameter measurements and indices reported in the literature, particularly those reported by Haas. MATERIALS AND METHODS: The present study evaluated 732 individuals with no cranial disease, whose skull diameters were measured, Subsequently, the authors calculated the cranial index and size which demonstrate the different phases of the skull growth by inner-table to inner-table measurements. RESULTS: The comparative study of diameters averages by inner-table measurements has demonstrated a clearly progressive skull growth in the first year of life for both genders, and a slower growth as from the second year. Overall diameters averages did not present any significant difference between male and female individuals. CONCLUSION: Cranial index and size are good skull growth indicators, especially in the first four years of life, a period characterized by an accelerated growth in the first year and a moderate growth until the fourth year. After this age, a slight and stable growth occurs with a decrease in the statistical value. No statistically significant difference was found for both genders. It is recommended that mean diameters are utilized for both genders; and it is suggested that the cranial index is utilized until four years of age, and the cranial size after the age of four, as the ideal parameter for following up the skull growth.
Keywords: Cranial diameters; Cranial size; Cranial index; Childhood; Radiography.
OBJETIVO: Realizar as medidas dos diâmetros cranianos obtidos por método radiológico e elaborar, por meio delas, o índice e o tamanho craniano, para comparar com as medidas dos diâmetros e os índices propostos por alguns trabalhos da literatura, principalmente os do estudo de Haas. MATERIAIS E MÉTODOS: Foram avaliados 732 pacientes sem doenças cranianas, medidos seus diâmetros cranianos e, posteriormente, for-mulados o índice e o tamanho craniano, que mostram as diferentes fases do crescimento do crânio, pelas medidas de tábua interna a tábua interna. RESULTADOS: O estudo comparativo das médias dos diâmetros, por medidas de tábuas internas, mostrou aumento do crescimento francamente progressivo no primeiro ano de vida para ambos os sexos e aumento menor a partir do segundo ano de vida. As médias globais dos diâmetros não apresentaram diferença significativa entre os sexos feminino e masculino. CONCLUSÃO: O índice e o tamanho craniano são bons indicadores do crescimento craniano, principalmente nos quatro pri-meiros anos de vida, quando o crescimento aumenta vertiginosamente no primeiro ano e, posteriormente, ocorre aumento moderado até os quatro anos de idade. Após esta idade, ocorre um leve e estável aumento e seu valor estatístico diminui. Não houve diferença estatisticamente significante, no crescimento, para ambos os sexos. Recomenda-se o uso dos valores médios dos diâmetros para ambos os sexos e sugere-se o uso do índice craniano, até os quatro anos de idade, e o tamanho craniano, após os quatro anos, sendo ideal para o acompanhamento do crescimento do crânio.
Unitermos: Diâmetros cranianos; Tamanho craniano; Índice craniano; Infância; Radiografia.
Abstract
Resumo
* Study developed in the Department of Radiology at Facul-dade de Ciências Médicas da UniversiFacul-dade Estadual de Campi-nas (FCM-Unicamp), CampiCampi-nas, SP, Brazil.
1. PhDs, Assistant Professors, Department of Radiology at Faculdade de Ciências Médicas da Universidade Estadual de Campinas (FCM-Unicamp), Campinas, SP, Brazil.
2. Private Docent, Professor, Department of Pediatrics at Fa-culdade de Ciências Médicas da Universidade Estadual de Cam-pinas (FCM-Unicamp), CamCam-pinas, SP, Brazil.
3. PhD, Assistant Professor, Department of Anatomy at
Insti-Pereira IMR, Barros Filho AA, Alvares BR, Palomari ET, Nanni L. Radiological determination of cranial size and index by measurement of skull diameters in a population of children in Brazil. Radiol Bras. 2008;41(4):229–234.
tuto de Biologia da Universidade Estadual de Campinas (IB-Uni-camp), Campinas, SP, Brazil.
4. Private Docent, Professor, Department of Radiology at Fa-culdade de Ciências Médicas da Universidade Estadual de Cam-pinas (FCM-Unicamp), CamCam-pinas, SP, Brazil.
Mailing address: Dra. Inês Minniti Rodrigues Pereira. Rua Luiz de Paula, 70, casa 11. Campinas, SP, Brazil, 13104-006. E-mail: [email protected]
Received October 4, 2007. Accepted after revision Decem-ber 4, 2007.
INTRODUCTION
to establish development and growth alter-ations, especially in the first years of life. Studies developed by MacKinnon et al.(1), Taveras & Wood(2), Gordon(3),
Cron-qvist(4), Austin & Gooding(5), Gooding(6),
and Haas(7) have described radiographic
in-dices for cranial and brain sizes based on skull diameters, and correlated with age range and sex. The present study was based on the study developed by Haas, consider-ing its highest relevance. However, it is important to note that the mentioned stud-ies have evaluated a non-Brazilian popula-tion, in countries with low ethnic diversity, with higher socioeconomic development, and without an appropriate statistical analysis. Some of these studies lack data about the casuistic, sampling process, and evaluation of variability.
The radiological evaluation of the cra-nial size should be based on the skull di-ameter, considering that malnutrition, ge-netic diseases, endocrine disorders and encephalic diseases are responsible for a series of systemic changes, some of them causing retardation, and others, an abnor-mal skull development(2,8,9).
The cranial volume presents a four-fold increase between the birth and the adult-hood, while the volume of the craniofacial region increases about 12 times(6,10).
Addi-tionally, 80% of the postnatal skull growths occur along the first three years of life(11–14).
When the cranial index approaches the normality threshold, even in the setting of
clinical neurological alterations, a plain radiological investigation may fail to detect abnormalities in the encephalic paren-chyma, especially in cases where the clo-sure of sutures and fontanelles is com-pleted. For this reason, other diagnostic methods, such as computed tomography, should be utilized for evaluating the brain. According to Moss & Young(15),
Dorst(16) and Momose(17), the child’s skull
is a dynamic structure as a function of two factors affecting the skull development: the skull contents and the sutures which un-dergo progressive accommodation. Abnor-mal brain growth or early fusion of sutures results in alterations in the cranial size, af-fecting the encephalic parenchyma.
Radiography can be extremely useful in the assessment of the skull development, but it should be avoided for involving ion-izing radiation; therefore a longitudinal ra-diographic study of the normal cranial growth cannot be performed.
The present study was aimed at measur-ing skull diameters obtained by radiologi-cal methods, and radiologi-calculating the cranial index and cranial size in Brazilian children with indication for radiological investiga-tion because of cranial trauma, with no sign of fracture.
MATERIALS AND METHODS
The present study evaluated a total of 1464 radiographs of 732 patients (428 male
and 304 female) ranging in age from neo-nates to 18 years, with previous indication for cranial radiography for cranial trauma-tism. All the patients answered to an inclu-sion questionnaire about neuropsycho-motor development and previous history of diseases, and so inclusion criteria were es-tablished. None of the patients presented any physical or cranial disease. The con-ventional methodology was adopted for ac-quisition of posteroanterior, anteroposte-rior and lateral views, with a 1 m source-film distance. After images acquisition, skull diameters were measured.
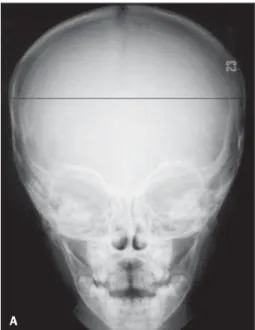
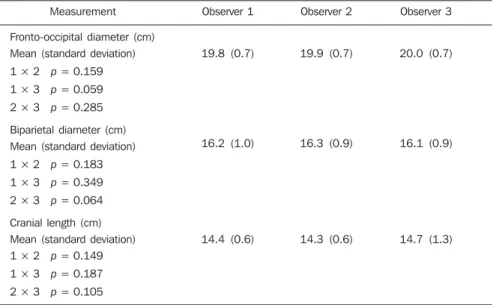
The fronto-occipital diameter (FO) is the measurement of the major distance be-tween the extreme points of the frontal and occipital lobes, and skull length (L) is the major measurement perpendicular to the skull base line, i.e., the line parallel to the sphenoid sinus floor to the posterior mar-gin of the magnum foramen, for measure-ments from inner table to inner table (Fig-ure 1A). The biparietal diameter (BP) is the major measurement between parietals, from inner table to inner table (Figure 1B). Measurements of skull diameters were evaluated by three radiologists and statis-tical analysis involved paired comparisons of mean diameters. No significant variation was found in relation to the method utilized (p > 0.05) (Table 1).
After the measurement of skull diam-eters of the 732 patients, Tables were pre-pared with mean values and standard
de-Figure 1.A: Frontal view – radiographic measurement of the biparietal diameter.
B: Lateral view – radio-graphic measurements of cranial fronto-occipital di-ameter and cranial length.
viation for fronto-occipital and biparietal diameters, and cranial length, according to age range and sex.
A comparative analysis of the variables for each age range and according to sex was performed utilizing the Student’s t-test for independent samples both for measure-ments from inner-table to inner table and from outer table to outer table.
After the data analysis, the authors opted for the measurements from inner table to inner table for demonstrating a closer proximity between the skull and brain growths.
Cranial index and size calculation was based on equations proposed by Haas, where the cranial index corresponded to the division of the width by the length trans-formed into percentages, and the cranial size, to the average of the three diameters, as follows:
Cranial index = (BP / FO) × 100 Cranial size = (FO + BP + L) / 3
RESULTS
The comparative study of mean skull di-ameters in both sexes and according to ages, based on inner measurements is dem-onstrated on Tables 2, 3 and 4, where a more accelerated development in the first year, and a slower development as from the second year of life can be observed in both male and female children. It can be ob-served that the increase in the fronto-oc-cipital diameter is lower in female than in male children, but mean values remain pro-portional for both sexes in the first year as well in the subsequent years of life, with no statistical significance.
No significant difference is found in overall mean diameters between male and female individuals in the paired mean di-ameters comparison by the Student’s t-test. After the measurement of skull diam-eters, cranial index and size were calculated and included respectively on Tables 5 and 6, based on the cranial module and cepha-lic index proposed by Haas(7), by
measure-ments from inner-table to inner-table. Based on the values found in the present study, the authors observed a marked de-crease in the mean value for cranial index in the first year of life, and a milder decrease in the age range between four and five years,
Table 1 Comparison of paired means calculated by three observers, and respective variability (stand-ard deviation).
Measurement
Fronto-occipital diameter (cm)
Mean (standard deviation)
1 × 2 p = 0.159
1 × 3 p = 0.059
2 × 3 p = 0.285
Biparietal diameter (cm)
Mean (standard deviation)
1 × 2 p = 0.183
1 × 3 p = 0.349
2 × 3 p = 0.064
Cranial length (cm)
Mean (standard deviation) 1 × 2 p = 0.149
1 × 3 p = 0.187
2 × 3 p = 0.105
Observer 1
19.8 (0.7)
16.2 (1.0)
14.4 (0.6)
Observer 2
19.9 (0.7)
16.3 (0.9)
14.3 (0.6)
Observer 3
20.0 (0.7)
16.1 (0.9)
14.7 (1.3)
Table 2 Cranial fronto-occipital diameter (cm), according to age and sex (inner table).
Age
< 3 months
3–6 months
6–9 months
9–12 months
12–18 months
18–24 months
24–30 months
30–36 months
36–42 months
42–48 months
4–5 years
5–6 years
6–7 years
7–8 years
8–9 years
9–10 years
10–11 years
11–12 years
12–13 years
13–14 years
14–15 years
15–16 years
16–17 years
17–18 years
18–19 years
Total
Mean
13.9
14.9
16.2
16.6
17.5
17.4
18.0
18.4
18.5
18.7
18.7
19.5
19.5
19.3
19.5
19.5
19.5
19.0
19.4
19.4
20.2
20.1
20.0
19.9
20.1
Standard deviation
1.2
0.6
0.6
0.5
0.6
0.6
1.0
0.7
0.8
0.8
0.6
0.8
0.8
0.8
0.9
0.8
0.8
0.7
0.7
0.9
0.7
0.8
1.0
0.9
0.9
n
12
18
14
18
13
15
19
7
19
9
37
28
21
29
22
19
24
14
14
11
16
14
11
14
10
428
Mean
13.2
14.8
16.0
16.6
17.3
17.3
17.7
18.1
18.2
18.2
18.5
18.7
18.6
19.2
19.3
19.0
19.3
19.3
19.5
18.7
19.2
19.4
19.2
19.6
19.5
Standard deviation
1.1
0.8
0.7
1.2
1.2
0.5
0.9
0.6
0.7
0.7
0.8
0.8
0.4
0.8
0.7
1.0
0.7
0.8
0.7
0.7
0.7
0.9
0.7
1.4
1.0
n
13
16
21
13
10
8
15
9
16
12
18
21*
5†
19
18
18
7
11
9
11†
6†
8
7
6
7
304
Male Female
Student’s t test for comparison of mean values.
Table 3 Cranial biparietal diameter (cm), according age and sex (inner table).
Age
< 3 months 3–6 months 6–9 months 9–12 months 12–18 months 18–24 months 24–30 months 30–36 months 36–42 months 42–48 months 4–5 years 5–6 years 6–7 years 7–8 years 8–9 years 9–10 years 10–11 years 11–12 years 12–13 years 13–14 years 14–15 years 15–16 years 16–17 years 17–18 years 18–19 years Total Mean 11.9 12.8 13.4 13.3 14.4 13.9 14.4 14.7 15.0 15.1 15.0 15.6 15.8 15.8 16.1 16.3 16.0 16.0 15.8 16.1 16.7 16.4 16.5 16.3 16.4 Standard deviation 1.4 0.8 0.4 0.7 0.5 0.5 0.7 0.7 0.7 0.9 0.6 0.5 0.7 0.7 0.5 0.6 0.7 0.9 0.4 0.6 0.5 0.8 0.9 0.7 0.5 n 12 18 14 18 13 15 19 7 19 9 37 28 21 29 22 19 24 14 14 11 16 14 11 14 10 428 Mean 11.4 12.7 13.4 13.5 13.6 14.0 14.1 14.2 14.6 14.8 15.1 15.2 15.7 15.5 15.7 15.5 15.5 15.9 15.9 15.4 16.1 16.1 16.1 16.0 16.1 Standard deviation 1.4 0.9 0.7 0.7 0.7 0.6 0.8 0.6 0.7 0.5 0.6 0.5 0.5 0.8 0.6 0.5 0.6 0.9 0.6 0.8 0.7 0.7 0.8 1.2 0.4 n 13 16 21 13 10* 8 15 9 16 12 18 21* 5 19 18* 18† 7 11 9 11* 6* 8 7 6 7 304 Male Female
Student’s t test for comparison of mean values. n, No. of patients; *p < 0.05; †p < 0.001.
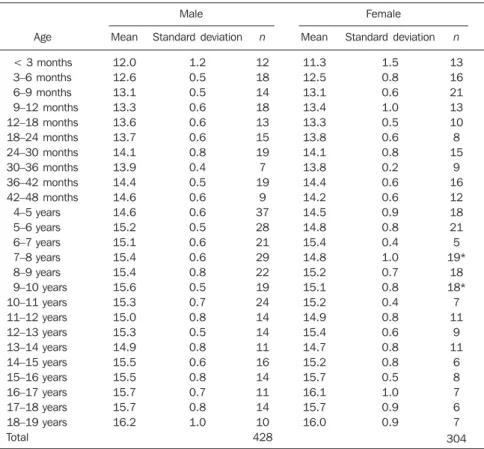
Table 4 Cranial length (cm), according age and sex (inner table).
Age
< 3 months 3–6 months 6–9 months 9–12 months 12–18 months 18–24 months 24–30 months 30–36 months 36–42 months 42–48 months 4–5 years 5–6 years 6–7 years 7–8 years 8–9 years 9–10 years 10–11 years 11–12 years 12–13 years 13–14 years 14–15 years 15–16 years 16–17 years 17–18 years 18–19 years Total Mean 12.0 12.6 13.1 13.3 13.6 13.7 14.1 13.9 14.4 14.6 14.6 15.2 15.1 15.4 15.4 15.6 15.3 15.0 15.3 14.9 15.5 15.5 15.7 15.7 16.2 Standard deviation 1.2 0.5 0.5 0.6 0.6 0.6 0.8 0.4 0.5 0.6 0.6 0.5 0.6 0.6 0.8 0.5 0.7 0.8 0.5 0.8 0.6 0.8 0.7 0.8 1.0 n 12 18 14 18 13 15 19 7 19 9 37 28 21 29 22 19 24 14 14 11 16 14 11 14 10 428 Mean 11.3 12.5 13.1 13.4 13.3 13.8 14.1 13.8 14.4 14.2 14.5 14.8 15.4 14.8 15.2 15.1 15.2 14.9 15.4 14.7 15.2 15.7 16.1 15.7 16.0 Standard deviation 1.5 0.8 0.6 1.0 0.5 0.6 0.8 0.2 0.6 0.6 0.9 0.8 0.4 1.0 0.7 0.8 0.4 0.8 0.6 0.8 0.8 0.5 1.0 0.9 0.9 n 13 16 21 13 10 8 15 9 16 12 18 21 5 19* 18 18* 7 11 9 11 6 8 7 6 7 304 Male Female
Student’s t test for comparison of mean values. n, No. of patients; *p < 0.05.
and stabilizing thereafter, as shown on Table 5 as compared with Table 7 in the study developed by Haas(7). This is explained by
the fact that, after the first year of life, the cranial index is not connected with the age, partially because the fronto-occipital diam-eter increases more rapidly than the other diameters, as shown on Table 2.
On the other hand, the cranial size or cranial module of Haas(7) corresponds to
the average of the sum of the three diam-eters measured from table to inner-table, and increases as the diameters. In the first year of life, mean values present a higher increase, and later, a lower increase up to the age of four, stabilizing thereafter up to the age of 18, as shown on Table 6 as compared with Table 8.
DISCUSSION
Amongst the studies considered for comparison with the results of the present study, the one developed by Haas(7),
evalu-ating the cephalic index and cranial mod-ule, has presented the most satisfactory results in the comparative data analysis.
Based on the measurements of skull di-ameters performed in the present study, the authors could observe that some cranial indices are good indicators of the skull growth and can be utilized in the follow-up of the cranial development.
Computed tomography is undoubtedly an excellent method for encephalic evalu-ation, but is ineffective in the follow-up of the skull development, considering the impossibility of determining the same po-sitions and sizes of all structures involved for measurement of cranial diameters(9,12).
Regarding the history of the skull growth, Haas(7) has studied 1427 European
de-termined in the present study refer to a sample including 62 patients in their first year of life, justifying a larger sample size, indicating more reliable measurements and statistical evaluations.
The skull growth is quite accelerated in the first year of life, as demonstrated by the increase in cranial diameters on the tables included in the present study. Changes in the cranial diameters slow down after the first three years of life, and are associated with a 25% increase in the encephalic weight, according to MacKinnon et al.(1).
The comparison between cranial indices calculated in the present study and the one developed by Hass(7) demonstrated
practi-cally the same result, with no statistical sig-nificant difference. However, our study presented a larger casuistic, a better ethnic diversity, and better statistical analysis.
These indices are not useful in the evaluation of a possible encephalic in-volvement, but rather to follow-up the cra-nial development.
CONCLUSION
The cranial index evaluated in the present study is a good indicator of the skull growth, especially in the first four years of life, when the skull grows more rapidly. After this age, considering the de-crease and stabilization in the growth ve-locity and the decreased statistical value, the cranial size or tables with skull diam-eters become better indicators for follow-ing-up the skull development both in fe-male and fe-male individuals.
REFERENCES
1. MacKinnon IL, Kennedy JA, Davis TV. The es-timation of the skull capacity from roentgenologic measurements. Am J Roentgenol Radium Ther Nucl Med. 1956;76:303–10.
2. Taveras JM, Wood EH. Cráneo. In: Taveras JM, Wood EH, editores. Diagnóstico neuroradioló-gico. Buenos Aires: Editora Panamericana; 1968. p. 146–7.
3. Gordon IRS. Measurement of cranial capacity in children. Br J Radiol. 1966;39:377–81. 4. Cronqvist S. Roentgenologic evaluation of cranial
size in children. Acta Radiol Diagn (Stockh). 1968;7:97–111.
5. Austin JH, Gooding CA. Roentgenographic mea-surement of skull size in children. Radiology. 1971;99:641–6.
6. Gooding CA. Skull vault: size and shape. In: New-ton TH, Potts DG, editors. Radiology of the skull and brain. St. Louis: CV Mosby; 1971. p. 61–93.
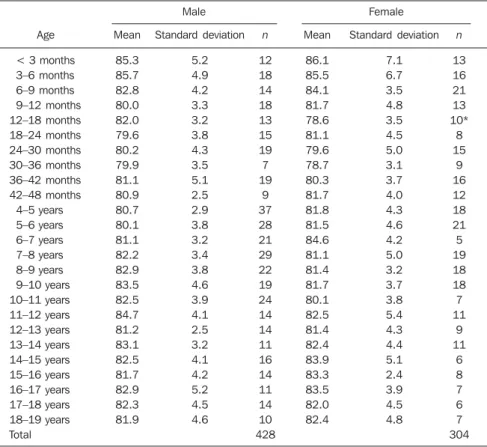
Table 5 Cranial index (%) in the present study, according to age and sex (inner table).
Age
< 3 months 3–6 months 6–9 months 9–12 months 12–18 months 18–24 months 24–30 months 30–36 months 36–42 months 42–48 months 4–5 years 5–6 years 6–7 years 7–8 years 8–9 years 9–10 years 10–11 years 11–12 years 12–13 years 13–14 years 14–15 years 15–16 years 16–17 years 17–18 years 18–19 years Total Mean 85.3 85.7 82.8 80.0 82.0 79.6 80.2 79.9 81.1 80.9 80.7 80.1 81.1 82.2 82.9 83.5 82.5 84.7 81.2 83.1 82.5 81.7 82.9 82.3 81.9 Standard deviation 5.2 4.9 4.2 3.3 3.2 3.8 4.3 3.5 5.1 2.5 2.9 3.8 3.2 3.4 3.8 4.6 3.9 4.1 2.5 3.2 4.1 4.2 5.2 4.5 4.6 n 12 18 14 18 13 15 19 7 19 9 37 28 21 29 22 19 24 14 14 11 16 14 11 14 10 428 Mean 86.1 85.5 84.1 81.7 78.6 81.1 79.6 78.7 80.3 81.7 81.8 81.5 84.6 81.1 81.4 81.7 80.1 82.5 81.4 82.4 83.9 83.3 83.5 82.0 82.4 Standard deviation 7.1 6.7 3.5 4.8 3.5 4.5 5.0 3.1 3.7 4.0 4.3 4.6 4.2 5.0 3.2 3.7 3.8 5.4 4.3 4.4 5.1 2.4 3.9 4.5 4.8 n 13 16 21 13 10* 8 15 9 16 12 18 21 5 19 18 18 7 11 9 11 6 8 7 6 7 304 Male Female
Student’s t test for comparison of mean values. n, No. of patients; *p < 0.05.
Table 6 Cranial size (cm) in the present study, according to age and sex (inner table).
Age
< 3 months 3–6 months 6–9 months 9–12 months 12–18 months 18–24 months 24–30 months 30–36 months 36–42 months 42–48 months 4–5 years 5–6 years 6–7 years 7–8 years 8–9 years 9–10 years 10–11 years 11–12 years 12–13 years 13–14 years 14–15 years 15–16 years 16–17 years 17–18 years 18–19 years Total Mean 12.6 13.4 14.3 14.4 15.1 15.0 15.5 15.7 16.0 16.1 16.1 16.7 16.8 16.8 17.0 17.1 16.9 16.7 16.8 16.8 17.5 17.3 17.4 17.3 17.6 Standard deviation 1.2 0.5 0.4 0.5 0.4 0.4 0.7 0.5 0.4 0.7 0.5 0.4 0.6 0.5 0.6 0.4 0.6 0.5 0.4 0.6 0.3 0.6 0.6 0.6 0.6 n 12 18 14 18 13 15 19 7 19 9 37 28 21 29 22 19 24 14 14 11 16 14 11 14 10 428 Mean 12.0 13.3 14.1 14.5 14.7 15.0 15.3 15.4 15.8 15.7 16.0 16.2 16.6 16.5 16.7 16.5 16.7 16.7 16.9 16.2 16.8 17.1 17.1 17.1 17.2 Standard deviation 1.3 0.6 0.6 0.9 0.7 0.4 0.7 0.4 0.5 0.5 0.5 0.5 0.1 0.7 0.5 0.6 0.3 0.6 0.4 0.5 0.5 0.6 0.7 1.0 0.5 n 13 16 21 13 10 8 15 9 16 12 18 21* 5 19 18 18* 7 11 9 11† 6* 8 7 6 7 304 Male Female
7. Haas LL. Roentgenological skull measurements and their diagnostic applications. Am J Roentgenol Radium Ther Nucl Med. 1952;67:197–209.
8. Meredith HV. Growth in head width during the first twelve years of life. Pediatrics. 1953;12:411– 29.
9. Swischuk LE. Radiologia do recém-nascido do lactente e da criança pequena. Rio de Janeiro: Guanabara Koogan; 2006.
10. Moss ML, Greenberg SN. Postnatal growth of the human skull base. Angle Orthodontist. 1955;25: 77–84.
11. Shapiro R, Janzen AH. The normal skull. A roent-gen study. New York: Paul B. Hoeber; 1960. 12. Sullivan PG. A method for the study of jaw growth
using a computer-based three-dimensional re-cording technique. J Anat. 1972;112(Pt 3):457– 70.
13. Watson EH, Lowrey GH. Growth and develop-ment of children. Chicago; Year Book Medical Publisher; 1967.
14. Tanner JM. Some notes on the reporting of growth data. Hum Biol. 1951;23:93–159.
15. Moss ML. Vertical growth of the human face. Am J Orthodontics. 1964;50:359–76.
16. Dorst JP. Functional craniology: an aid in inter-preting roentgenograms of the skull. Radiol Clin North Am. 1964;2:347–66.
17. Momose KJ. Developmental approach in the analysis of roentgenograms of the pediatric skull. Radiol Clin North Am. 1971;9:99–116.
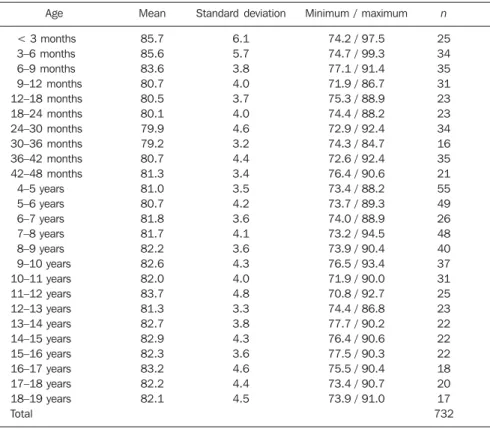
Table 8 Cephalic index according to Haas (inner table to inner table).
Age
< 3 months 3–6 months 6–9 months 9–12 months 12–18 months 18–24 months 24–30 months 30–36 months 36–42 months 42–48 months
4–5 years 5–6 years 6–7 years 7–8 years 8–9 years 9–10 years 10–11 years 11–12 years 12–13 years 13–14 years 14–15 years 15–16 years 16–17 years 17–18 years 18–19 years Total
Mean
85.7 85.6 83.6 80.7 80.5 80.1 79.9 79.2 80.7 81.3 81.0 80.7 81.8 81.7 82.2 82.6 82.0 83.7 81.3 82.7 82.9 82.3 83.2 82.2 82.1
Standard deviation
6.1 5.7 3.8 4.0 3.7 4.0 4.6 3.2 4.4 3.4 3.5 4.2 3.6 4.1 3.6 4.3 4.0 4.8 3.3 3.8 4.3 3.6 4.6 4.4 4.5
Minimum / maximum
74.2 / 97.5 74.7 / 99.3 77.1 / 91.4 71.9 / 86.7 75.3 / 88.9 74.4 / 88.2 72.9 / 92.4 74.3 / 84.7 72.6 / 92.4 76.4 / 90.6 73.4 / 88.2 73.7 / 89.3 74.0 / 88.9 73.2 / 94.5 73.9 / 90.4 76.5 / 93.4 71.9 / 90.0 70.8 / 92.7 74.4 / 86.8 77.7 / 90.2 76.4 / 90.6 77.5 / 90.3 75.5 / 90.4 73.4 / 90.7 73.9 / 91.0
n
25 34 35 31 23 23 34 16 35 21 55 49 26 48 40 37 31 25 23 22 22 22 18 20 17 732
n, No. of patients.
Table 7 Cephalic module developed by Haas (inner table to inner table).
Male Female Total
Age
–4 weeks 2–6 months 7–12 months 13–18 months 19–30 months
3–5 years 6–8 years 9–11 years 12–14 years 15–17 years 18–20 years
Total
n
4 8 11
9 23 33 29 30 30 32 30 360
597
Vmax
12.3 14.6 15.3 16.1 16.8 17.4 17.7 18.1 18.5 18.8 19.2 19.5
M
12.0 12.9 14.9 15.3 15.9 16.3 16.8 16.9 17.4 17.6 17.7 17.8
n
3 7 12 17 12 26 27 23 23 18 22 355
545
Vmin
10.8 12.1 12.9 13.5 13.6 14.2 14.3 15.2 16.0 15.9 16.3 15.7 Vmin
11.6 11.9 13.0 14.3 14.5 14.8 15.5 15.7 16.4 16.6 16.3 16.3
Vmax
12.8 14.1 15.0 16.0 16.6 17.4 17.5 17.6 17.6 17.7 17.8 18.5
M
11.6 12.7 13.8 14.8 15.1 16.0 16.3 16.5 16.7 16.9 17.1 17.1
n
5 15 23 26 35 59 56 53 53 50 52 715
1.142 Vmin
10.8 11.9 12.9 13.5 13.6 14.2 14.3 15.2 16.0 15.9 16.3 15.7
Vmax
12.3 14.6 15.3 16.1 16.8 17.4 17.7 18.1 18.5 18.8 19.2 19.5
M
11.8 12.8 14.2 15.0 15.7 16.2 16.6 16.7 17.1 17.3 17.5 17.5
s = –0.52+0.51
M ± s = 17.3–18.4 = 72.1% M ± 2s = 16.8–18.9 = 94.2%
s = –0.54 + 0.39
M ± s = 16.4–17.6 = 70.2% M ± 2s = 16.0–18.1 = 95.7%