Brazilian normative data for the
Short Form 36 questionnaire,
version 2
Dados normativos brasileiros do
questionário Short Form-36 versão 2
Josué LaguardiaI
Mônica Rodrigues CamposII
Claudia TravassosI
Alberto Lopes NajarII
Luiz Antonio dos AnjosIII
Miguel Murat Vasconcellos (in memoriam)
IInstitute of Communication and Scientiic and Technological Information in
Health, Fundação Oswaldo Cruz – Rio de Janeiro (RJ), Brazil.
IIDepartment of Social Sciences, National School of Public Health, Fundação Oswaldo Cruz – Rio de Janeiro (RJ), Brazil.
IIICenter of Medical Sciences, Departament of Social Nutrition, Universidade Federal Fluminense – Rio de Janeiro (RJ), Brazil.
Corresponding author: Josué Laguardia, Instituto de Comunicação e Informação Cientíica e Tecnológica em Saúde, Avenida Brasil, 4.365, Pavilhão Haity Moussatché, Manguinhos, CEP: 21045-360, Rio de Janeiro, RJ, Brasil. E-mail: [email protected]
Financial support: National Council for Scientiic and Technological Development – CNPq / Project Institutos do Milênio – 001/2005.
Abstract
he 36-item Short Form (SF-36) survey is a widely used measure of health-related qual-ity of life. Normative data are the key to deter-mining whether a group or an individual scores above or below the average for their country, age or gender. Despite being used in many Brazilian studies, published norms with national comprehensiveness for the SF-36 have not been previously published.
Methods: The study Pesquisa Dimensões Sociais das Desigualdades (PDSD) (Social Dimensions of Inequalities) involves 12,423 randomly selected Brazilian men and women aged 18 years old or more from urban and rural areas of the ive Brazilian regions, and the information collected included the SF-36 as a measure of health-related quality of life. his provided a unique opportunity to develop age and gender-adjusted normative data for the Brazilian population. Results: Brazilian men scored substantially higher than women on all eight domains and the two summary component scales of the SF-36. Brazilians scored less than their international counter-parts on almost all of SF-36 domains and both summary component scales, except on gen-eral health status (US), pain (UK) and vital-ity (Australia, US and Canada). Conclusion:
he diferences in the SF-36 scores between age groups, genders and countries conirm that these Brazilian norms are necessary for comparative purposes. he data will be useful for assessing the health status of the general population and of patient populations, and the efect of interventions on health-related quality of life.
Introduction
The standardized Short Form Health Survey 36 (SF-36) is an important tool for the assessment of quality of life1, and the comprehensiveness of its use in population surveys and in studies that analyze public policies and health status of patients2-6 can be verified by the references available in bibliographic data bases7 and the increas-ing number of validation studies in diferent countries and cultural contexts8. he purpose of this instrument is to detect clinical and socially relevant differences in the health status both of the general population and of people afected by a condition, as well as health-related changes throughout time9, by means of a reduced number of statistically eicient dimensions10.
he SF-36 is constituted of 36 questions, one that measures the transition from the health status in a period of one year and is not employed in the calculation of scales, and the others that are groups in eight scales or domains. Higher scores indicate better health status. he time to fulill the questionnaire, from 5 to 10 minutes, and the versatility of its application by self-illing, telephone or personal interviews with people aged more than 14 years old, with reliability and valida-tion levels that exceed the minimum recom-mended standards make this instrument an attractive tool to be combined with other population surveys.
In Brazil, the SF-36 was used in stud-ies about quality of life of patients with terminal chronic renal insufficiency in outpatient hemodialysis11, arterial hyper-tension12, submitted to hip fracture repair surgery13, living with HIV/AIDS14, and in a household survey of people living in the state of São Paulo15.
hese studies shows that scores for the SF-36 domains obtained in adult popula-tions presented high reliability and good criterion validity when compared to other instruments that assess the quality of life. he analysis of SF-36 data coming from a probabi-listic sample of Brazilian households showed that the obtained scales meet the minimum
Resumo
O questionário de 36 itens Short Form 36 (SF-36) é uma medida de qualidade de vida, relacionada à saúde, amplamente utilizada. Dados normativos são importantes para determinar se os escores de um grupo ou indivíduo estão acima ou abaixo da média do seu país, grupo etário ou sexo. A despeito do seu emprego em várias pesquisas no Brasil, dados normativos de abrangência nacional para o SF-36 não foram publicados previa-mente. Métodos: A Pesquisa Dimensões Sociais das Desigualdades (PDSD) é um inquérito que entrevistou 12.423 homens e mulheres brasileiros com idade de 18 anos e mais, selecionados aleatoriamente em áreas urbanas e rurais das cinco regiões brasileiras, e a informação coletada incluiu o SF-36 como uma medida de qualidade de vida relacio-nada à saúde. Isto proveu uma oportunidade única para desenvolver dados normativos ajustados por idade e sexo para a popula-ção brasileira. Resultados: Os escores dos homens brasileiros foram maiores que os das mulheres nos oito domínios e duas medidas componentes do SF-36. Os brasileiros tive-ram pontuação mais baixa que seus respec-tivos contrapartes internacionais em quase todos os domínios e medidas componentes do SF-36, à exceção do estado geral de saúde (USA), dor (GB) e vitalidade (Austrália, USA e Canadá). Conclusão: As diferenças nos esco-res do SF-36 entre grupos etários, sexo e paí-ses conirmam que as normas brasileiras são necessárias para propósitos comparativos. Os dados serão úteis para avaliar o status de saúde da população em geral e dos pacien-tes, e o efeito das intervenções na qualidade de vida relacionada à saúde.
psychometric standards required for quality of data, grading conjectures, reliability and validity of the instrument, and that these reproduce the physical and mental hypotheti-cal dimensions. he relationship standards between factors and scales are predictive of their associations with external factors of physical and mental health16. Besides, this analysis enabled the estimation of national scores to determine if a group or individual is above or below the average for their country, age or gender.
Since health status is a social construc-tion in which the assessment of the health of a person is made within a specific cul-tural comprehension of health17, and since the cross-cultural validity of an instrument should adopt the descriptive system devel-oped internationally, but with scores calcu-lated according to the variation observed in the speciic population, it is essential to have Brazilian normative data in SF-36. herefore, the objective of this article was to present the descriptive measures of the scale scores and measures composing the SF-36 according to age and age group obtained in a probabilistic sample of Brazilian households.
Materials and Methods
he sample is entirely probabilistic and stratified in multiple stages, which allows accurate inferences of population parameters.
The study Dimensõ es S o ciais das Desigualdades (PDSD) (Social Dimensions of Inequalities) was a population-based house-hold survey which interviewed, from July to December 2008, 12,423 heads of families and spouses living in 8,048 private households in common and non-special sectors (including slums) in all of the regions in Brazil, except for the rural zone of the North region.
Considering the analysis of inequalities, a sample stratum was created with the 10% richest census sectors in the research scope, with the objective of improving the precision of inequality indicators. he sample was in accordance with a probabilistic procedure in three stages, in which at first the cities were selected, followed by the census sectors
inside the cities and, finally, the house-holds inside the sectors. Basic information about schooling and work was collected for all of the individuals aged 10 years old or more. he percentage of holders in the households who answered to the research ranged from 96%, in rural zones of the Northeast region, to 31%, in the metropolitan area of Rio de Janeiro, and 23% in the richest sectors of metropolitan areas.
Results
Sample characteristics
he response rate to SF-36 was of 100%, and the quality indicator of the comprehen-sion of the 15 pairs showed that only 7.4% were inconsistent for one pair of questions, while 7.3% showed inconsistency to 2 to 4 pairs of questions. he pair of answers that presented more inconsistency (3.7%) combined the statement that taking a shower or getting dressed was too limiting, and the statement of not having limitations to perform vigorous activities. he distribution of items demon-strated that all of the categories were used by the respondents, with inclination towards the most favorable health status among male participants, aged less than 40 years old, with higher schooling.
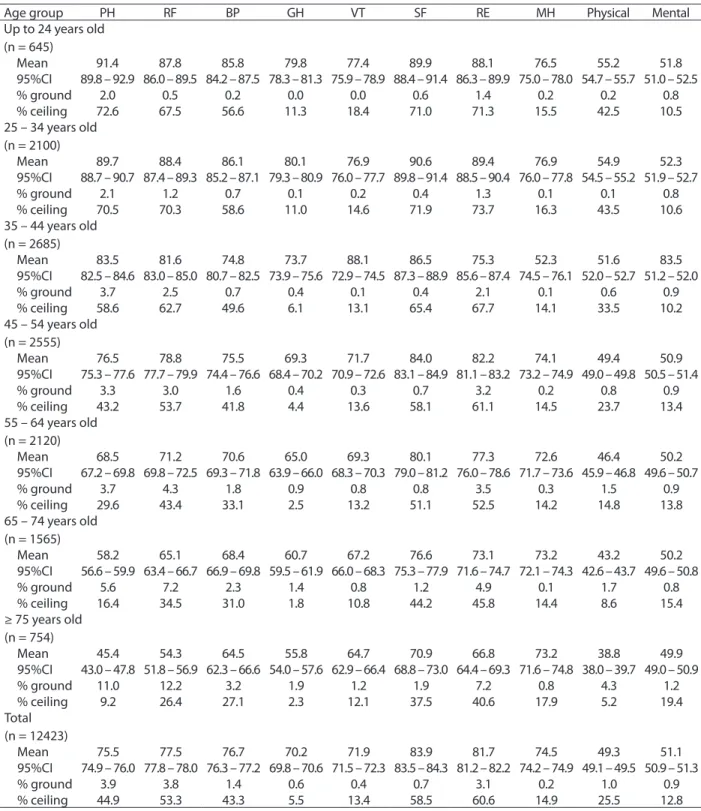
he age-standardized scores for the eight scale domains and the two components (physi-cal and mental health) of the SF-36 ranged according to age, being higher among the younger age groups and decreasing with age (Table 1). Even though several domains had shown ceiling efect (60.6% in role-emotional and 58.5% in social functioning), this pat-tern was not observed in the ground efect (3.9% for physical functioning and 3.8% for role-physical).
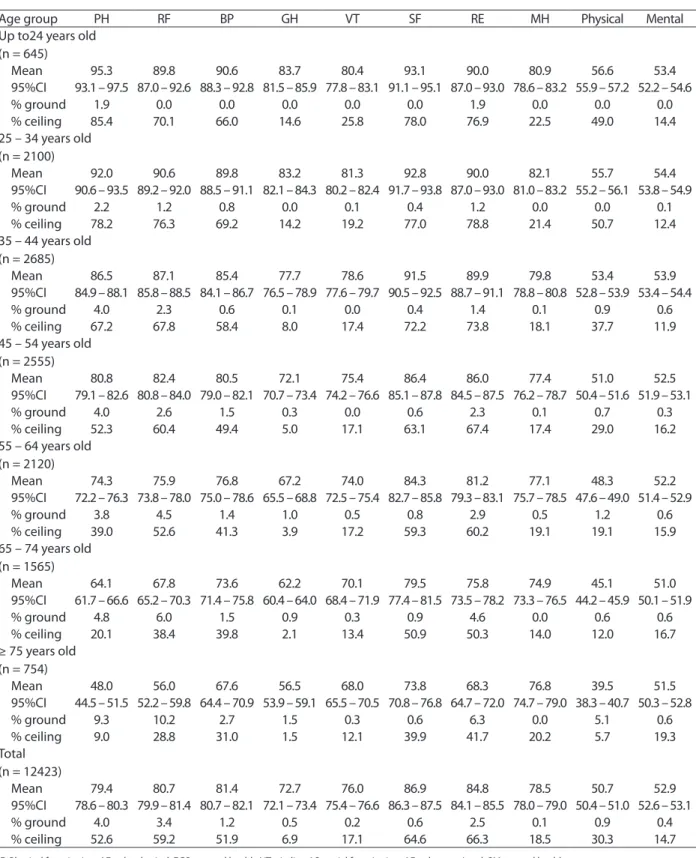
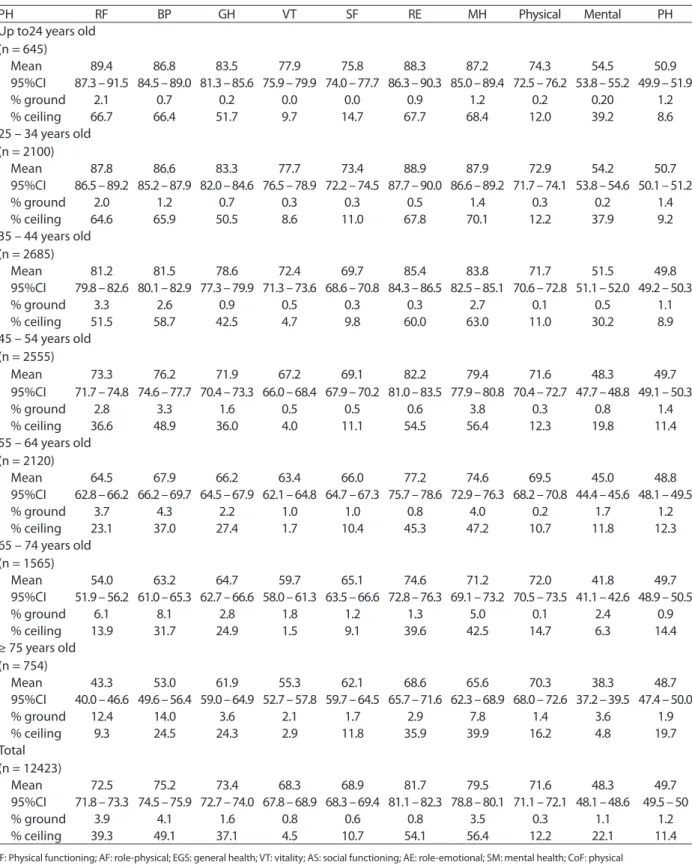
As expected, mean scores of Brazilian men and women ranged according to age and gender (Tables 2 and 3). Among men, vitality in the younger age groups and general health in the other age groups presented with the lowest values. Among women, the scores of mental health in the age groups younger than 35 years old, as well as functional capacity, in age groups older than 64 years old, showed the lowest values. As in the general sample, several domains exhibited strong ceiling efect (86.9% for men and 81.7% for women in social functioning), but only some domains pre-sented this same pattern for the ground efect (4% for men and 3.9% for women in physical functioning). Men presented higher scores in relation to women for all of the domains and the two summary measures. Even though the conidence intervals are not superposed for
any of the domains or summary measures, the magnitude of the diference should be considered. Except for general health and physical and mental health, all of the other domains had more than ive points of difer-ence, which is considered to be clinically and socially signiicant.
Discussion
he analysis of SF-36 data, applied in this Brazilian population sample, demonstrated good performance of the Brazilian version of this instrument, and that this questionnaire provides a valid measure of quality of life in the general population16. herefore, the herein presented data can be a reference for studies of health inequalities in the country. Brazilian scores for the eight domains and the two summary measures of the SF-36 scale were similar to those of the United States, Australia, Canada and Great Britain5,20,21, but there is a pattern of lower scores in the sample for almost all of the domains in comparison to data from other countries, except for the scales of general health, higher than Great Britain; bodily pain, above the scores of Australia, the United States and Canada; and vitality, whose scores are higher than ive when compared to Australian, north-American, Canadian and Great Britain scores.
Table 1 - Descriptive measures of the standardized scores for the eight domains of the 36-item Short Form and for the two summary measures (physical and mental health) of the Brazilian population by age groups.
Tabela 1 - Medidas descritivas dos escores padronizados das oito escalas e dos dois componentes do 36-item Short Form da população brasileira segundo faixa etária.
Age group PH RF BP GH VT SF RE MH Physical Mental
Up to 24 years old (n = 645)
Mean 91.4 87.8 85.8 79.8 77.4 89.9 88.1 76.5 55.2 51.8
95%CI 89.8 – 92.9 86.0 – 89.5 84.2 – 87.5 78.3 – 81.3 75.9 – 78.9 88.4 – 91.4 86.3 – 89.9 75.0 – 78.0 54.7 – 55.7 51.0 – 52.5
% ground 2.0 0.5 0.2 0.0 0.0 0.6 1.4 0.2 0.2 0.8
% ceiling 72.6 67.5 56.6 11.3 18.4 71.0 71.3 15.5 42.5 10.5
25 – 34 years old (n = 2100)
Mean 89.7 88.4 86.1 80.1 76.9 90.6 89.4 76.9 54.9 52.3
95%CI 88.7 – 90.7 87.4 – 89.3 85.2 – 87.1 79.3 – 80.9 76.0 – 77.7 89.8 – 91.4 88.5 – 90.4 76.0 – 77.8 54.5 – 55.2 51.9 – 52.7
% ground 2.1 1.2 0.7 0.1 0.2 0.4 1.3 0.1 0.1 0.8
% ceiling 70.5 70.3 58.6 11.0 14.6 71.9 73.7 16.3 43.5 10.6
35 – 44 years old (n = 2685)
Mean 83.5 81.6 74.8 73.7 88.1 86.5 75.3 52.3 51.6 83.5
95%CI 82.5 – 84.6 83.0 – 85.0 80.7 – 82.5 73.9 – 75.6 72.9 – 74.5 87.3 – 88.9 85.6 – 87.4 74.5 – 76.1 52.0 – 52.7 51.2 – 52.0
% ground 3.7 2.5 0.7 0.4 0.1 0.4 2.1 0.1 0.6 0.9
% ceiling 58.6 62.7 49.6 6.1 13.1 65.4 67.7 14.1 33.5 10.2
45 – 54 years old (n = 2555)
Mean 76.5 78.8 75.5 69.3 71.7 84.0 82.2 74.1 49.4 50.9
95%CI 75.3 – 77.6 77.7 – 79.9 74.4 – 76.6 68.4 – 70.2 70.9 – 72.6 83.1 – 84.9 81.1 – 83.2 73.2 – 74.9 49.0 – 49.8 50.5 – 51.4
% ground 3.3 3.0 1.6 0.4 0.3 0.7 3.2 0.2 0.8 0.9
% ceiling 43.2 53.7 41.8 4.4 13.6 58.1 61.1 14.5 23.7 13.4
55 – 64 years old (n = 2120)
Mean 68.5 71.2 70.6 65.0 69.3 80.1 77.3 72.6 46.4 50.2
95%CI 67.2 – 69.8 69.8 – 72.5 69.3 – 71.8 63.9 – 66.0 68.3 – 70.3 79.0 – 81.2 76.0 – 78.6 71.7 – 73.6 45.9 – 46.8 49.6 – 50.7
% ground 3.7 4.3 1.8 0.9 0.8 0.8 3.5 0.3 1.5 0.9
% ceiling 29.6 43.4 33.1 2.5 13.2 51.1 52.5 14.2 14.8 13.8
65 – 74 years old (n = 1565)
Mean 58.2 65.1 68.4 60.7 67.2 76.6 73.1 73.2 43.2 50.2
95%CI 56.6 – 59.9 63.4 – 66.7 66.9 – 69.8 59.5 – 61.9 66.0 – 68.3 75.3 – 77.9 71.6 – 74.7 72.1 – 74.3 42.6 – 43.7 49.6 – 50.8
% ground 5.6 7.2 2.3 1.4 0.8 1.2 4.9 0.1 1.7 0.8
% ceiling 16.4 34.5 31.0 1.8 10.8 44.2 45.8 14.4 8.6 15.4
≥ 75 years old (n = 754)
Mean 45.4 54.3 64.5 55.8 64.7 70.9 66.8 73.2 38.8 49.9
95%CI 43.0 – 47.8 51.8 – 56.9 62.3 – 66.6 54.0 – 57.6 62.9 – 66.4 68.8 – 73.0 64.4 – 69.3 71.6 – 74.8 38.0 – 39.7 49.0 – 50.9
% ground 11.0 12.2 3.2 1.9 1.2 1.9 7.2 0.8 4.3 1.2
% ceiling 9.2 26.4 27.1 2.3 12.1 37.5 40.6 17.9 5.2 19.4
Total (n = 12423)
Mean 75.5 77.5 76.7 70.2 71.9 83.9 81.7 74.5 49.3 51.1
95%CI 74.9 – 76.0 77.8 – 78.0 76.3 – 77.2 69.8 – 70.6 71.5 – 72.3 83.5 – 84.3 81.2 – 82.2 74.2 – 74.9 49.1 – 49.5 50.9 – 51.3
% ground 3.9 3.8 1.4 0.6 0.4 0.7 3.1 0.2 1.0 0.9
% ceiling 44.9 53.3 43.3 5.5 13.4 58.5 60.6 14.9 25.5 12.8
CF: Physical functioning; AF: role-physical; EGS: general health; VT: vitality; AS: social functioning; AE: role-emotional; SM: mental health. Source: Pesquisa Dimensões Sociais das Desigualdades, 2008.
Table 2 - Descriptive measures of the standardized scores for the eight domains of the 36-item Short Form and for the two summary measures (physical and mental component) of the Brazilian male population by age groups.
Tabela 2 - Medidas descritivas dos escores padronizados das oito escalas e dos dois componentes do 36-item Short Form da população masculina brasileira segundo faixa etária. Pesquisa Dimensões Sociais das Desigualdades, 2008.
Age group PH RF BP GH VT SF RE MH Physical Mental
Up to24 years old (n = 645)
Mean 95.3 89.8 90.6 83.7 80.4 93.1 90.0 80.9 56.6 53.4
95%CI 93.1 – 97.5 87.0 – 92.6 88.3 – 92.8 81.5 – 85.9 77.8 – 83.1 91.1 – 95.1 87.0 – 93.0 78.6 – 83.2 55.9 – 57.2 52.2 – 54.6
% ground 1.9 0.0 0.0 0.0 0.0 0.0 1.9 0.0 0.0 0.0
% ceiling 85.4 70.1 66.0 14.6 25.8 78.0 76.9 22.5 49.0 14.4
25 – 34 years old (n = 2100)
Mean 92.0 90.6 89.8 83.2 81.3 92.8 90.0 82.1 55.7 54.4
95%CI 90.6 – 93.5 89.2 – 92.0 88.5 – 91.1 82.1 – 84.3 80.2 – 82.4 91.7 – 93.8 87.0 – 93.0 81.0 – 83.2 55.2 – 56.1 53.8 – 54.9
% ground 2.2 1.2 0.8 0.0 0.1 0.4 1.2 0.0 0.0 0.1
% ceiling 78.2 76.3 69.2 14.2 19.2 77.0 78.8 21.4 50.7 12.4
35 – 44 years old (n = 2685)
Mean 86.5 87.1 85.4 77.7 78.6 91.5 89.9 79.8 53.4 53.9
95%CI 84.9 – 88.1 85.8 – 88.5 84.1 – 86.7 76.5 – 78.9 77.6 – 79.7 90.5 – 92.5 88.7 – 91.1 78.8 – 80.8 52.8 – 53.9 53.4 – 54.4
% ground 4.0 2.3 0.6 0.1 0.0 0.4 1.4 0.1 0.9 0.6
% ceiling 67.2 67.8 58.4 8.0 17.4 72.2 73.8 18.1 37.7 11.9
45 – 54 years old (n = 2555)
Mean 80.8 82.4 80.5 72.1 75.4 86.4 86.0 77.4 51.0 52.5
95%CI 79.1 – 82.6 80.8 – 84.0 79.0 – 82.1 70.7 – 73.4 74.2 – 76.6 85.1 – 87.8 84.5 – 87.5 76.2 – 78.7 50.4 – 51.6 51.9 – 53.1
% ground 4.0 2.6 1.5 0.3 0.0 0.6 2.3 0.1 0.7 0.3
% ceiling 52.3 60.4 49.4 5.0 17.1 63.1 67.4 17.4 29.0 16.2
55 – 64 years old (n = 2120)
Mean 74.3 75.9 76.8 67.2 74.0 84.3 81.2 77.1 48.3 52.2
95%CI 72.2 – 76.3 73.8 – 78.0 75.0 – 78.6 65.5 – 68.8 72.5 – 75.4 82.7 – 85.8 79.3 – 83.1 75.7 – 78.5 47.6 – 49.0 51.4 – 52.9
% ground 3.8 4.5 1.4 1.0 0.5 0.8 2.9 0.5 1.2 0.6
% ceiling 39.0 52.6 41.3 3.9 17.2 59.3 60.2 19.1 19.1 15.9
65 – 74 years old (n = 1565)
Mean 64.1 67.8 73.6 62.2 70.1 79.5 75.8 74.9 45.1 51.0
95%CI 61.7 – 66.6 65.2 – 70.3 71.4 – 75.8 60.4 – 64.0 68.4 – 71.9 77.4 – 81.5 73.5 – 78.2 73.3 – 76.5 44.2 – 45.9 50.1 – 51.9
% ground 4.8 6.0 1.5 0.9 0.3 0.9 4.6 0.0 0.6 0.6
% ceiling 20.1 38.4 39.8 2.1 13.4 50.9 50.3 14.0 12.0 16.7
≥ 75 years old (n = 754)
Mean 48.0 56.0 67.6 56.5 68.0 73.8 68.3 76.8 39.5 51.5
95%CI 44.5 – 51.5 52.2 – 59.8 64.4 – 70.9 53.9 – 59.1 65.5 – 70.5 70.8 – 76.8 64.7 – 72.0 74.7 – 79.0 38.3 – 40.7 50.3 – 52.8
% ground 9.3 10.2 2.7 1.5 0.3 0.6 6.3 0.0 5.1 0.6
% ceiling 9.0 28.8 31.0 1.5 12.1 39.9 41.7 20.2 5.7 19.3
Total (n = 12423)
Mean 79.4 80.7 81.4 72.7 76.0 86.9 84.8 78.5 50.7 52.9
95%CI 78.6 – 80.3 79.9 – 81.4 80.7 – 82.1 72.1 – 73.4 75.4 – 76.6 86.3 – 87.5 84.1 – 85.5 78.0 – 79.0 50.4 – 51.0 52.6 – 53.1
% ground 4.0 3.4 1.2 0.5 0.2 0.6 2.5 0.1 0.9 0.4
% ceiling 52.6 59.2 51.9 6.9 17.1 64.6 66.3 18.5 30.3 14.7
CF: Physical functioning; AF: role-physical; EGS: general health; VT: vitality; AS: social functioning; AE: role-emotional; SM: mental health.
Table 3 - Descriptive measures of the standardized scores for the eight domains of the 36-item Short Form and for the two summary measures (physical and mental component) of the Brazilian female population by age groups.
Tabela 3 - Medidas descritivas dos escores padronizados das oito escalas e dos dois componentes do 36-item Short Form da população feminina brasileira segundo faixa etária. Pesquisa Dimensões Sociais das Desigualdades, 2008.
PH RF BP GH VT SF RE MH Physical Mental PH
Up to24 years old (n = 645)
Mean 89.4 86.8 83.5 77.9 75.8 88.3 87.2 74.3 54.5 50.9
95%CI 87.3 – 91.5 84.5 – 89.0 81.3 – 85.6 75.9 – 79.9 74.0 – 77.7 86.3 – 90.3 85.0 – 89.4 72.5 – 76.2 53.8 – 55.2 49.9 – 51.9
% ground 2.1 0.7 0.2 0.0 0.0 0.9 1.2 0.2 0.20 1.2
% ceiling 66.7 66.4 51.7 9.7 14.7 67.7 68.4 12.0 39.2 8.6
25 – 34 years old (n = 2100)
Mean 87.8 86.6 83.3 77.7 73.4 88.9 87.9 72.9 54.2 50.7
95%CI 86.5 – 89.2 85.2 – 87.9 82.0 – 84.6 76.5 – 78.9 72.2 – 74.5 87.7 – 90.0 86.6 – 89.2 71.7 – 74.1 53.8 – 54.6 50.1 – 51.2
% ground 2.0 1.2 0.7 0.3 0.3 0.5 1.4 0.3 0.2 1.4
% ceiling 64.6 65.9 50.5 8.6 11.0 67.8 70.1 12.2 37.9 9.2
35 – 44 years old (n = 2685)
Mean 81.2 81.5 78.6 72.4 69.7 85.4 83.8 71.7 51.5 49.8
95%CI 79.8 – 82.6 80.1 – 82.9 77.3 – 79.9 71.3 – 73.6 68.6 – 70.8 84.3 – 86.5 82.5 – 85.1 70.6 – 72.8 51.1 – 52.0 49.2 – 50.3
% ground 3.3 2.6 0.9 0.5 0.3 0.3 2.7 0.1 0.5 1.1
% ceiling 51.5 58.7 42.5 4.7 9.8 60.0 63.0 11.0 30.2 8.9
45 – 54 years old (n = 2555)
Mean 73.3 76.2 71.9 67.2 69.1 82.2 79.4 71.6 48.3 49.7
95%CI 71.7 – 74.8 74.6 – 77.7 70.4 – 73.3 66.0 – 68.4 67.9 – 70.2 81.0 – 83.5 77.9 – 80.8 70.4 – 72.7 47.7 – 48.8 49.1 – 50.3
% ground 2.8 3.3 1.6 0.5 0.5 0.6 3.8 0.3 0.8 1.4
% ceiling 36.6 48.9 36.0 4.0 11.1 54.5 56.4 12.3 19.8 11.4
55 – 64 years old (n = 2120)
Mean 64.5 67.9 66.2 63.4 66.0 77.2 74.6 69.5 45.0 48.8
95%CI 62.8 – 66.2 66.2 – 69.7 64.5 – 67.9 62.1 – 64.8 64.7 – 67.3 75.7 – 78.6 72.9 – 76.3 68.2 – 70.8 44.4 – 45.6 48.1 – 49.5
% ground 3.7 4.3 2.2 1.0 1.0 0.8 4.0 0.2 1.7 1.2
% ceiling 23.1 37.0 27.4 1.7 10.4 45.3 47.2 10.7 11.8 12.3
65 – 74 years old (n = 1565)
Mean 54.0 63.2 64.7 59.7 65.1 74.6 71.2 72.0 41.8 49.7
95%CI 51.9 – 56.2 61.0 – 65.3 62.7 – 66.6 58.0 – 61.3 63.5 – 66.6 72.8 – 76.3 69.1 – 73.2 70.5 – 73.5 41.1 – 42.6 48.9 – 50.5
% ground 6.1 8.1 2.8 1.8 1.2 1.3 5.0 0.1 2.4 0.9
% ceiling 13.9 31.7 24.9 1.5 9.1 39.6 42.5 14.7 6.3 14.4
≥ 75 years old (n = 754)
Mean 43.3 53.0 61.9 55.3 62.1 68.6 65.6 70.3 38.3 48.7
95%CI 40.0 – 46.6 49.6 – 56.4 59.0 – 64.9 52.7 – 57.8 59.7 – 64.5 65.7 – 71.6 62.3 – 68.9 68.0 – 72.6 37.2 – 39.5 47.4 – 50.0
% ground 12.4 14.0 3.6 2.1 1.7 2.9 7.8 1.4 3.6 1.9
% ceiling 9.3 24.5 24.3 2.9 11.8 35.9 39.9 16.2 4.8 19.7
Total (n = 12423)
Mean 72.5 75.2 73.4 68.3 68.9 81.7 79.5 71.6 48.3 49.7
95%CI 71.8 – 73.3 74.5 – 75.9 72.7 – 74.0 67.8 – 68.9 68.3 – 69.4 81.1 – 82.3 78.8 – 80.1 71.1 – 72.1 48.1 – 48.6 49.5 – 50
% ground 3.9 4.1 1.6 0.8 0.6 0.8 3.5 0.3 1.1 1.2
% ceiling 39.3 49.1 37.1 4.5 10.7 54.1 56.4 12.2 22.1 11.4
CF: Physical functioning; AF: role-physical; EGS: general health; VT: vitality; AS: social functioning; AE: role-emotional; SM: mental health; CoF: physical component summary; CoM: mental component summary.
References
1. Taft C, Karlsson J, Sullivan M. Do SF-36 summary
components scores accurately summarize subscale scores? Qual Life Res 2001; 10: 395-4046.
2. McHorney CA, Ware JE, Lu JFR, Sherbourne CD. he MOS 36-item Short Form Health Survey (SF-36): III. Tests of data quality scaling assumptions and reliability across diverse patient groups. Med Care 1994; 32: 40-66.
3. Jenkinson C, Layte R, Coulter A, Wright L. Evidence for the sensitivity of the SF-36 health status measure to inequalities in health: results from the Oxford healthy lifestyles survey. J Epidemiol Community Health 1996; 50: 377-80.
4. McDowell I., Newell C. Measuring health: a guide to rating scales and questionnaires. 2nd edition. New York: Oxford University Press; 1996.
5. Ware JE. SF-36 Health Survey Update. Spine 2000; 25(24): 3130-9.
6. Wilson D, Parsons J, Tuckerr G. he SF-36 summary scales: problems and solutions. Soz-Praventivmed 2000; 45: 239-46.
7. Hawthorne G, Osborne RH, Taylor A, Sansoni J. he SF36 version 2: critical analyses of population weights, scoring algorithms and population norms. Qual Life Res 2007; 16: 661-73.
8. Gandek B, Ware JE, Aaronson NK, Alonso J, Apolone G, Bjorner J, et al. Tests of data quality scaling assumptions and reliability of the SF-36 in eleven countries: results from the IQOLA Project. J Clin Epidemiol 1998; 51: 1149-58.
9. Ware JE, Sherbourne CD. he MOS 36-Item Short Form Health Survey (SF-36) I. Conceptual framework and item selection. Med Care 1992; 30: 473-83.
10. Jenkinson C, Layte R., Lawrence K. Development and testing of the Medical Outcomes Study 36-Item Short Form Health Survey Summary Scale scores in the United Kingdom. Results from a large-scale survey and a clinical trial. Medl Care 1997; 35: 410-6.
11. Souza FF. Avaliação da qualidade de vida do idoso em hemodiálise: comparação de dois instrumentos genéricos [Dissertação]. Campinas: Faculdade de Ciências Médicas da Universidade Estadual de Campinas; 2004. 167 p.
12. Silqueira SMF. O questionário genérico SF-36 como
instrumento de mensuração da qualidade de vida relacionado à saúde de pacientes hipertensos [Tese]. Ribeirão Preto: Escola de Enfermagem da Universidade de São Paulo; 2005. 112 p.
13. Mendonça TMS. Avaliação prospectiva da qualidade de vida relacionada à saúde em idosos com fratura do quadril por meio de um instrumento genérico – he Medical Outcome Study – 36-item Short-Form Health Survey (SF-36) [Dissertação]. Uberlândia: Faculdade de Medicina, Universidade Federal de Uberlândia; 2006. 119 p.
14. Soárez PC, Castelo A, Abrão P, Holmes WC, Ciconelli RM. Tradução e validação de um questionário de avaliação de qualidade de vida em AIDS no Brasil. Rev Panam Salud Publica 2009; 25: 69-76.
15. Lima MG, Barros MBA, César CLG, Goldbaum M, Carandina L, Ciconelli RM. Health related quality of life among the elderly: a population-based study using SF-36 survey. Cad Saúde Pública 2009; 25: 2159-67.
16. Laguardia J, Campos MR, Travassos CM, Najar AL, Anjos LA, Vasconcellos MM. Psychometric evaluation of the SF-36 (v.2) questionnaire in a probability sample of Brazilian households: results of the survey Pesquisa Dimensões Sociais das Desigualdades (PDSD), Brazil 2008. Health and Quality of Life Outcomes 2011; 9: 61.
17. Gandek B, Ware JE. Methods for validating and norming translations of health Status Questionnaires: he IQOLA Project Approach. J Clin Epidemiol 1998; 51: 953-9.
18. Campolina AG, Ciconelli RM. O SF-36 e o desenvolvimento de novas medidas de avaliação da qualidade de vida. Acta Reumatol Port 2008; 33: 127-33.
study was the analysis of factors that can be used as weight to calculate the summary measures of physical and mental health in the second Brazilian version of SF-36, to be applied in urban and rural Brazilian populations.
he data in this study were obtained by a complex sample that represents Brazilian households. The information collected in this study concern 12,423 individuals living in 8,048 private households in common and non-special sectors (including slums) of all of the regions in Brazil, in urban and rural areas. herefore, the results represented the set of the Brazilian population, and not necessar-ily the demographic strata used in this analysis.
Conclusion
19. Ware JE, Kosinki M, Gandek B. SF-36 Health Survey: Manual & Interpretation Guide. Lincoln RI: QualityMetric; 2000.
20. Bowling A, Bond M, Jenkinson C, Lamping DE. Short Form 36 (SF-36) Health Survey questionnaire: which normative data should be used? Comparisons between the norms provided by the Omnibus Survey in Britain, the Health Survey for England and the Oxford Healthy Life Survey. Journal of Public Health Medicine 1999; 21(3): 255-70.
21. Hopman WM, Towheed T, Anastassiades T, Tenenhouse A, Poliquin S, Berger C, et al. The Canadian Multicentre Osteoporosis Study Research Group. Canadian normative data for the SF-36 health survey. CMAJ 2000; 163(3): 265-71.