ABSTRACT:Introduction: When it is impossible to measure weight in the elderly, estimation methods can be employed. However, such methods are not always applicable and can lead to estimation errors that compromise both the clinical practice and the results in epidemiological studies. Objective: To compare and validate weight estimation methods in the elderly living in nursing homes in Natal, Rio Grande do Norte, Brazil. Methods:
The equations were evaluated qualitatively, by the reproducibility of the measurements that comprised them, and quantitatively, by the mean diference between the measured and the estimated weights, using Student’s t-test for paired samples or ANOVA, the coeicient of determination (R²), root mean square error (RMSE), intra-class correlation coeicient (ICC) and graphical analysis of residuals. The signiicance value adopted was of p < 0.05. It was considered applicable when the equation presented R² > 0.7; lowest RMSE among the evaluated equations; ICC > 0.7; and respective 95% conidence interval with less distance between the upper and lower limits. Results: We evaluated 315 elderly from 10 nursing homes in Natal. The mean body weight was higher in the younger elderly and those without mobility restriction. The qualitative analysis showed the equation 5 as having the best reproducibility, since it does not use skinfold measurements. The quantitative analysis revealed the equation 5 as the one with the best applicability across the studied population and in the diferent genders, age groups (60 – 69 years, 70 – 79 years, and 80 years or more), and mobility restriction conditions. Conclusion: The equation 5 was applicable for estimating weight in the evaluated population and in the diferent strata analyzed.
Keywords: Cross-sectional studies. Validation studies. Health of the elderly. Nutritional status. Nutrition assessment. Anthropometry.
Estimating weight in elderly residents
in nursing homes: which equation to use?
Estimativa de peso em idosos institucionalizados: qual equação utilizar?
Marcos Felipe Silva de LimaI, Natália Louise de Araújo CabralI, Larissa Praça de OliveiraI, Laura Camila Pereira LiberalinoI, Maria Helena Constantino SpyridesII,
Kenio Costa de LimaIII, Clélia de Oliveira LyraIV
IGraduate Program in Public Health, Universidade Federal do Rio Grande do Norte – Natal (RN), Brazil.
IIDepartment of Atmospheric and Climate Sciences, Universidade Federal do Rio Grande do Norte – Natal (RN), Brazil. IIIDepartment of Dentistry at Universidade Federal do Rio Grande do Norte– Natal (RN), Brazil.
IVDepartment of Nutrition at Universidade Federal do Rio Grande do Norte– Natal (RN), Brazil.
Corresponding author: Clélia de Oliveira Lyra. Universidade Federal do Rio Grande do Norte, Centro de Ciências da Saúde, Departamento de Nutrição. Avenida Senador Salgado Filho, 3000, Campus Universitário, Lagoa Nova, CEP: 59078‑970, Natal, RN, Brasil. E‑mail: [email protected]
Conlict of interests: nothing to declare – Financial support: Fundação de Apoio à Pesquisa do Estado do Rio Grande do Norte (FAPERN), FAPERN/CNPq 003/2011 document, Support Program for Emerging Centers (PRONEM), process number 77228/2013.
INTRODUCTION
Elderly is a phase of life marked by the intensification of the physical and functional decline. In this group, especially institutionalized elderly are the ones that have more vulnerability and compromise of the autonomy and independence1. When combined
to physiological alterations characteristic of aging and morbidities prevalent in this phase of life, such as chronic diseases, among others, the nutritional status (NS) can be affected, resulting in anthropometric and nutritional deficits or overweight, further damaging the health2. Thus, the assessment of NS is an important tool in monitoring
the nutritional status.
The body weight, which composes the body mass index (BMI), is the main measure-ment used in the anthropometric evaluation. Weight alterations relect imbalance between food ingestion and consumption. The involuntary weight loss is intimately linked with the frailty syndrome in the elderly and is characterized by decreasing physiologic reserves and deicits capable of causing adverse efects to the health, such as falls, worsening of diseases, functional disability, comorbidities, hospitalization, prolonged institutionaliza-tion, and death3,4.
Despite the importance of this measurement in monitoring the NS and health treatments, the weight measuring is harder in elderly people with mobility restriction. In such cases, weight can be estimated from other anthropometric measurements5. The main methods
RESUMO:Introdução: Na impossibilidade de mensuração do peso em idosos, métodos de estimativa podem ser empregados. Entretanto, tais métodos nem sempre são aplicáveis, podendo levar a erros de estimativa que comprometem tanto a prática clínica quanto resultados em estudos epidemiológicos. Objetivo: Comparar e validar métodos de estimativa de peso em idosos residentes em instituições de longa permanência de Natal, Rio Grande do Norte. Métodos: Avaliaram-se as equações qualitativamente pela reprodutibilidade das medidas que as compunham e, quantitativamente, pela diferença média entre o peso mensurado e os estimados, e utilizado o teste t de Student para amostras pareadas ou ANOVA, coeiciente de determinação (R²), raiz do erro quadrático médio (REQM), coeiciente de correlação intraclasse (CCI) e análise gráica de resíduos. Adotou-se como valor de signiicância p < 0,05. Considerou-se aplicável quando a equação apresentava R² > 0,7; menor REQM dentre as equações avaliadas; CCI > 0,7; e respectivo intervalo de coniança 95% com menor distância entre os limites inferior e superior. Resultados: Avaliaram-se 315 idosos de 10 instituições de longa permanência de Natal. O peso corporal médio foi maior nos idosos mais jovens e sem restrição de mobilidade. A análise qualitativa mostrou a equação 5 como a de melhor reprodutilidade, uma vez que não utiliza medidas de dobras cutâneas. A análise quantitativa revelou a equação 5 como a de melhor aplicabilidade em toda a população avaliada e nos diferentes sexos, faixas etárias (60 a 69 anos, 70 a 79 anos e 80 anos ou mais) e condição de restrição de mobilidade. Conclusão:
A equação 5 foi aplicável para a estimativa de peso na população avaliada e nos diferentes estratos analisados.
used in the scientiic literature are weight estimation protocols and equations developed by Chumlea et al.6 These equations were developed for American elderly people, from white
ethnicity, ages between 65 and 104 years. In Brazil, only one measurement protocol was developed7, being carried out with hospitalized patients, with ages between 32 and 66 years.
We point out that the application of these equations must take into account the compat-ibility of the characteristics between the population that originated the methods and the population one intends to assess.
The estimation equations, when not applicable to a particular individual or population, can lead to estimation errors both in the clinical practice and in epidemiological surveys. Inadequate weight estimation can lead to drug and dietary therapies that do not meet individual and/or collective needs. Given the importance of the applicability of simpliied methods for early detection of possible alterations in the anthropometric NS in institutional-ized elderly, this study aimed to compare and validate weight estimation methods in elderly residents of nursing homes for the elderly (NH). In this sense, the study aims to contribute to the monitoring of anthropometric NS for future nutrition interventions and to support recommendations about methods for estimation of body weight in this population.
METHODS
This is a cross-sectional study with a census characteristic carried out with elderly res-idents of a NH in Natal, Rio Grande do Norte, Brazil, in the period from October 2013 to June 2014. At the beginning of the study, 14 NH were registered in the Coordination of Health Surveillance (COVISA) of the municipality, with the population of 409 elderly people. NH residents aged 60 years or over and that were present at the time of the data collection were included in the study. Individuals with amputated limbs or physical disabil-ity that prevented the measuring of anthropometric measurements, such as the presence of sacral pressure ulcers and post-operative orthopedics, were excluded from the study.
A technical team composed of two previously trained and calibrated anthropometrists performed the data collection. The calibration was done using intra- and inter-evaluator technical error of measurement (TEM), adopting the classiication of experienced anthro-pometrist proposed by Pederson and Gore8 as the percentage of error acceptable for the
anthropometrists to be it for ield collection.
The following anthropometric measurements were taken: perimeter of the arm (AP), calf (CP), and waist (WP); subscapular skinfold (SS); and knee height (KH). The measurement pro-tocol of the anthropometric measurements followed the one proposed by each author for the preparation of the estimation methods. All the measurements were evaluated in duplicate, with each measure being measured once and subsequently repeated in the same sequence, starting with the upper limbs, the trunk, and then the lower limbs. Those measurements were taken with an anthropometric measuring tape (Sanny®) of 150 cm for the perimeter measurements;
a Lange® scientiic plicometer, with accuracy of 1.0 mm for the skinfolds; and one
in the elderly people that strolled with a Balmak® electronic scale, with capacity of 300 kg and
accuracy of 50 g. In the bedridden elderly people, the body weight was measured with the SECA® 985 scale (bed scale and electronic dialysis with equipment cart).
We used the observed weight as a standard measurement for comparison of the weight estimation equations. The estimated weight was calculated from the perimeters and skin-fold measurements using the Equations 1 to 3, according to Chumlea et al.6:
Feminine: W (kg) = (AP x 1.63) + (CP x 1.43) - 37.46 (1) Masculine: W (kg) = (AP x 2.31) + (CP x 1.50) - 50.10 (1)
Feminine: W (kg) = (AP x 0.92) + (CP x 1.50) + (SS x 0.42) - 26.19 (2) Masculine: W (kg) = (AP x 1.92) + (CP x 1.44) + (SS x 0.26) - 39.97 (2)
Feminine: W (kg) = (AP x 0.98) + (CP x 1.27) + (SS x 0.40) + (KH x 0.87) - 62.35 (3) Masculine: W (kg) = (AP x 1.73) + (CP x 0.98) + (SS x 0.37) + (KH x 1.16) - 81.69 (3)
And using the Equations 4 to 6. according to Rabito et al.7:
W (kg) = (0.5030 x AP) + (0.5634 x WP) + (1.318 x CP) + (0.0339 x SS) - 43.156 (4)
W (kg) = (0.4808 x AP) + (0.5646 x WP) + (1.316 x CP) - 42.2450 (5)
W (kg) = (0.5759 x AP) + (0.5263 x WP) + (1.2452 x CP) - (4.8689 x GENDER) - 32.9241 (6)
In which: W = weight;
AP = arm perimeter (cm); WP = waist perimeter (cm); CP = calf perimeter (cm); SS = subscapular skinfold (mm); KH = knee height (cm);
GENDER = 1 if masculine, 2 if feminine.
The data were analyzed using IBM SPSS® version 14.0 for Microsoft Windows®. In the
characterization of the sample, the entire study population was assessed and stratiied by gender (male and female), age group (60 – 69 years, 70 – 79 years, and 80 years or more) and mobility restrictions (with and without). In order to evaluate the quality of the anthro-pometric measurements collected, a test for diference in means was performed, using the Student’s t-test for independent samples with the variables gender and mobility restriction
and ANOVA for the variable age group (60 – 69 years, 70 – 79 years, and 80 years or more). The evaluation of the estimation equations proposed by Chumlea et al.6 and Rabito et al.7
analyzed from the plausibility and easiness to measure an anthropometric measurement that composes the estimation method and the reproducibility of the measurement. A score was given from the TEM calculated in the calibration of the anthropometrists that were examiners. The score was assigned from the weighted mean of the intra-evaluator TEM values among two evaluators (weight 1 for each) and the inter-evaluator TEM (weight 2). A score of value 1 was established for each anthropometric site that had an average TEM greater than or equal to 1.
Quantitatively, we evaluated the weight observed by the anthropometrists and the one estimated by the equations of Chumlea et al.6 and Rabito et al.7 using descriptive analysis,
mean diference between measured and estimated values, and respective conidence inter-val of 95% (95%CI) and Student’s t-test for paired samples. In the concordance analysis,
we used the coeicient of determination (R²), RMSE, ICC, and their respective 95%CI. To verify the magnitude of the errors of each equation, we used the graphical analysis of standardized residuals, and the Kolmogorov–Smirnov test was used to verify the compli-ance of the residuals to the normal curve. We adopted p < 0.05 as a signiiccompli-ance level for all the analyses. We considered an estimation method applicable for a particular group when R² was greater than 0.7; had the lowest RMSE among the evaluated methods; ICC higher than 0.7; respective 95%CI with smaller distance between the upper and lower limits; and when there was homogeneity of variance in the graphic residual analysis.
The study was approved by the Research Ethics Committee at Universidade Federal do Rio Grande do Norte, Natal, Rio Grande do Norte, Brazil, under the document 308/2012 (CAAE 0290.0.051.000-11).
RESULTS
Four NH refused to participate in the study, as well as 1 nonproit and 3 proit organiza-tions, resulting in the loss of 77 individuals. Of the elderly that met the eligibility criteria, we considered 17 losses associated with rejection, resulting in 315 elderly individuals evalu-ated, in 10 NH in the city of Natal. The proportion of losses amounted to 22.9% in relation to the individuals eligible to participate in the study.
The majority of the individuals evaluated were female (76.8%). In terms of age group, we veriied a signiicant decrease in weight with increasing age, with an average reduction of 4.06 kg for every decade. The mean age of the elderly people with mobility restriction was signiicantly higher than that ones without mobility restriction. Concerning body weight, the elderly without mobility restriction had a mean weight about 10 kg higher than those with mobility restrictions (Table 1).
The qualitative analysis of weight estimation equations showed that the weighted means of the TEM for the SS and arm perimeter measurements scored higher than or equal to 1. The estimation methods with lower scores were the equations of Rabito et al.7
(Equations 5 and 6) and Chumlea et al.6 (Equation 1). In these equations, only the arm
Table 1. Characterization of the population of elderly residents in nursing homes, Natal, Rio Grande do Norte, Brazil, 2014.
SD: standard deviation; astatistically signiicant p-value for t test of diference of means between male and female
genders; bstatistically signiicant p value for ANOVA between age groups; cstatistically signiicant p-value for t test of diference of means between the groups with and without mobility restrictions.
Population (n = 315)
Masculine (n = 73)
Feminine (n = 242)
60 – 69 years (n = 31)
70 – 79 years (n = 91)
80 years or more (n = 193)
Without mobility restriction
(n = 168)
With mobility restriction
(n = 147)
Mean (SD) Mean (SD) Mean (SD) Mean (SD) Mean (SD) Mean (SD) Mean (SD) Mean (SD)
Agea,b,c 81.96
(9.04) 78.68 (9.69) 82.94 (8.62) 65.74 (2.52) 75.13 (3.03) 87.78 (5.46) 79.91 (8.74) 84.29 (8.84)
Weighta,b,c 53.97
(14.57) 61.54 (14.18) 51.69 (13.92) 60.07 (14.64) 56.19 (16.14) 51.95 (13.37) 58.83 (14.19) 48.42 (12.95)
Knee heighta,b 47.7
(3.0) 50.8 (2.8) 46.8 (2.5) 47.9 (3.4) 48.2 (3.1) 47.5 (2.9) 47.7 (2.9) 47.8 (3.3) Waist perimeterc 89.3 (14.2) 91.7 (12.3) 88.5 (14.6) 91.6 (13.6) 89.6 (14.7) 88.7 (14.72) 91.0 (14.0) 87.3 (14.1) Arm perimetera,b,c 24.5 (4.7) 26.0 (3.8) 24.1 (4.8) 27.5 (4.5) 25.1 (5.1) 23.7 (4.3) 26.2 (4.6) 22.6 (3.9) Calf perimetera,b,c 29.5 (5.4) 30.8 (4.4) 29.1 (5.6) 31.6 (4.9) 29.8 (5.3) 29.0 (5.4) 31.7 (4.4) 26.9 (5.3) Triceps skinfoldb,c 15.7 (8.8) 14.1 (7.8) 16.2 (9.1) 19.3 (10.6) 16.2 (9.7) 14.9 (7.9) 18.3 (8.9) 12.8 (7.8) Subscapular skinfolda,b,c 15.8 (8.5) 17.7 (8.3) 15.3 (8.5) 21.5 (10.3) 17.3 (9.5) 14.2 (7.2) 18.8 (9.0) 12.4 (6.4)
The analysis of the estimation equations in the entire studied population enabled us to verify an underestimation of weight with the use of the equations of Chumlea et al.6
(Equations 1 to 3) and an overestimation with the equations of Rabito et al.7 (Equations
4 to 6). The equation of Chumlea et al.6 (Equation 2), which showed a lower mean
difer-ence, underestimated the weight in about 5 kg. The equation of Rabito et al.7 (Equation 5)
showed the lowest mean diference, overestimating the weight in 2.3 kg, a diference con-sidered statistically signiicant (Figure 1).
In the analysis by gender, similarities in the results were found. However, the mean dif-ferences between the observed and estimated weights were higher for females, with the exception of the equation of Rabito et al.7 (Equation 5), which had the same mean
difer-ence value. The estimates from the equation of Rabito et al.7 (Equations 4 and 6) for males
Eq. 1, 2, and 3 (Chumlea et al.6); Eq. 4, 5, and 6 (Rabito et al.7).
Note: The limitations of the error bars correspond to the lower and upper limits of the 95% conidence interval for the mean diference.
10
5
0
‑5
‑10
95%CI
Eq.1 Eq.2 Eq.3 Eq.4 Eq.5 Eq.6
10
5
0
‑5
‑10
95%CI
60 to 69 years 70 to 79 years 80 years and more
10
5
0
‑5
‑10
95%CI
With mobility restriction Without mobility restriction
10
5
0
‑5
‑15 ‑10
95%CI
Male Female
Eq.1 Eq.2Eq.3Eq.4Eq.5Eq.6
Eq.1 Eq.2Eq.3Eq.4Eq.5Eq.6 Eq.1 Eq.2Eq.3Eq.4Eq.5Eq.6 Eq.1 Eq.2Eq.3Eq.4Eq.5Eq.6
Eq.1 Eq.2Eq.3Eq.4Eq.5Eq.6
Eq.1 Eq.2Eq.3Eq.4Eq.5Eq.6 Eq.1 Eq.2Eq.3Eq.4Eq.5Eq.6
In the analysis by age group, we found that the mean diferences observed with the use of the equations of Chumlea et al.6 (Equations 1 to 3) were greater as the age increased. Only
the equation of Chumlea et al.6 (Equation 2) did not have statistical diference for elderly
between 60 and 69 years. Among the equations of Rabito et al.,7 the Equation 5 showed the
lowest mean diference (Figure 1).
Regarding mobility restriction, a great mean diference was observed between the observed and estimated weights using the equations of Chumlea et al.6 (Equations 1 to 3). This mean
diference was higher in the individuals with mobility restrictions, with underestimation of 6.8 – 9.2 kg. The equations of Rabito et al.7 (Equations 4 to 6) showed high mean
dif-ference in the groups with and without mobility restriction. The equation of Rabito et al.7
(Equation 5) was the one that had the lowest mean diference, overestimating the weight in 2.2 kg (p < 0.05) for the elderly without mobility restriction and in 2.5 kg for the elderly with mobility restriction (p < 0.05) (Figure 1).
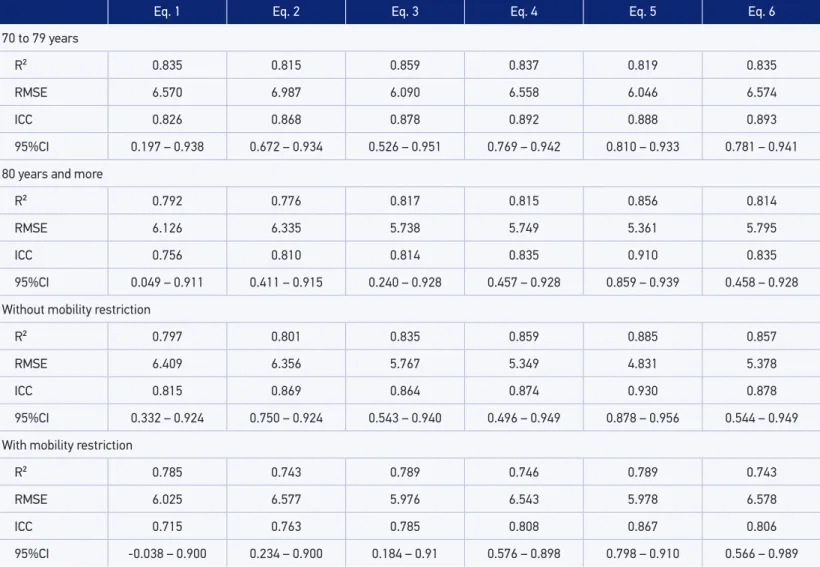
The concordance analysis enabled us to verify that the equation of Rabito et al.7
(Equation 5) was the one with the better applicability considering the entire population evaluated and also if stratifying by gender, age group, and mobility restriction. We stress that, for males, the equation of Chumlea et al.6 (Equation 3) and the equations of Rabito
et al.7 (Equations 5 and 6) satisied the applicability conditions. Among the elderly
partici-pants aged 60 – 69 years, the equation of Chumlea et al.6 (Equation 2) stood out (Table 2).
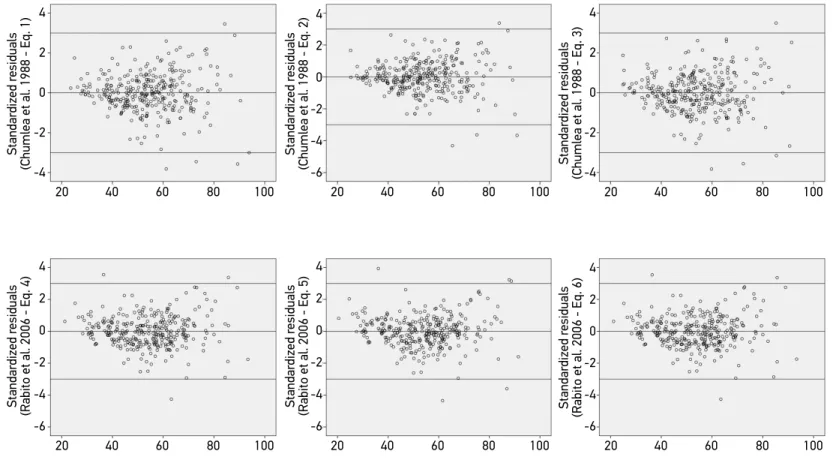
The normality of the residuals was only verified in the equation of Chumlea et al.6
(Equation 3) (p = 0.094). As for the graphical analysis, we observed that the graphics gener-ated by the methods of Chumlea et al.6 (Equations 1 to 3) were very similar to each other, and
the same happened with Rabito et al.7 (Equations 4 to 6). The equations of Chumlea et al.6
(Equations 1 to 3) had more outliers below -3 standard deviations (SD), while the equation of Rabito et al.7 (Equation 5) had more outliers above +3 SD. With the graphical analysis, it
was possible to observe an increase in the dispersion in an increasing manner in the Equations 1 to 3,6 indicating violation of the assumption of homogeneity of variance (Figure 2).
DISCUSSION
This study presented a census characteristic and is pioneer in comparing and validating weight estimation methods in elderly residents in nursing homes, in addition to presenting the ICCs between the most appropriate equations for estimating weight in this population.
The choice to use the equations of Rabito et al.7 (Equations 4 to 6) is justiied by the
Eq. 1 Eq. 2 Eq. 3 Eq. 4 Eq. 5 Eq. 6
Total
R² 0.816 0.801 0.837 0.826 0.854 0.823
RMSE 6.254 6.504 5.890 6.083 5.575 6.123
ICC 0.799 0.847 0.851 0.862 0.912 0.862
95%CI 0.154 – 0.925 0.598 – 0.924 0.423 – 0.939 0.600 – 0.934 0.866 – 0.940 0.612 – 0.934
Masculine
R² 0.733 0.731 0.824 0.815 0.819 0.815
RMSE 7.385 7.395 5.997 6.139 6.064 6.134
ICC 0.801 0.843 0.891 0.899 0.888 0.899
95%CI 0.505 – 0.904 0.747 – 0.902 0.803 – 0.937 0.843 – 0.935 0.810 – 0.933 0.844 – 0.935
Feminine
R² 0.823 0.801 0.832 0.850 0.856 0.848
RMSE 5.884 6.218 5.728 5.388 5.314 5.444
ICC 0.775 0.828 0.819 0.846 0.910 0.847
95%CI 0.025 – 0.922 0.428 – 0.925 0.188 – 0.933 0.379 – 0.938 0.859 – 0.939 0.384 – 0.939
60 to 69 years
R² 0.846 0.845 0.846 0.859 0.854 0.859
RMSE 5.829 5.865 5.845 5.580 4.826 5.573
ICC 0.887 0.918 0.907 0.886 0.912 0.893
95%CI 0.647 – 0.955 0.838 – 0.959 0.797 – 0.957 0.572 – 0.958 0.866 – 0.940 0.629 – 0.959
Table 2. Concordance analysis of the observed and estimated weights of the entire population of elderly residents in nursing homes for the elderly and stratiied by gender, age group, and mobility restrictions, Natal, Rio Grande do Norte, Brazil, 2014.
Table 2. Continuation.
Eq. 1 Eq. 2 Eq. 3 Eq. 4 Eq. 5 Eq. 6
70 to 79 years
R² 0.835 0.815 0.859 0.837 0.819 0.835
RMSE 6.570 6.987 6.090 6.558 6.046 6.574
ICC 0.826 0.868 0.878 0.892 0.888 0.893
95%CI 0.197 – 0.938 0.672 – 0.934 0.526 – 0.951 0.769 – 0.942 0.810 – 0.933 0.781 – 0.941
80 years and more
R² 0.792 0.776 0.817 0.815 0.856 0.814
RMSE 6.126 6.335 5.738 5.749 5.361 5.795
ICC 0.756 0.810 0.814 0.835 0.910 0.835
95%CI 0.049 – 0.911 0.411 – 0.915 0.240 – 0.928 0.457 – 0.928 0.859 – 0.939 0.458 – 0.928
Without mobility restriction
R² 0.797 0.801 0.835 0.859 0.885 0.857
RMSE 6.409 6.356 5.767 5.349 4.831 5.378
ICC 0.815 0.869 0.864 0.874 0.930 0.878
95%CI 0.332 – 0.924 0.750 – 0.924 0.543 – 0.940 0.496 – 0.949 0.878 – 0.956 0.544 – 0.949
With mobility restriction
R² 0.785 0.743 0.789 0.746 0.789 0.743
RMSE 6.025 6.577 5.976 6.543 5.978 6.578
ICC 0.715 0.763 0.785 0.808 0.867 0.806
95%CI ‑0.038 – 0.900 0.234 – 0.900 0.184 – 0.91 0.576 – 0.898 0.798 – 0.910 0.566 – 0.989
R²: coeicient of determination; RMSE: root mean square error; ICC: intra-class correlation coeicient; 95%CI: conidence interval of 95%.
Figure 2. Graphical analysis of the standardized residuals of the weight estimation equations, Natal, Rio Grande do Norte, Brazil, 2014.
4
2
0
‑2
‑4
20 40 60 80 100
Standar
dized r
esiduals
(Chumlea et al. 1988 ‑ Eq. 1)
4
2
0
‑2
‑4
20 40 60 80 100
Standar
dized r
esiduals
(Chumlea et al. 1988 ‑ Eq. 3)
4
2
0
‑2
‑6 ‑4
20 40 60 80 100
Standar
dized r
esiduals
(Chumlea et al. 1988 ‑ Eq. 2)
4
2
0
‑2
‑6 ‑4
20 40 60 80 100
Standar
dized r
esiduals
(Rabito et al. 2006 ‑ Eq. 5)
4
2
0
‑2
‑6 ‑4
20 40 60 80 100
Standar
dized r
esiduals
(Rabito et al. 2006 ‑ Eq. 4)
4
2
0
‑2
‑6 ‑4
20 40 60 80 100
Standar
dized r
esiduals
The qualitative analysis showed that the equations that did not use skinfold mea-surements showed greater reproducibility, since these are diicult to standardize. The classiication of TEM itself has diferent values among skinfolds and other anthropomet-ric measurements, with accepted TEM values for skinfolds being higher than those for other measurements9.
The practice of data collection enabled us to observe that the anthropometric measure-ments in the back of the body are diicult to take, due to the positioning of the elderly in the bed. Often, due to the fragile condition of the institutionalized elderly people, it is not possible to mobilize them to the adequate position for taking measurements. Therefore, a good estimation equation should prioritize anthropometric measurements that are easy to apply, and the equations that include measures of SS and WP should be left out or used when the elderly individual ofers conditions to measure them properly.
Regarding the quantitative assessment of weight estimation equations, we found that the equations proposed by Chumlea et al.6 (Equations 1 to 3) had lower mean values than
the observed weight, whereas the equations proposed by Rabito et al.7 (Equations 4 to 6)
had higher mean values. A study by Barcelo et al.10 evaluated the accuracy of the weight
estimated by the equation of Chumlea et al.6 (Equation 3) with the observed weight in
Spanish elderly hospitalized people that had a mean age of 83.6 ± 6.6 years and that could stand. They observed that the equation of Chumlea et al.6 (Equation 3) underestimated the
weight as 7.4 kg, a higher value than the one observed in the present study.
A validation study carried out with hospitalized patients showed good concordance between observed and estimated weights, using the equations of Rabito et al.7. A survey
carried out with 30 Brazilian elderly women11 evaluated the equation of Chumlea et al.6
(Equation 3). The authors did not observe a signiicant diference and indicated this equa-tion for estimating the weight in the elderly, although they recognize the interference of sample size and analysis of one gender as a limitation of the study. The same result was found by Sampaio et al.12.
The concordance analysis showed that the equation of Rabito et al.7 (Equation 5) had
better applicability considering the entire population and the strata (gender, age and mobil-ity restrictions). We observed that, for the elderly women, of 80 years old or more and with mobility restrictions, the other analyzed equations lost precision, with their applicability being questionable in these groups. It is worth noting that these groups had higher mean diference between observed and estimated weights. Similar results observed showed that these groups constituted the same individuals, considering the elderly women are the most long-lived and, hence, the ones that have greater mobility restrictions, due to the intensii-cation of the physical and functional decline after 80 years of age13.
This result can be attributed to the characteristics of the population from which the equations were developed. The study of Chumlea et al.6 was developed from a sample of
healthy elderly people and that had no mobility restriction. The study by Rabito et al.7
restriction, the ones of Rabito et al.7 (Equations 4 to 6) were developed with elderly people
between 60 and 66 years, an age group that does not include much of the institutionalized elderly. Despite the diferences between the populations evaluated in these studies, the equation of Rabito et al.7 (Equation 5) is the most applicable for estimating the weight in
institutionalized elderly, due to the hospitalization conditions comparable to institutional-ization in the reality of the studied NH14.
Only the residuals from the equation of Chumlea et al.6 (Equation 3) presented
adherence to the normal distribution. However, the differences observed in this equa-tion and the other ones of Chumlea et al.6 showed increasing dispersion, indicating that
as higher the individual’s weight, as greater is the error of the equation. In turn, the Rabito et al.7 equations (Equations 4 to 6) exhibited homoscedasticity and, thus, there
is no relationship between the error and weight of the individual. As this is a heteroge-neous population, with as deficits as excesses in body weight, the equations of Rabito et al.7 (Equations 4 to 6) provide more accurate estimates, independently of the
anthro-pometric nutritional status.
Proper assessment of weight is essential, since it is a basic measure, which is part of the evaluation of NS indicators, such as BMI and mini nutritional assessment (MNA). The use of a non-applicable estimation method can lead to systematic measurement errors. We stress also that the monitoring of malnutrition is mandatory in NH in Brazil. The body weight is one of the indicators used to detect malnutrition15, as isolated (%
weight loss), as in a composition of indexes or scores of anthropometric nutritional sta-tus. In the clinical practice, such errors can result in inadequate dietetics and/or drug interventions. In turn, these inadequacies can increase the nutritional risk and morbi-mor-tality. In the public health practice or in epidemiological studies, estimates from methods not validated for the study population can lead to the inadequate assessment of the stud-ied population proile, causing misleading results and planning of health actions. When there is no validated method for the studied population, it is preferable not to estimate the weight and/or height than to estimate those using questionable methods. Thus, the use of the other indicators, such as perimeters and/or skinfolds, provides more reliable information about the nutritional status.
CONCLUSION
The equation of Rabito et al.7 (Equation 5) was the one with best applicability for
1. Gonçalves LHT, Silva AH, Mazo GZ, Benedetti TRB, Santos SMA, Marques S, et al. O idoso institucionalizado: avaliação da capacidade funcional e aptidão física. Cad Saúde Pública 2010; 26(9): 1738-46.
2. Acuña K, Cruz T. Avaliação do estado nutricional de adultos e idosos e situação nutricional da população brasileira. Arq Bras Endocrinol Metab 2004; 48(3): 345-61.
3. Silva JR, Santos VR, Batista VC, Cardoso MR, Oliveira D, Codogno JS, et al. Fragilidade e composição corporal de mulheres adultas e idosas usuárias do sistema público de saúde do município de Presidente Prudente, SP. Cad Educ Saúde Fisioter 2014; 1(1): 42-43.
4. Tribess S, Oliveira RJ. Síndrome da fragilidade biológica em idosos: revisão sistemática. Revista de Salud Pública 2011; 13(5): 853-64.
5. Monteiro RSC, Cunha TRL, Santos MEN, Mendonça SS. Estimativa de peso, estatura e índice de massa corporal em adultos e idosos americanos: revisão. Com Ciências Saúde 2009; 20(4): 341-50.
6. Chumlea WC, Guo S, Roche AF, Steinbaugh ML. Prediction of body weight for the nonambulatory elderly from anthropometry. J Am Diet Assoc 1988; 88(5): 564-8.
7. Rabito EI, Mialich MS, Martínez EZ, García RWD, Jordão Junior AA, Marchini JS. Validation of predictive equations for weight and height using a metric tape. Nutr Hosp 2008; 23(6): 614-8.
8. Pederson D, Gore C. Er ror en la medición antropométrica. In: Norton K, Olds T, editors.
Antropométrica. Argentina: Biosystem Servicio Educativo; 2000. p. 71-86.
9. Perini TA, Oliveira GL, Ornellas JS, Oliveira FP. Cálculo do erro técnico de medição em antropometria. Rev Bras Med Esporte 2005; 11(1): 81-5.
10. Barceló M, Torres O, Mascaró J, Francia E, Cardona D, Ruiz D. Assessing nutritional status in the elderly evaluation of Chumlea equations for weight. Nutr Hosp 2013; 28(2): 314-8.
11. Oliveira L, Fernandes Filho, J. Height and corporal mass measured and predicted through the Chumlea equations in elderly. Fit Perf J 2007; 6(3): 152-5.
12. Sampaio HAC, Melo MLP, Almeida PC, Benevides ABP. Aplicabilidade das fórmulas de estimativa de peso e estatura para idosos e adultos. Rev Bras Nutr Clin 2002; 17(4): 117-21.
13. Adell CB, Fayrén JG. Coniguración demográica del município de Murcia. Pap Geogr 1998; 27: 67-80.
14. Gorzoni ML, Pires SL. Idosos asilados em hospitais gerais. Rev Saúde Pública 2006; 40(6): 1124-30.
15. Agência Nacional de Vigilância Sanitária. Resolução RDC nº 283, de 26 de setembro de 2005. Aprova o Regulamento Técnico que define normas de funcionamento para as Instituições de Longa Permanência para Idosos Brasília: Diário Oicial da União; 2005.
Received on: 12/18/2014
Final version presented on: 09/01/2015 Accepted on: 06/15/2015