original article
Licence Creative Commom
CC BY
RBCDH
1 Universidade Federal do Acre. Departamento de Ciências da Saúde. Rio Branco, AC. Brasil. 2 Universidade da Integração Internacional da Lusofonia Afro--Brasileira. Instituto de Ciências Sociais Aplicadas. Redenção, CE. Brasil.
3 Universidade Federal de Mato Grosso. Departamento de Saúde Coletiva. Cuiabá, MT. Brasil. 4 Universidade Federal da Paraíba. Departamento de Educação Física. João Pessoa, PB. Brasil.
Received: 18 May 2013 Accepted: 14 February 2014
Prevalence of and factors associated with
overweight among university students
from Rio Branco, Acre – Brazil
Prevalência e fatores associados ao excesso de peso em
universitários do município de Rio Branco, Acre - Brasil
Gustavo de Souza Moretti1
Pascoal Torres Muniz1
Carlos Mendes Tavares2
Gisela Soares Brunken3
José Cazuza de Farias Júnior4
Edson dos Santos Farias1
Abstract – he aim of this study was to determine the prevalence of and factors associ-ated with overweight among university students from the city of Rio Branco, Acre, Brazil. A cross-sectional study was conducted on 1,104 students (mean age: 24 years) from Rio Branco, Acre. Overweight was used as the dependent variable. he following independent variables were studied: socioeconomic variables (gender, age, teaching institution, period of study, marital status, income, household members, living with other people, parent’s education level, and working or not); self-reported health and morbidity variables (health perception, hypertension, diabetes, and altered cholesterol); lifestyle variables (physical activity, watching television, computer use, smoking, and alcohol consumption). he nutritional status was classiied based on body mass index. Univariate analysis was per-formed using Pearson’s chi-squared test or Fisher’s exact test. Variables with a p value < 20% on univariate analysis were included in the multiple Poisson regression model. he prevalence of overweight was 35.6%. In the multiple regression model for male students adjusted for age, overweight was associated with marital status, household income, hypertension, and watching television every day. In the model for female students, the variables that remained associated were self-perceived health status, hypertension, and alcohol consumption in the last month. Overweight is determined by a combination of diferent factors which difered in the present study between men and women.
Key words: Body mass index; Obesity; Overweight; Prevalence; University students.
INTRODUCTION
Several factors are associated with the development of overweight, including
genetic, physiological and metabolic factors1. However, lifestyle changes
such as a reduction in physical activity levels and an increase in the time spent in sedentary behaviors, in the consumption of simple carbohydrates, high-fat foods and sot drinks and in food portion size explain the
increas-ing number of overweight adults2.
Overweight is associated with diferent chronic diseases such as type 2 diabetes mellitus, cardiovascular diseases, hypertension, dyslipidemia,
metabolic syndrome, osteoarthritis, insulin resistance3, psychosocial
problems (stress, depression, anxiety, and low self-esteem), decreased
academic and professional performance, and low overall quality of life4.
In view of the associated health problems and the low success rate of treat-ment of this important condition, as well as the health expenditures with hospitalizations, medications and surgeries, overweight is now a leading public health problem.
Studies have shown a high and increasing prevalence of overweight
among university students5,6. National surveys on overweight among
adults indicate that this prevalence has more than doubled over 35 years7.
Similar results have been reported for adults from other countries where
this increase is even greater8,9.
College life is a critical period in terms of overweight since it is generally accompanied by a reduction in physical activity levels, increased stress, and the adoption of unhealthy eating habits such as increased consumption of sot drinks, sweets, fried and processed foods and skipping meals, factors
that favor an increase in the amount of body fat10. herefore, assessment
of the nutritional status of university students has been recommended in order to identify subgroups that are at risk of being overweight and factors associated with this outcome. In this respect, the objective of the present study was to evaluate the prevalence of and factors associated with over-weight among university students from Rio Branco, Acre, Brazil.
METHODOLOGICAL PROCEDURES
A cross-sectional study was conducted in the city of Rio Branco, Acre, Brazil, between May and September 2011, which involved university stu-dents of both genders from three higher education institutions of the city, including one public and two private institutions.
For calculation of the sample size, a prevalence of overweight of 46.9%11,
an estimated maximum sampling error of 3% and a 95% conidence inter-val were adopted, resulting in a sample of 986 students. he sample size was increased by 14% to account for possible losses and refusals. he inal sample consisted of 1,125 university students.
one class per course was randomly selected at each institution participating in the study. Finally, all students of the selected classes who were present on the day of application of the questionnaire were invited to participate in the study. Students younger than 18 years, subjects with some disability impairing the measurement, and pregnant students were excluded.
he data were collected by a trained team consisting of teachers from the physiotherapy, physical education, nutrition and medicine courses using the protocol for anthropometric measurement of the Food and Nutritional Surveillance System (Sistema de Vigilância Alimentar e Nutricional –
SIS-VAN)12. Ater receiving detailed information about the objectives of the
study and signing the free informed consent form, the students received the questionnaire and instructions on how to ill it out. Next, the body weight and height of the participants were measured.
he instrument used in this study was an individual self-completion questionnaire elaborated based on the Telephone-based Surveillance of Risk and Protective Factors for Chronic Diseases (Vigilância de Fatores de Risco e Proteção para Doenças Crônicas por Inquérito Telefônico -
VIGI-TEL)13 and the International Physical Activity Questionnaire (IPAQ)14. he
questionnaire was divided into modules containing the following sections: socioeconomic data; evaluation of individual health status; lifestyle assess-ment, and evaluation of nutritional status.
Body weight and height were measured in duplicate by the same exam-iner and the mean of the two measurements was used for analysis. Body weight was measured with a Tanita UM080 electronic scale (capacity of 130 kg) to the nearest 100 g, and height was measured in millimeter with a Seca portable stadiometer. A body mass index (BMI) ≥ 25 kg/m² was deined as
overweight according to World Health Organization recommendations15.
he following socioeconomic variables were studied: gender (male or female), age (divided into three strata: < 20 years, 20 to 29 years, or ≥ 30 years), institution (public or private), period of study (morning, aternoon, night, or full-time), marital status (single, stable union or married, or wid-owed, separated or divorced), household income in minimal wages (MW) (< 3 MW, 3 to 10 MW, or > 10 MW), household members (1 person, 2 to 5 persons, or 6 or more persons), with whom the respondent lives (father, mother or both, spouse, or alone/others), parent’s education level (stratiied into the following categories: 0 to 8 years of schooling, 9 to 11 years, or 12 or more years), and whether the respondent works (yes or no).
For health status assessment, the participants were asked about health perception (very good or good, regular, and poor or very poor), hyperten-sion (yes or no), diabetes (yes or no), and altered cholesterol (yes or no).
smoking (Do you smoke? Response options: yes; yes, occasionally, and no), and alcohol consumption (Do you usually drink alcoholic beverages? Response options: yes or no).
Proportions were calculated for descriptive analysis. Diferences in proportions between the overweight and non-overweight groups were compared individually for each factor using Pearson’s chi-squared test or Fisher’s exact test.
Variables presenting a p value < 20% on univariate analysis were in-cluded in the Poisson multiple regression model adjusted by robust estima-tion of variance. During this phase, the data were analyzed hierarchically: behavioral or lifestyle variables at the proximal level (physical activity, television, computer, smoking, and alcohol), health-related variables at the intermediate level (health perception, hypertension, diabetes, and altered cholesterol), and socioeconomic variables at the distal level (gender, age, institution, period of study, marital status, income, household member, with whom the respondent lives, father’s and mother’s education level, and working or not). he exhibiting variables that presented a p value < 5% or adjusted the prevalence ratios by at least 10% were maintained in the multiple models. hus, the exhibiting variable was considered to be as-sociated with the outcome when it remained in the inal multiple model at a level of signiicance of 5% by the Wald test. he Microsot Oice Access 2007 program was used for construction of the database and the STATA/ SE 11.0 program for data analysis.
he participants received detailed information about the risks and beneits of the study and provided free informed consent before the begin-ning of the study. he methodological procedures were approved by the Research Ethics Committee of the Federal University of Acre (Permit No. 23107.004753/2011-62).
RESULTS
he inal sample consisted of 1,104 students, with losses accounting for 1.5% of cases (pregnant women, students with disabilities, incorrect response to the questionnaire, and lack of weight and height measurements). he mean age was 24 years (± 7.2); 42.6% of the students were men and 57.4% were women.
Most students were in the age group of 20 to 29 years, were enrolled in a private institution, studied at night, were single, had a household income of 3 to 10 MW, and lived with 2 to 5 household members and with the parents who had up to 8 years of schooling. he health perception of the students was good or very good and none of them reported hypertension, diabetes or altered cholesterol. he students were active or very active, watched television every day, used the computer every day, did not smoke, and had not consumed alcohol in the last month.
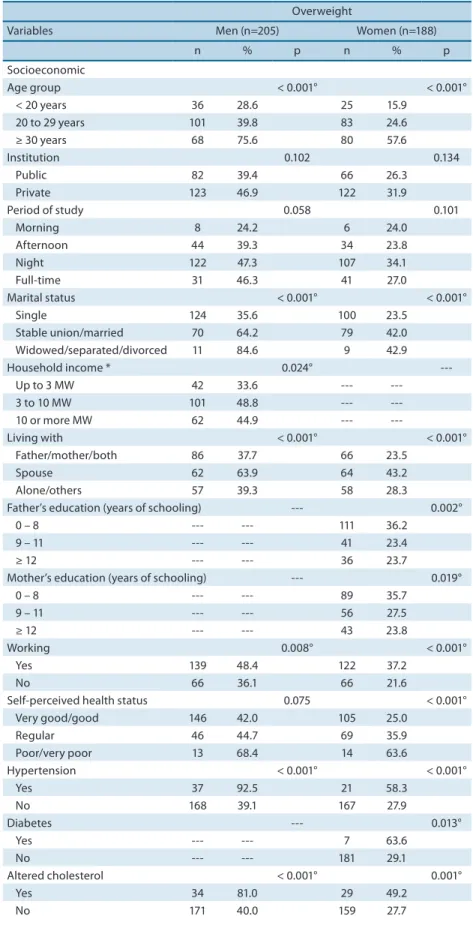
Table 1. Distribution of university students according to overweight (BMI), gender and possible associated variables (Rio Branco - Acre, Brazil, 2011).
Overweight
Variables Men (n=205) Women (n=188)
n % p n % p
Socioeconomic
Age group < 0.001° < 0.001° < 20 years 36 28.6 25 15.9
20 to 29 years 101 39.8 83 24.6 ≥ 30 years 68 75.6 80 57.6
Institution 0.102 0.134
Public 82 39.4 66 26.3
Private 123 46.9 122 31.9
Period of study 0.058 0.101
Morning 8 24.2 6 24.0
Afternoon 44 39.3 34 23.8 Night 122 47.3 107 34.1 Full-time 31 46.3 41 27.0
Marital status < 0.001° < 0.001° Single 124 35.6 100 23.5
Stable union/married 70 64.2 79 42.0 Widowed/separated/divorced 11 84.6 9 42.9 Household income * 0.024°
---Up to 3 MW 42 33.6 --- ---3 to 10 MW 101 48.8 --- ---10 or more MW 62 44.9 ---
---Living with < 0.001° < 0.001° Father/mother/both 86 37.7 66 23.5
Spouse 62 63.9 64 43.2
Alone/others 57 39.3 58 28.3
Father’s education (years of schooling) --- 0.002°
0 – 8 --- --- 111 36.2
9 – 11 --- --- 41 23.4
≥ 12 --- --- 36 23.7
Mother’s education (years of schooling) --- 0.019°
0 – 8 --- --- 89 35.7
9 – 11 --- --- 56 27.5
≥ 12 --- --- 43 23.8
Working 0.008° < 0.001°
Yes 139 48.4 122 37.2
No 66 36.1 66 21.6
Self-perceived health status 0.075 < 0.001° Very good/good 146 42.0 105 25.0
Regular 46 44.7 69 35.9 Poor/very poor 13 68.4 14 63.6
Hypertension < 0.001° < 0.001°
Yes 37 92.5 21 58.3
No 168 39.1 167 27.9
Diabetes --- 0.013°
Yes --- --- 7 63.6
No --- --- 181 29.1
Altered cholesterol < 0.001° 0.001°
Yes 34 81.0 29 49.2
No 171 40.0 159 27.7
Overweight
Variables Men (n=205) Women (n=188)
n % p n % p
Lifestyle
Physical activity classiication 0.058 ---Inactive/irregularly active 92 48.9 --- ---Active/very active 113 40.1 --- ---Watching TV every day 0.058
---Yes 133 47.2 ---
---No 72 38.3 ---
---Computer use every day --- 0.158
Yes --- --- 123 28.0
No --- --- 65 33.5
Smoking 0.171 0.066
Yes 23 53.5 17 42.5
No 182 42.6 171 28.8
Alcohol consumption in the last month 0.079 0.059
Yes 101 48.1 82 34.0
No 104 40.0 106 27.0
* Income reported as Brazilian minimum wage (MW) in 2011: R$ 545.00. ° p < 0.05 (Pearson’s chi-squared test or Fisher’s exact test). Covariates that did not show a p value < 0.20 on univariate analysis are not reported in the table. Male students: household members, parent’s education level, self-reported diabetes, and computer use every day. Female students: family income, household members, physical activity classiication, and watching television every day.
he variables associated with overweight in male students were age, marital status, household income, with whom the respondent lives, working or not, self-reported hypertension, and self-reported altered cholesterol. For female students, the variables associated with overweight were age, marital status, with whom the respondent lives, parent’s education level, working or not, self-reported health perception, and self-reported hypertension, diabetes and altered cholesterol.
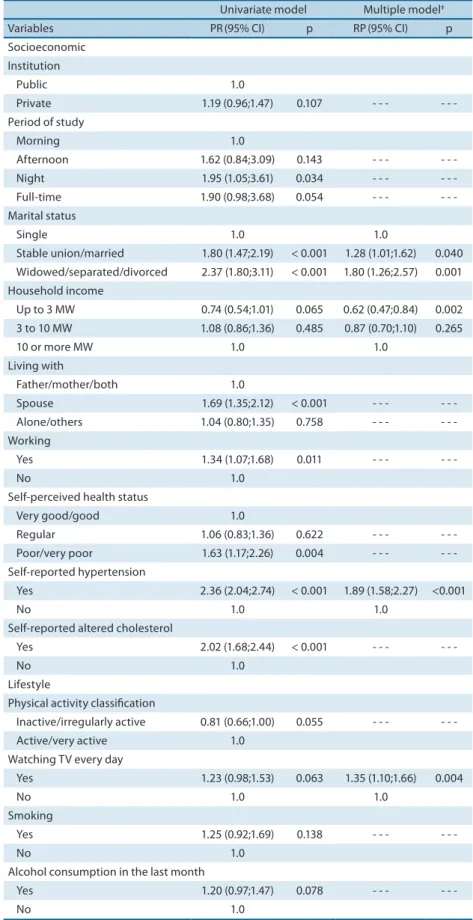
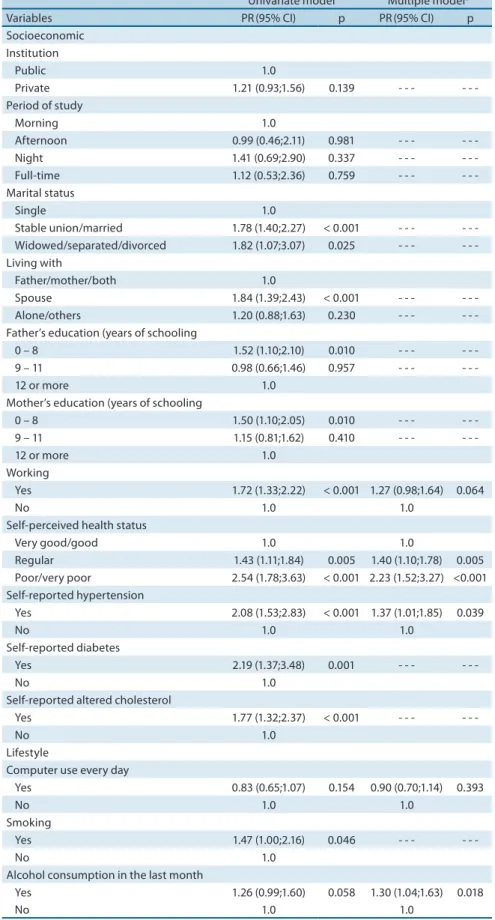
For male students, the following factors continued to be associated with overweight in the crude multiple model and in the model adjusted for age: being married or in a stable union, being widowed or separated or divorced, having a household income of up to 3 MW, being hypertensive, and watching television every day. A household income of up to 3 MW was negatively associated with overweight. For female students, the vari-ables that continued to be associated with overweight in the crude multiple model and in the age-adjusted model were: having a regular, poor or very poor health perception, being hypertensive, and having consumed alcohol in the last month (Tables 2 and 3).
Table 2. Poisson regression estimates for overweight among male students from the city of Rio Branco, Acre, Brazil (2011).
Univariate model Multiple model‡
Variables PR(95% CI) p RP(95% CI) p Socioeconomic
Institution
Public 1.0
Private 1.19 (0.96;1.47) 0.107 - - - -Period of study
Morning 1.0
Afternoon 1.62 (0.84;3.09) 0.143 - - - -Night 1.95 (1.05;3.61) 0.034 - - - -Full-time 1.90 (0.98;3.68) 0.054 - - - -Marital status
Single 1.0 1.0
Stable union/married 1.80 (1.47;2.19) < 0.001 1.28 (1.01;1.62) 0.040 Widowed/separated/divorced 2.37 (1.80;3.11) < 0.001 1.80 (1.26;2.57) 0.001 Household income
Up to 3 MW 0.74 (0.54;1.01) 0.065 0.62 (0.47;0.84) 0.002 3 to 10 MW 1.08 (0.86;1.36) 0.485 0.87 (0.70;1.10) 0.265
10 or more MW 1.0 1.0
Living with
Father/mother/both 1.0
Spouse 1.69 (1.35;2.12) < 0.001 - - - -Alone/others 1.04 (0.80;1.35) 0.758 - - - -Working
Yes 1.34 (1.07;1.68) 0.011 - - -
-No 1.0
Self-perceived health status
Very good/good 1.0
Regular 1.06 (0.83;1.36) 0.622 - - - -Poor/very poor 1.63 (1.17;2.26) 0.004 - - - -Self-reported hypertension
Yes 2.36 (2.04;2.74) < 0.001 1.89 (1.58;2.27) <0.001
No 1.0 1.0
Self-reported altered cholesterol
Yes 2.02 (1.68;2.44) < 0.001 - - -
-No 1.0
Lifestyle
Physical activity classiication
Inactive/irregularly active 0.81 (0.66;1.00) 0.055 - - - -Active/very active 1.0
Watching TV every day
Yes 1.23 (0.98;1.53) 0.063 1.35 (1.10;1.66) 0.004
No 1.0 1.0
Smoking
Yes 1.25 (0.92;1.69) 0.138 - - -
-No 1.0
Alcohol consumption in the last month
Yes 1.20 (0.97;1.47) 0.078 - - -
-No 1.0
Exclusion of all covariates with p > 20% in Table 1 (household members, parent’s education level, computer use
every day, and self-reported diabetes). ‡ Model adjusted for age. PR: prevalence ratio; 95% CI: 95% conidence
Table 3. Poisson regression estimates for overweight among female students from the city of Rio Branco, Acre, Brazil (2011).
Univariate model Multiple model‡
Variables PR(95% CI) p PR(95% CI) p Socioeconomic
Institution
Public 1.0
Private 1.21 (0.93;1.56) 0.139 - - - -Period of study
Morning 1.0
Afternoon 0.99 (0.46;2.11) 0.981 - - - -Night 1.41 (0.69;2.90) 0.337 - - - -Full-time 1.12 (0.53;2.36) 0.759 - - - -Marital status
Single 1.0
Stable union/married 1.78 (1.40;2.27) < 0.001 - - - -Widowed/separated/divorced 1.82 (1.07;3.07) 0.025 - - - -Living with
Father/mother/both 1.0
Spouse 1.84 (1.39;2.43) < 0.001 - - - -Alone/others 1.20 (0.88;1.63) 0.230 - - - -Father’s education (years of schooling
0 – 8 1.52 (1.10;2.10) 0.010 - - - -9 – 11 0.98 (0.66;1.46) 0.957 - - -
-12 or more 1.0
Mother’s education (years of schooling
0 – 8 1.50 (1.10;2.05) 0.010 - - - -9 – 11 1.15 (0.81;1.62) 0.410 - - -
-12 or more 1.0
Working
Yes 1.72 (1.33;2.22) < 0.001 1.27 (0.98;1.64) 0.064
No 1.0 1.0
Self-perceived health status
Very good/good 1.0 1.0
Regular 1.43 (1.11;1.84) 0.005 1.40 (1.10;1.78) 0.005 Poor/very poor 2.54 (1.78;3.63) < 0.001 2.23 (1.52;3.27) <0.001 Self-reported hypertension
Yes 2.08 (1.53;2.83) < 0.001 1.37 (1.01;1.85) 0.039
No 1.0 1.0
Self-reported diabetes
Yes 2.19 (1.37;3.48) 0.001 - - -
-No 1.0
Self-reported altered cholesterol
Yes 1.77 (1.32;2.37) < 0.001 - - -
-No 1.0
Lifestyle
Computer use every day
Yes 0.83 (0.65;1.07) 0.154 0.90 (0.70;1.14) 0.393
No 1.0 1.0
Smoking
Yes 1.47 (1.00;2.16) 0.046 - - -
-No 1.0
Alcohol consumption in the last month
Yes 1.26 (0.99;1.60) 0.058 1.30 (1.04;1.63) 0.018
No 1.0 1.0
Exclusion of all covariates with p > 20% in Table 1 (household income, household members, physical activity
classiication, and watching TV every day). ‡Model adjusted for age. PR: prevalence ratio; 95% CI: 95% conidence
DISCUSSION
he present study found a high prevalence of overweight (35.6%) among
university students. As reported in other studies9,10,13, the prevalence of
overweight was higher among male students than female students (43.6% versus 29.7%). his higher prevalence of overweight among men might be explained by the greater care of women with body esthetics, valuing a slim and it body in order to meet beauty standards.
he prevalence of overweight observed in this study was higher than that reported in a population-based survey conducted in Rio Branco in
2008, in which 23.6% of adults aged 18 to 24 years were overweight11, and
in the 2011 VIGITEL survey comprising 26 Brazilian capitals and the Distrito Federal, in which the prevalence was 27.3% among adults aged 18 to 24 years from the city of Rio Branco, Acre. Diferences in the preva-lence of overweight between studies can be explained by diferences in the composition of the sample (adult population in the population-based survey) and by methodological diferences (self-reported measures in the VIGITEL survey). However, the proportion of overweight students was high in the present study. his inding is a matter of concern since excess weight is associated with a variety of health problems, is diicult to reverse
(persisting throughout life), and is associated with high treatment costs16.
he prevalence ratios of overweight were higher among married stu-dents or those living in a stable union, as well as among widowed, separated or divorced students, when compared to singles. Similar results have been
reported in studies conducted in other countries17,18. Silva et al.2 suggested
this inding to be related to the adoption of new lifestyle habits ater mar-riage, such as a reduction in physical activity levels and dietary changes. In addition, this higher prevalence may also be related to age. It is natural that individuals gain weight with increasing age as a result of a decrease in
basal metabolic rates and physical activity levels. However, Oliveira et al.19
found no association between overweight and marital status in an adult population from Salvador.
A household income of up to 3 MW was inversely associated with over-weight in male students. A study conducted in Rio Branco demonstrated an increasing linear trend in the percentage of overweight adults with
increasing household income11. Suleiman et al.20 found a higher prevalence
of overweight among low-income university students compared to high-income students. hese data agree with the inverse relationship between overweight and income in developed countries proposed by Ljungvall and
Zimmerman21. In Brazil, this relationship is diferent due to the period of
transition during which income tends to be a risk factor for an increasing prevalence of overweight, characterized by changes in the patterns of con-sumption of the population. his pattern has been demonstrated among men, but not among women.
among female students. According to Burton et al.22, overweight tends
to increase with age. Economos et al.23 suggested this increase to be more
accelerated in men and slower in women, with the observation of higher prevalences among younger male students and among older female students.
he present study showed that male students watching television every day of the week had a 35% higher chance of being overweight than those who did not. Although the results of cross-sectional studies associating the time spent watching television with indicators of overweight and obe-sity are controversial, spending excessive time in sedentary behavior may contribute both directly and indirectly to overweight. Directly, the time spent in sedentary behaviors reduces physical activity levels and favors an
increase in the consumption of high energy density foods24,25. Indirectly,
excessive television watching increases the exposure to advertisements that encourage the consumption of high-calorie foods of low nutritional
value25. Taken together, these factors contribute to increase the positive
energy balance and, consequently, body weight.
In the present study, female students with a negative perception of health (regular, poor, very poor) had a higher chance of being overweight. Similar results have been reported in other studies demonstrating a higher frequency of negative health perception among overweight and obese
individuals compared to their non-obese or non-overweight peers11,26.
Self-perceived health status has been used in epidemiological studies for health status assessment of adults and is an important health indicator of
populations27. Taken together, these results suggest that individuals with
excess weight perceive this condition to be afecting their health status. Overweight university students were more likely to develop arterial
hypertension. Similar results have been reported in other studies23,28 which
showed that overweight is associated with systemic arterial hypertension. hese results indicate the need for continuous prevention and education programs as well as activities designed to promote a more active lifestyle among university students based on regular physical activity and the adop-tion of healthy eating habits.
he prevalence ratios of overweight in female students were higher among those reporting the consumption of alcohol in the last month compared to those who did not. Diferent results have been reported by
Mataix et al.29 who observed a higher prevalence of overweight among
women who did not consume alcohol.
he role of alcohol in the mechanism underlying the development of overweight is unclear, mainly because of diferences in the methods used to determine the frequency and quantity of alcohol consumed. he responses to alcohol vary depending on individual characteristics and the same trend is observed for weight gain related to alcohol consumption. Furthermore, the method selected for the evaluation of alcohol consumption in the pre-sent study (consumption in the last 30 days) is likely to be a limiting factor for analysis of the association with overweight, especially because this
One limitation of this study is its cross-sectional design which does not permit to determine whether the association found is causal; thus, reverse causality cannot be excluded. he strengths of the study include the small percentage of losses and refusals, the use of a representative and probability sample of university students, and the fact that the students were recruited from public and private institutions.
CONCLUSION
he prevalence of overweight was high, especially among male students older than 30 years, who were married or in a stable union, had a house-hold income of 3 to 10 MW, and worked. Overweight was associated with marital status, household income, hypertension and watching television every day in men, and with health perception, hypertension and alcohol consumption in the last month in women. It can be concluded that over-weight is determined by a combination of diferent factors which difered in the present study between men and women. hese results highlight the need of intervention programs for this important public health problem.
Acknowedlegements
We acknowledge the inancial support of Conselho Nacional de Desen-volvimento Cientíico e Tecnológico (CNPq, Edital Casadinho UFAC-FIOCRUZ, Grant 620024/2008-9) and Coordenação de Aperfeiçoamento de Pessoal de Nível Superior (CAPES, Grants PROCAD-NF 1442/2007 and PROCAD-NF 2557/2008).
REFERENCES
1. Simony RS, Gimeno SGA, Ferreira SRG, Franco LJ. Prevalência de sobrepeso e obesidade em nipo-brasileiros: comparação entre sexos e geração. Rev Nutr 2008;21:169-76.
2. Silva DAS, Quadros TMB, Gordia AP, Petroski EL. Association of overweight with socio-demographic variables and lifestyle among Brazilian university students. Ciênc Saúde Colet 2011;16:4473-9.
3. Owen CG, Whincup PH, Cook DG. Breast-feeding and cardiovascular risk factors and outcomes in later life: evidence from epidemiological studies. Proc Nutr Soc 2011;70:478-84.
4. Hopman WM, Berger C, Lawrence J, Barr SI, Gao Y, Prior JC, et al. he association between body mass index and health-related quality of life: data from CaMos, a stratified population study. Qual Life Res 2007;16:1595-603.
5. Silva DAS, Petroski EL. Fatores associados ao nível de participação em atividades físicas em estudantes de uma universidade pública no sul do Brasil. Ciênc Saúde Colet 2011;16:4087-94.
6. Alcala HG, Ramos DC, Tamborero CG, Tamez OH, Valdes PA, Mehta R, Salinas CA. Signiicant increment in the prevalence of overweight and obesity documented between 1994 and 2008 in Mexican college students. Diabetes Metab Syndr Obes 2010; 3:79-85.
8. Flegal KM, Carrol MD, Kit BK, Ogden GL. Prevalence and trends in the distribution of body mass index among US adults, 1999 - 2010. JAMA 2012;307:491-7. 9. Xi B, Liang Y, He T, Reilly KH, Hu Y, Wang Q, Yan Y, Mi J. Secular trends in the
prevalence of general and abdominal obesity among Chinese adults, 1993-2009. Obes Rev 2012;13(3):287-96.
10. Ramalho AA, Dalamaria T, Souza OF. Consumo regular de frutas e hortaliças por estudantes universitários em Rio Branco, Acre, Brasil: prevalência e fatores associados. Cad Saúde Pública 2012;28(7):1405-13.
11. Lino MZR, Muniz PT, Siqueira KS. Prevalência e fatores associados ao excesso de peso em adultos: Inquérito populacional em Rio Branco, Acre, Brasil, 2007-2008. Cad Saúde Publica 2011;27:797-810.
12. BRASIL. Ministério da Saúde. Secretaria de Atenção a Saúde. Departamento de Atenção Básica. Orientações para a coleta e análise de dados antropométricos em serviços de saúde: Norma Técnica do Sistema de Vigilância Alimentar e Nutricional – SISVAN / Ministério da Saúde, Secretaria de Atenção à Saúde, Departamento de Atenção Básica. – Brasília: Ministério da Saúde, 2011.
13. Departamento de Análise de Situação de Saúde, Secretaria de Vigilância em Saúde, Ministério da Saúde. Vigilância de Fatores de Risco e Proteção para Doenças Crônicas por Inquérito Telefônico, Vigitel 2009. Brasília: Ministério da Saúde; 2010. 14. Matsudo SM, Araújo TL, Matsudo VKR, Andrade DR, Andrade EL, Oliveira LC,
et al. Questionário Internacional de Atividade Física (IPAQ): estudo de validade e reprodutibilidade no Brasil. Rev Bras Ativ Saude 2001;10:5-18.
15. World Health Organization. Diet, Nutrition and the prevention of chronic diseases. Geneva: WHO; 2003.
16. Bahia L, Cotinho ESF, Barufaldi LA, Abreu GA, Malhão TA, Souza CPR, Araujo DV. he costs of overweight and obesity-related diseases in the Brazilian public health system: cross-sectional study. BMC Public Health 2012;12:440.
17. Janghorbani M, Amini M, Rezvanian H, Gouya MM, Delavari A, Alikhani S, Mahdavi A. Association of body mass index and abdominal obesity with marital status in adults. Arch Iran Med 2008; 11:274-81.
18. Sobal J, Hanson KL, Frongill EA. Gender, ethnicity, marital status, and body weight in the United States. Obesity 2009;17:2223-31.
19. Oliveira LPM, Assis AMO, Silva MCM, Santana MLP, Santos NS, Pinheiro SMC, Barreto ML Souza CO. Fatores associados a excesso de peso e concentração de gordura abdominal em adultos na cidade de Salvador, Bahia, Brasil. Cad Saúde Públ 2009; 25:570-82.
20. Suleiman AA, Albogai OK, Yasein N, El Qudah JM, Bataineh MF, Obeidat BA. Prevalence of and factors associated with overweight and obesity among Jordan university students. J Biol Sci 2009;9:738-45.
21. Ljungvall A, Zimmerman FJ. Bigger bodies: long-term trends and disparities in obesity and body-mass index among U.S. adults, 1960-2008. Soc Sci Med 2012; 75:109-19. Soc Sci Med 2012; 75(1):109-19.
22. Burton AM, Agne AA, Lehr SM, Davis NJ, Willett LL, Cherrington AL. Training residents in obesity counseling: incorporating principles of motivational interview-ing to enhance patient centeredness. J Grad Med Educ 2011;3:408-11.
23. Economos CD, Hildebrandt ML, Hyatt RR. College freshman stress and weight change: diferences by gender. Am J Health Behav 2008;32:16-25.
24. Boulos R, Vikre EK, Oppenheimer S, Chang H, Kanarek RB. Obesity: how television is inluencing the obesity epidemic. Physiol Behav 2012;107:146-53.
25. Rodrígues-Martin A, Novalbos Ruiz JP, Martínez Nieto JM, Escobar Jiménes L. Life-style factors associated with overweight and obesity among Spanish adults. Nutr Hosp 2009;24:144-51.
Corresponding author
Gustavo de Souza Moretti Avenida Recanto Verde, nº 350, Condomínio Riviera Dei Fiori, Q.04, Cs.28
Bairro: Conjunto Mariana. CEP: 69919-182 - Rio Branco - Acre E-mail: [email protected]
27. Bezerra PCL, Opitz SP, Koifman RJ Muniz PT. Percepção de saúde e fatores asso-ciados em adultos: inquérito populacional em Rio Branco, Acre, Brasil, 2007-2008. Cad Saúde Públ 2011; 27:2441-5.
28. Martins MCC, Ricarte IF, Rocha CHL, Maia RB, Silva VB, Veras AB. Filho MDS. Pressão arterial, excesso de peso e nível de atividade física em estudantes de uni-versidade pública. Arq Bras Cardiol 2010;95:192-9.
29. Mataix J, López Frías M, Martínez-de-Victoria E, López-Jurado M, Aranda P, Llopis J. Factors associated with obesity in an adult Mediterranean population: inluence on plasma lipid proile. J Am Coll Nutr 2005;24:456-65.