Is doing good, good for you? The relationship between
Financial Distress and CSR: A study on Southern Europe.
José Maria Parreira do Amaral
152418064
Dissertation written under the supervision of Professor Ricardo
Reis
Dissertation submitted in partial fulfilment of requirements for the Master
of Science in Finance, at the Universidade Católica Portuguesa
Is doing good, good for you? The relationship between
Financial Distress and CSR: A study on Southern Europe.
José Maria Parreira do Amaral
152418064
Abstract:
In this dissertation, we study the relationship between Corporate Social Responsibility (CSR) performance and Financial Distress, between 2007 and 2017 in a Southern European context. In order to assess this association, ESG (Environmental, Social and Governance) Scores are used as proxies for CSR performance, while three different measures are employed in representation of Financial Distress levels, including Altman-Z Score. Based on sample of 115 publicly listed Southern European companies we find that firms with higher levels of positive CSR performance are less likely to fall into situations of Financial Distress. In addition, the results also remain robust after mitigating endogeneity through the use of the instrumental variable technique. Finally, the results evidence that three dimensions of ESG (Environmental, Social and Corporate Governance) have similar significant relationships with Financial Distress. Environmental and Corporate Governance performance are negatively linked with Financial Distress, however the contradictory results for Social Performance indicate that is not possible to establish a well-defined relationship between this ESG dimension and Financial Distress. In our context, we are able to conduct an investigation in a European region known for experiencing high levels of Financial Distress but also low levels of Corporate Social Responsibility, when compared with other European regions.
Keywords: Financial Distress, Corporate Social Responsibility, ESG Score. Sustainable Development Goals (SDGs): 8, 9, 10, 11, 12, 13.
Is doing good, good for you? The relationship between
Financial Distress and CSR: A study on Southern Europe.
José Maria Parreira do Amaral
152418064
Abstrato:
Nesta dissertação, estudamos a relação entre o desempenho da Responsabilidade Social Empresarial (RSE) e as Dificuldades Financeiras, entre 2007 e 2017 em um contexto Sul Europeu. Para avaliar esta associação as pontuações de ESG (Ambiental, Social e Governança Corporativa) são utilizados como representativos para o desempenho da RSE, enquanto três medidas diferentes são empregadas em representação dos níveis de Dificuldades Financeiras, incluindo o Altman-Z Score. Com base em uma amostra de 115 empresas Sul Europeias listadas publicamente, descobrimos que empresas com níveis mais altos de desempenho positivo em RSE têm menor probabilidade de cair em situações de Dificuldades Financeiras. Adicionalmente, os resultados permanecem robustos após mitigar a endogeneidade através do uso da técnica da variável instrumental. Por fim, os resultados evidenciam que as três dimensões de ESG revelam relações significativas semelhantes com as Dificuldades Financeiras. O desempenho Ambiental e o da Governança Corporativa estão negativamente relacionados com as Dificuldades Financeiras, porém os resultados contraditórios do desempenho Social indicam que não é possível estabelecer uma relação bem definida entre esta dimensão de ESG e as Dificuldades Financeiras. Neste contexto, somos capazes de realizar uma investigação em uma região Europeia, conhecida por altos níveis de Dificuldades Financeiras, como também, baixos níveis de Responsabilidade Social Empresarial, quando comparada com outras regiões europeias.
Palavras-chave: Dificuldades Financeiras, Responsabilidade Social Empresarial, ESG. Objectivos de Desenvolvimento Sustentável (ODS): 8, 9, 10, 11, 12, 13.
Acknowledgements
This dissertation represents the end of a journey that had an ambitious start five years ago. Its delivery symbolizes not only individual effort, but also all the help and recommendations that I had from an amazing group of people during this journey. Their support was definitely essential to my academic and hopefully professional and personal success.
First, I would like to thank my supervisor, Professor Ricardo Reis, for his ideas and flexibility during this semester. His support and insight since day one were highly valuable for the outcomes of this investigation.
To my colleagues, namely Joana Gomes, Luis Frade, Diogo Macedo, Francisco Lampreia, Filipe Perre, Manuel Murta and Carlota Galhardas for their constant support and advice during this master. Their continuous motivation were essential to deal with stressful times.
Furthermore, a special word of appreciation to all my close friends and girlfriend who have made all this journey even more incredible and remarkable, thanks for always being there for me.
Last but not least, I would like to thank my family, especially my parents, for all the support, dedication and for being the best source of inspiration that I could ever have.
Table of contents
1. Introduction ... 8
1.1 Corporate Social Responsibility in Europe ... 10
1.2 The ESG Framework Structure ... 12
2. Literature Review and Hypothesis Generation ... 14
2.1 Corporate Social Responsibility ... 14
2.2 Corporate Social Responsibility and Financial Performance ... 16
2.4 Financial Distress ... 18
2.5 Financial Distress and Corporate Social Responsibility Performance ... 19
3. Data & Methodology ... 21
3.1 Sample and Data ... 21
3.2 Variables ... 22 3.2.1 Dependent Variables ... 22 3.2.2 Independent Variables... 22 3.2.2 Control Variables ... 23 3.3 Methodology ... 24 3.4 Summary Statistics ... 27 4. Empirical Results ... 29 4.1 OLS Method ... 29 4.2 Robustness ... 32
4.3 Instrumental Variable Analysis ... 34
5. Conclusions ... 35
List of Tables
Table 1 - Weights allocated to each CSR Factor ... 13
Table 2 - List of Variables ... 47
Table 3 - Descriptive Statistics ... 48
Table 4 - Correlation Matrix ... 48
Table 5 - Regression Results: ESG Score ... 49
Table 6 - Regression Results: ESG Combined Score ... 50
Table 7 - Regression Results: ESG pilars ... 51
Table 8 - Robustness Test: ESG Score ... 52
Table 9 - Robustness Test: ESG Combined Score ... 53
Table 10 - Robustness Test: ESG pilars ... 54
Table 11 - First Stage: Instrumental Variable analyis ... 55
Table 12 - Second Stage: Instrumental Variable analysis ... 56
List of Figures
Figure 1 - ESG Scores Methodology Framework ... 13Figure 2 - CSR Pyramid ... 15
Figure 3 - ESG Score’s Average Evolution ... 28
List of Abbreviations
CSR Corporate Social Responsibility
ESG Environmental, Social and Governance
ESGC Environmental, Social and Governance Combined
OLS Ordinary Least Squares
IV Instrumental Variable
EC European Commission
ROA Return on Assets
AltmanZ Altman-Z Score
AC Almeida and Campello
BOS Berger, Ofek and Swary
R&D Research and Development
EU
European Union
NGOs Non-governmental Organizations
SME Small and Medium-sized Enterprises
ENV Environmental
SOC Social
GOV Governance
NPV Net Present Value
OECD
Organization for Economic Cooperation and Development
IMF International Monetary Fund
IND Industry
SDGs Sustainable Development Goals
ODS Objetivos de Desenvolvimento Sustentável
RSE Responsabilidade Social Empresarial
1. Introduction
Corporate Social Responsibility (CSR) has become a competitive factor for businesses and firms all over the world. The competitiveness of a company used to be set through the price of its products and the convenience of the offer. Negative externalities and effects in the form of product characteristics and manufacturing processes were disregarded, with corporate reputation and image also being a relatively low priority for consumers. In the contemporary world however, it is well established that organizations must invest permanently in relationships with all stakeholders: customers, suppliers, employees and partners. These relationships further include the community in which it operates, the government, and society at large. Currently, the immensity of recent and ongoing events, such as the global financial crisis or climate change, have raised serious social concerns and further increased public interest in social, environmental, ethical and financial effects and outcomes (Galbreath, 2013). Even though CSR is a controversial concept in the academic and business atmosphere, a substantial consensus has emerged that defends that it is a fundamental strategy for achieving the sustainable development that our globalized world needs (Souto, 2009). Incorporating and demonstrating CSR strategies and performances is itself a challenging prospect. Firms and corporations require increased power and influence in order to tackle the innumerous needs and expectations of a wide variety of stakeholders. Consequently, they face new challenges that are brought about by that very same increased dominance and influence. These can include a duty to manage their resources in a way that considers not only financial profits and economic efficiency, but also account for social and environmental demands, satisfying the needs of a new and wide range of stakeholders. The exponential development of technology and faster access to information has fostered general knowledge regarding corporate scandals and large business failures. These inevitably lead to a negative perception of businesses and corporations becoming ingrained in consumer’s minds and those of their governments. This may translate into heavy losses, not only economically, but also in reputation, which may itself result in socially implicit consumer embargos, political and media pressure, or even government fines.
In the recent years, several researchers have attempted to gain a greater understanding of the relation between Corporate Social Responsibility and Financial Distress, but such studies are a relatively rare sight within the literature. (Deegan, 2002). The relationship between CSR performance and Financial Distress has in fact been largely eclipsed by the much larger body of study on the relationship between CSR and financial performance. Al-Hadi et al. (2017)’s
work provides some empirical evidence confirming the negative association between CSR performance and a firm’s probability of being under financial duress, an analysis dependent on the use of firms’ life-cycle stages as a moderating factor. This approach compares to Goss (2009), whose work confirms Al-Hadi’s findings through the use of both multivariate regressions and a discrete time hazard model instead.
The importance of this study has been increasingly debated within the literature. The consensus is increasing among researchers which has only further increased public curiosity and concern regarding the impact of environmental, social and governmental decisions and their effects. The past fifty years have seen an increase in the attention given to the subject of CSR within academia. The majority of the primary studies performed during this period have found a positive association between firms’ probability of facing risks associated with Financial Distress and CSR investments. These findings have led to subsequent arguments that investment in CSR strategy are risky and expose companies to unpredicted economic difficulties. Such studies support the agency theory promoted by Friedman (1970), purporting that profit intensification is the primary obligation of private companies. Jensen and Meckling (1976) further argue that the creation of a confident image within public media is the principal incentive behind managers’ responsible practices. Nevertheless, there is a trend within recent studies towards agreement with stakeholder theory. According to Jiao (2010)’s work, CSR expenditures are beneficial in the long-term, generating intangible assets, such as status or goodwill, and thereby enriching organizations in terms of account purposes and values. In order to preserve their market share, it is fundamental for enterprises to engagement in CSR behaviors that fulfill customers’ and society’s expectations (Rexhepi et al, 2013). In 2013, Rexhepi et al. (2013) described the importance of CSR as follows: “CSR is not just what to do with your
money but how to make your money.”
This thesis aims to analyze and understand the impact of CSR performance on a firm’s likelihood of entering into situations of Financial Distress situations, using Southern European Nations between 2007 and 2017 as case study. Our sample is based on 115 publicity listed and randomly selected Southern European companies from France, Italy, Spain, Portugal and Greece, on all of which a set of regressions was be applied for analysis. Our results demonstrate that CSR performance is negatively and significantly related to Financial Distress. Complementary proxy measures for CSR performance and Financial Distress are tested in this analysis to add robustness to our results. In comparison to many preceding studies on the
subject, we have integrated corporate governance into our models, as the environmental, social and governance dimensions should be studied through a fully integrated framework (Galbreath, 2013 and King, 2011). This paper has the following structure. Firstly, CSR context within Europe will be well-defined through an underlying concept based on ESG Scores. Secondly, the theoretical framework will be presented. Our third chapter will then present the data and methodology applied for the purposes of empirical analysis. Lastly, the outcomes from our analysis will be examined, on which the main conclusions of this research will be built, so as to provide further insight and additional perspectives not covered by the current literature. 1.1 Corporate Social Responsibility in Europe
European organizations have traditionally been more than ever conscious and attentive regarding CSR values, strategies and rules. It is evident however, that conceptualization and considerations on CSR vary among the different EU countries and regions (Mullerat, 2013). In order to proceed to the creation and incorporation of an international CSR framework, one must understand that there is no global agreed-upon optimum approach or method in addressing CSR concerns (Argandoña and Hoivik, 2009). Even within the EU, member states differences arises from culture, politics, economy or history. The United States had a crucial pioneering role in the development of business ideas where Corporate Social Responsibility had relevance in strategic and performance terms. Meanwhile, CSR has also become a fully assimilated concept in Europe as well. Nevertheless, in comparative terms, CSR in Europe differs considerably from CSR in the United States. The European Union is looking for a conceptual agenda and definition of social objectives through more regulated methods, in contrast to the United States where CSR policies are seen as far more voluntary actions and plans by individual firms. Hurst (2009) argues that European companies are in a stronger position than the United States in social terms, due to their efforts to combine CSR and business strategy.
In order to set a path towards sustainable improvement, the European Commission placed great emphasis on defining and promoting the relevance of CSR in the Green Paper of 2001. CSR was made to be a strategic mechanism for building a more competitive and socially interconnected society, while also revolutionizing and reinforcing the European social model. Businesses and organizations were required to provide additional relevant information in a transparent manner and detailing the social and environmental impact of their enterprises. In addition, the Commission started to expect corporate commitments on ethical behavior, responsible practices and overall transparency. Despite a clear definition of strategies to follow
regarding CSR implementation within the European Union, the years since the publication of the green paper saw significant challenges and events preventing the progress of Europe’s CSR program. These challenges in turn, led to the EU becoming even more aware and dynamic in inspiring enterprises to use CSR activities for incentivizing sustainable development, innovation and competitiveness. This set of European social and environmentally responsible goals faced numerous challenges in terms of application at the member state level. The alteration and unstable mandates of political parties all over Europe, along with the global economic crisis of 2008 and its impact on the southern part of the continent, generated enormous and severe concerns. These were focused on the social and economic dimensions which made the understanding and growth of EU strategy on CSR uncertain and eventually even more problematic (Türker and Altuntas, 2012). Despite such tremendous difficulties, European countries responded well towards adversity, and have increasingly demonstrated their willingness to participate in projects intended to improve environmental and social responsibility. Furthermore, organizations have begun to divulge more sustainable and CSR-focused reports than ever before, is clear evidence of the importance given not only by managers, but also by investors and other stakeholders, to these issues (Nielsen et al., 2013). Through the focus on particular EU member states, the United Kingdom can be distinguished for its developments of qualitative aspects of CSR. This can be explained as the result of a particular set of conditions, such as a consistent following of its core concepts, widespread cooperation between NGOs with environmental commitments and businesses, serving as the headquarters for numerous multinational corporations, and possessing strong regulations on the disclosure of sustainability reports (Mullerat, 2013). In Italy, the CSR movement is gaining strength through social and environmental activity and lobbying from SMEs in cooperation with the financial and banking sectors. France is also susceptible to achieve a stable enlargement in CSR matters, as the government is able to create regulations leading to stable labor relations while supporting SMEs through innovative CSR actions. Even with this positive short-term outlook when considering the growth of CSR investments in Europe, it is imperative to realize that the principal objective of shareholders remains the growth of their wealth. It is therefore crucial for companies and their shareholders to effectively manage the symbiosis between profit maximization and CSR integration. In order to materialize its 2020 strategy of “smart, sustainable and inclusive growth”, a well-organized execution of CSR procedures must be settled by the European Commission, and thereby helping it to create a more transparent and effective economy (Nielsen et al., 2013).
1.2 The ESG Framework Structure
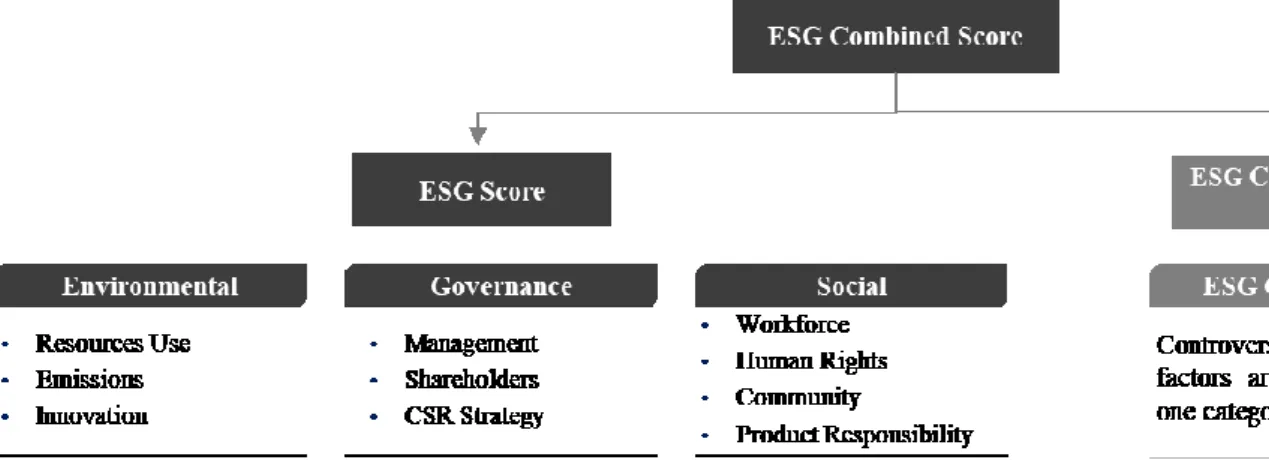
For the purposes of this study, the ESG (Environmental, Social and Governance) Score and ESG Combined Score will be measured as a proxy of CSR Performance along with the three main pillars of the ESG score. They are thus considered as independent variables. Before proceeding into the methodological features of this approach however, it is essential to present the concept and theories behind the calculation of these scores. In order to quantify CSR performance, several methods are being tested. Although when assessing all our comparable data across different countries and companies, it becomes essential to secure an external and independent source to obtain reliable information. Taking this into consideration, every data concerning ESG scores and CSR information was extracted from a unique database, named Refinitiv’s Datastream ESG Scores. Refinitiv identifies the progressively critical importance of clear, precise and comparable social and environmental data for researchers and investors in the financial industry. These scores are designed to provide transparent insight into ESG risks, opportunities in investment portfolios, and benchmarks on peer companies, therefore providing additional information for the purposes of investment decision-making. Using 10 main factors, scores are firstly computed for the three different pillars of the ESG Framework (Environmental performance, Social performance and Governance performance) which allows us to distill the individual performance of each CSR dimension. Subsequently, the three pillars are assembled into the global ESG score which is calculated using the weighted average of our 10 factors. These are defined as: Resources Use, Emissions, Innovation, Management, Shareholders, CSR Strategy, Workforce, Human Rights, Community, and Product Responsibility. The score attribution for these 10 factors is based on over 400 ESG metrics which are retrieved and calculated from a variety of trustworthy sources such as companies’ annual reports, company websites, CSR reports, and NGO websites. With the intention of presenting an accurate reflection of companies’ CSR effectiveness and performance, this database provides results through both simple to understand percentages (0%-100%), and letter grades from D- to A+. In table 1, the percentages used to compute the scores of the three main dimensions along with ESG scores are presented. Figure 1 further provides us with the entirety of the organizational framework used in the computation of the ESG Scores.
The ESG Combined Score can be considered to be an extension of the normal ESG Score as it takes into consideration the ESG Controversies score, which is itself based on damaging media stories and corporate image. This score is based on 23 ESG controversy metrics, with company involvement in controversies or scandals greatly increasing its influence, therefore potentially and significantly reducing the overall ESG Combined Score. On the other hand, when there are no corporate scandals or polemic news to speak of, the ESG Controversies score equals to zero, thus resulting in an ESG Combined Score that is equal to the ESG Score. One can observe three distinct scenarios through the application of our methodology. Initially, if the Controversies Score is equal to or greater than 50, then our ESG Score equals the ESG Combined Score. If the Controversies Score is greater than the ESG Score, but is still below 50, then the ESG Combined Score will simply equal the ESG Score. Finally, if the Controversies Score is below 50 and also inferior to the ESG Score, then the ESG Combined Score will equal the average of the ESG and Controversies Scores.
Figure 1 - ESG Scores Methodology Framework. Source: Refinitiv, 2019
Factor Weight Resource Use 11% Emissions 12% Innovation 11% Environmental Score 34% Workforce 16% Human Rights 4.5% Community 8% Product Responsibility 7% Social Score 36% Management 19% Shareholders 7% CSR Strategy 4.5% Governance Score 31% ESG Score 100%
Table 1 - Weights allocated to each CSR Factor. Source: Refinitiv, 2019
2. Literature Review and Hypothesis
2.1 Corporate Social Responsibility
The concept of Corporate Social Responsibility (CSR) was introduced a long time ago, and it has been a topic of debate since the 1950s, when Howard R. Bowen suggested that businesses had the responsibility of attaining goals of social fairness and economic prosperity by generating welfare for an extensive range of societal stakeholders (Bowen, 1953). Despite this first standard of expressive appreciation, other researchers have shown skepticism towards the idea that CSR is a fundamental business process. They argue instead that its activities and strategies can be analyzed as risk management procedures, used by firms to attain greater levels of reputation and thus gain protection against social, political and regulatory punitive sanctions (Godfrey, 2005; Minor and Morgan, 2011).
In Freeman’s book “Strategic Management: A Stakeholder approach” published in 1984, the Stakeholder Theory was proposed as an alternative to the standard model of financial economics which defends the maximization of shareholder wealth as the ultimate objective of a company’s management board. In opposition, Freeman proposes that the goal of a company should not be to merely focus on the shareholder, it should instead assure synchronized utility maximization of all groups and individuals, including employees, community and costumers, which affect and are affected by the pursuit of the company goals. Many academics have tried to defend and endorse the Stakeholder Theory, but resistance to this model continues to persist, as it is unclear how to maximize the utility of stakeholders through engagement in activities that equally benefit both shareholders and stakeholders (Freeman, 1984). Although Stakeholder Theory differs from the concept of CSR (Hillmand & Keim, 2001), these two notions agree with the argument that stakeholder management became an essential dimension of business strategy (Freeman, 1984), thereby fostering the implementation of CSR activities in order to satisfy the interests of most of those involved in the corporation’s environment.
To fully meet their Corporate Social Responsibility, businesses should strive to streamline processes for the incorporation of social, environmental, and ethical, human rights and consumer concerns into their business operations and core strategy in close collaboration with stakeholders. The maximization of shared value for shareholders, stakeholders and society at large is the primary objective of CSR. (EU Commission, 2011).
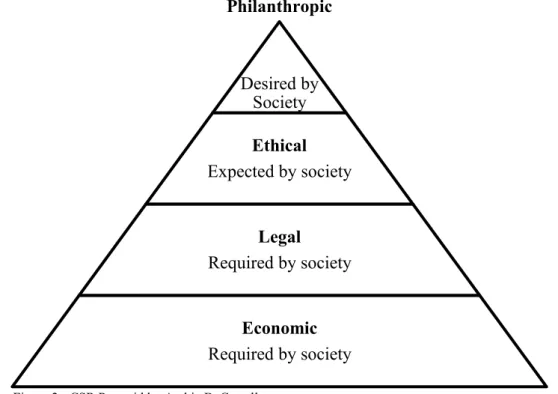
In 1991, and prior to this characterization, Archie B. Carrol designed a Corporate Social Responsibility pyramid, illustrated in figure 2 below, which represents the four distinct “responsibilities” of a corporation. Starting from the base, we have Economic concern, a fundamental necessity for an enterprise to survive and benefit society in the long-term. Legal responsibility represents a duty to obey laws, directives and official public policy. The ability to act morally, ethically and go beyond the narrow requirements of the law, is symbolized by an Ethical responsibility further up on the pyramid. Lastly, Philanthropic responsibility characterizes a company’s capability to give back to society.
Corporate Social Responsibility can be broadly expressed as voluntary firm activities designed to develop social or environmental conditions (Mackey et al. 2007). The strict definition of this concept is unclear and there are several different variations proposed. CSR theory subsequently fluctuates significantly between different companies and organizations in terms of interpretation and implementation (Lau et al., 2007). Nevertheless, there is consensus in the idea that CSR is considered to be a fundamental factor in the success and survival of a firm (Hoi et al., 2013). In addition, the combined benefits from positive engagement in CSR-related activities may generate an optimistic financial outlook and supplementary gains, and thus reducing the probability of falling into a state of Financial Distress (Godfrey, 2005).
Philanthropic Desired by Society Ethical Expected by society Legal Required by society Economic Required by society
2.2 Corporate Social Responsibility and Financial Performance
Under the assumption that financial performance and Financial Distress are two closely linked concepts (Opler and Titman, 1994), it is imperative to review the literature on both CSR and Financial Performance, before analyzing the impact of CSR activities on a company’s probability of entering into a Financial Distress situation. As previously stated, the conceptualization of CSR has become a relevant topic of interest over time, and this interest has flourished even further when the relationship between CSR and Financial Performance is tested and analyzed. Corporate Social Responsibility is no longer seen as a hypothetical competitive advantage for a firm, but rather as a real strategic prerequisite (Falkenberg and Brunsael, 2011). Consequently, companies and their shareholders have begun to realize the importance and the need to allocate funds and investment into CSR campaigns in order to promote a positive environmental and social impact (Maretno H. et al. 2016).
Although several studies have covered the topic, evidence from evaluations of CSR impact on firms’ financial performance has been mixed. There is a noticeable variety and range of opinions within the literature, Margolis and Walsh (2001) for instance, find little evidence of an association between corporate social performance and financial performance. Some researchers however, claim to have found strong links between CSR and: financial performance (Orlizky et al. 2003; Waddock and Graves 1997; Eccles et al. 2013), positive effects on the image and reputation of a company (Schwaiger, 2007), employee motivation and retention (European Commission, 2001), increased competitiveness thorough process and product benefits (Porter and Van der Linde, 1998) or through costs savings (Epstein and Roy, 2001). Other scholars within the literature have focused on a financial perspective, analyzing returns to investors who choose portfolios of firms with high levels of CSR. Once again, the results are mixed and there is little consensus surrounding this topic (McWilliams and Siegel, 1997). There are some indications of a growing consensus however that while there is clear benefit in impact investment, there is also little if any negative consequence associated with it (Statman et al, 2006). Some researchers have found a positive connection (Posnikoff, 1997), others purport to have discovered a negative relationship (Wright and Ferris, 1997; Lima Crisóstomo et al. 2001; Barnea et al,. 2010), and yet others find no relationship at all (Teoh et al., 1999; Hillman and Keim, 2001).
One reasonable explanation for the discrepancy in results within the literature is the time frame inherent to CSR activities. The costs of CSR are immediate, whilst many of its benefits and effects are not. Consequently, investors with different maturity preferences value firms’ CSR performance differently (Tsoutsoura, 2004). Baron (2006) suggests that the intensification of competitively motivated companies seeking to invest in social actions set them apart from other organizations, in particular due to the reaction of other companies in maintaining or decreasing their investments into a particular social responsibility action. After reviewing the literature, it can be stated that there is some agreement that involvement in Corporate Social Responsibility can be used as a means of differentiation in a competitive market (Jonhson, 1966; Fisman et
al., 2005; Baron, 2006; Fernández-Kranz and Santaló, 2010).
2.3 Dimensions of Corporate Social Responsibility
Another pertinent field of study relates to the three different dimensions of CSR: environmental, social and governance. The environmental dimension of CSR is an extremely well-researched field of study. The connection between performance in this environmental dimension and overall financial performance, however, remains uncertain. Companies which implement environmentally responsible practices are more likely to generate positive stakeholder perception (Turcotte et al. 2007), which in turn results in improved economic performance. While some studies have reported a positive relationship between these two variables (Schnietz and Epstein 2005), others have found a negative relationship (Wagner et al. 2002; Gray et al., 1993), seemingly due to the high costs associated with the implementation of environmental strategies, along with interrelated productivity inefficiencies.
As regards to the social aspect, it is possible for one to argue that there is more consensus within the academic and research society on the effects of this particular dimension than on those of the environmental dimension. The development and implementation of several social activities in the corporate environment, such as employee rights, voluntary support or professional training, are seen as an essential business process and strategy by stakeholders (Rhouma et al., 2012). Moreover, managers recognize that using social activities generates goodwill, which in turn may increase a firm’s value (Jensen 2002; Brown et al., 2006).
Company’s actions in the dimension of governance can also influence stakeholders’ opinions and perception towards a company, which may generate relevant and positive returns for the firm (Gill, 2008). According to Cespa and Cestone (2007), investments made in CSR from
CEOs intensifies stakeholder empathy, reinforces their positions inside the company, and improves economic results.
2.4 Financial Distress
Starting with Altman’s (1968) study on the fundamental causes of bankruptcy, corporate Financial Distress, and defaults marked a watershed moment on a topic under consistent investigation and analysis for the past 50 years. Following on the footsteps of this initial study, the Z-score formula emerged, thereafter becoming widely used as a measure of Financial Distress, becoming generally accepted due to its simplicity and consistency. The Altman Z-score is the output of a credit-strength examination which measures a publicly traded manufacturing company's likelihood of bankruptcy (Altman el al, 2014). Corporate Financial Distress is a general term with various and distinct but widely used definitions among the research society. These can include insolvency, failure, bankruptcy and default (Altman and Hotchkiss, 2006). Taking these factors into account, several designations of Financial Distress were defined. Platt and Platt (2002) describe Financial Distress as a late phase of corporate deterioration which precedes a more damaging result, like bankruptcy. According to Zmijewski (1984), financially distressed companies are simply those which “fill a petition for bankruptcy”. Mackee (2003) on the other hand, advocates that several events can happen before going into bankruptcy, with poor income and unsatisfactory liquid asset positions being some events which categorize a firm in a situation of Financial Distress.
Furthermore, Financial Distress increases incentives for risk-shifting practices (Maksimovic and Titman; Eberhart and Senbet, 1993), a concept introduced by Galai and Masulis (1976) and Jensen and Meckling (1976). This concept is characterized by incentives from shareholders and managers to invest in negative NPV projects, which may themselves generate benefits if certain goals and objectives are met, while bondholders must bear the costs if the endeavor goes poorly (Eisdorfer, 2008). Financially distressed firms demonstrate a variety of conditions which evidence an underprivileged situation, these being: growth in the cost of capital, weaker credit ratings, a reduction in access to external funding sources, and in most circumstances an increase in the disposition of managers to undertake riskier investments and projects (Edwards et al., 2013).
The wider body of literature on the subject contains an enormity of proposed theories and methods on how to measure the likelihood and probability of a firm entering into Financial Distress. Accounting-based variables in statistical models were the first ones proposed and tested by Altman (1968, 1984), but these have come under fire by several other scholars. They argue instead that such simulations provide unreliable estimations since an investigator can only accurately analyze a firm’s variables at the time of default (Shumway, 2001). Shumway (2001) recommends instead, the adoption of a hazard model to gather information, in contrast to the linear discriminant technique suggested by Altman. Merton (1974) on the other hand, demonstrates that a system of nonlinear equations can define the probability of defaults based on stock prices, by relying on a simple set of assumptions. Yet another practical approach to evaluating financial soundness was proposed by Zmijewski (1984). This approach is also based in accounting variables, unlike Shumway (2001)’s or Merton (1974)’s models which rely on market variables. A more exhaustive overview regarding credit risk models can be further analyzed in Allen et al. (2004).
2.5 Financial Distress and Corporate Social Responsibility Performance
Studies into the effects of CSR activities on Financial Distress generally correspond to a negative correlation between both topics. Within intensely CSR-focused firms, improved financial performance is further improved through the creation of solid relationships with key stakeholders such as creditors, suppliers, customers and employees, which lends itself to an improved probability of future growth (Godfrey et al. 2009 and Attig et al. 2013). Stable CSR engagement is itself correlated with an inferior cost of equity, consequently firms that demonstrate high intensities of CSR practices express considerably lower idiosyncratic risk (El Ghoul et al. 2011). Waddock and Graves (1997) find that enterprises which use financial resources strategically and efficiently in order to reach stakeholders’ expectations may have their corporate reputation and competitiveness reinforced. According to Cheng et al. (2013), a focus on a solid CSR approach generates enhanced stakeholder engagement and transparency within and around the firm, helping to moderate any limitations to funding.
As previously stated, CSR can be analyzed as a risk management approach (Godfrey, 2005). This argument describes CSR practices as a means of attending to the interests of both shareholders and stakeholders, allowing for the mitigation of the risk of falling into a situation of Financial Distress (Minor and Morgan, 2011 and Hoi et al. 2013). Godfrey et al. (2009)
claim that when firms concentrate on society as a whole through the use of CSR activities, risk management evaluation is strengthened, which in turn generates goodwill and eases access to external capital, providing financial protection and stability against any possible future negative challenges and events. Management ineffectiveness and incompetence is one of the principal reasons behind a business sliding into a financially problematic condition (Altman and Hotchkiss, 2006).
In most cases CSR practices may be seen as a proxy of governance quality, and consequently firms involved in such practices are less likely to fall into a status of Financial Distress (Attig and Cleary, 2015). Overall, promising governance practices and constructive employee relationships are key mechanisms which can lead to positive returns (Edmans 2008; Bertrand
et al. 2003). The success of individual businesses depends on their capacity to reflect all types
of stakeholders’ affairs (Donaldson and Preston 1995), with their insights acting as a connection between the CSR performance of businesses, and their economic and financial performances (Barnett 2007). Regarding the existing literature, it is important to mention that when financial performance and CSR performance are studied and analyzed, results appear to diverge as the research typically focuses on different countries, industries or markets. Furthermore, when one considers that financial performance is strongly correlated with Financial Distress, reviewing and understanding the wider body of literature on the subject becomes an essential requirement. In what the relationship between CSR performance and Financial Distress however, it appears clear that opinions and conclusions are typically less controversial within the research community. There is a consensus on the meaning and significance of the link, although most research typically focuses on individual correlation between specific dimensions of CSR (environmental, social and governance), while the body of research focusing specifically on Financial Distress is neither as extensive nor as conclusive. Following on the footsteps of previous studies and their results, we expect our results to concur with previous suggestions of the existence of a plausible negative association between a firm’s positive CSR performance and their likelihoods of entering into Financial Distress (Al-Hadi et al, 2017). In simple terms, we anticipate firms which demonstrate a higher strategic focus on CSR activities to be subjected to lower levels of Financial Distress. As such, the first hypothesis within our project is formulated as follows:
H1: Firms with higher levels of positive CSR performance are less likely to fall into situations of Financial Distress.
To summarize, stakeholder theory describes stakeholders as parties that impact or are impacted by the activities of an organization (Freeman, 1984), with business success thus relying on their ability to consider all manners and kinds of stakeholders’ interests (Donaldson and Preston, 1995). Taking this into account, subjects regarding environmental, governance and social topics are typically relevant for stakeholders, and as such they need the additional consideration of the next three research hypotheses presented below. Based on the existing literature, we propose that the three distinct dimensions of Corporate Social Responsibility are negatively associated with Financial Distress. This effectively means that firms which engage in environmental, social and responsible governance activities and procedures face lower levels of Financial Distress. Thus:
H2: Firms with higher levels of positive Environmental performance are less likely to fall into situations of Financial Distress,
H3: Firms with higher levels of positive Social performance are less likely to fall into situations of Financial Distress.
H4: Firms with higher levels of positive Corporate Governance performance are less likely to fall into situations of Financial Distress.
3. Data & Methodology
3.1 Sample and Data
This research is based on a sample of 115 randomly selected and publicity-listed Southern European firms during the 2007-2017 timeframe. After the exclusion of companies with missing data, and companies operating in the financial industry, our final sample contains 1265 firm-year observations from the following 5 Southern European countries: France, Portugal, Spain, Italy and Greece. All data concerning financial information, CSR performance and other relevant company material is retrieved from Refinitiv Datastream. This database is one of the largest and most up to date ESG information collections in the world, and of particular relevance and utility to our research goals. Calculation of scores’ is based on more than 400 ESG metrics and 178 comparable measures of over 7000 companies worldwide.
3.2 Variables
As previously stated, all variables, including dependent, independent and control variables, are calculated from the database data provided by Refinitiv Datastream. This database provides economic and financial time series data for 175 countries and 60 markets and is widely used in various research projects in this field, being generally considered within the literature as a reliable, trustworthy and valuable source. DataStream offers data from numerous organizations, such as the Organization for Economic Cooperation and Development (OECD), International Monetary Fund (IMF), and various other national government sources. Specific measurements and descriptions regarding every variable used in this dissertation is provided in Table 2. 3.2.1 Dependent Variables
Following the former approach employed by Al-Hadi (2017) and other studies focused on topics related to Financial Distress (Altman, 1968; Berger et al, 1999; Almeida and Campello, 2017), three different measures of Financial Distress are employed in this dissertation: Altman (1968)’s model (AltmanZ), Berger et al. (1999)’s model (BOS_DIS) and Almeida and Campello (2007)’s model (AC_DIS). These last two assess a firms’ asset tangibility. This approach provides a more realistic perspective, as relying on more measures allows us to account for further theoretical perspectives and ideas, thereby improving the robustness of our results. It is also pertinent to mention that greater values within these Financial Distress proxies mean lower levels of Financial Distress. This applies to all of the methods we have just listed above.
3.2.2 Independent Variables
Regarding independent variables, our study employs ESG scores as proxies for CSR performance. A firm’s total ESG scores, ESG combined scores and the scores of the three main ESG dimensions are evaluated. Moreover, every score is graded from 0 to 100, with 100 being the maximum score a company could conceivably reach. ESG performance scores from Refinitiv database are increasingly used as a measure of CSR performance (Cuesta and Valor, 2013) due to their relevance as a source of information for investors choosing where to allocate their capital to (Richardson, 2009). According to O’Dwyer et al. (2005), several stakeholders are progressively requesting more and more CSR information and to rely on for investment decision-making processes. Given this trend, we found it reasonable, relevant and useful to use this data for our research purposes. Furthermore, each dimension of the ESG score is used
separately to assess the impact of environmental, social and corporate governance practices. These are defined as the ENV Score, the SOC score and the GOV score, respectively. As previously stated, the quantified total ESG score is a weighted average of the scores of each separate dimension of the ESG score. Table 1 can be referred to for the specific weights’ distribution among CSR factors. Finally, the ESG Combined score (ESGC Score) is used to interpret the impact of controversial events or scandals that a company may be subjected to or engaged in.
3.2.2 Control Variables
Due to the considerable number of different factors that may influence a firm’s likelihood of entering into a situation of Financial Distress, several conventional control variables are applied in order to remove confounding effects from our results. Building upon past research, it is clear that the majority of researchers in this field of study have incorporated a number of the same control variables (Waddock and Graves, 1997, Hillman and Keim, 2001; Al-Hadi et al, 2017). The control variables we have elected to rely upon for our work here are firm size, leverage, research and development (R&D) intensity, cash holding, liquidity, profitability, industry sector, country, and year effects. Further to this, the particular definition of each control variable is provided below.
Firm size (Size): This variable is measured as the natural logarithm of the book value of total assets of the firm. This is a variable of particular interest, as it controls for differences in resources, ability to handle competition, and overall financing prospects. Based on the existing literature, it is expected that larger firms are typically more capable of engaging in CSR practices and to better handle periods of Financial Distress due to their higher economic and political influence when compared to smaller firms.
Leverage (Leverage): the ratio of the total debt (long-term plus short-term debt) against the book value of the firm’s total assets. This variable is used as heavily indebted companies may possess fewer of the opportunities and funds necessary to engage in CSR strategies.
Cash (Cash): the ratio of total cash to the book value of the firm’s total assets. This variable demonstrates how much capital and capital-derived resources a firm possesses which can be utilized during phases of financial restrictions.
Return on Assets (ROA): employed to control for a company’s overall profitability as companies with healthier levels of financial performance are less likely to face situations of default.
Liquidity (Liquidity Ratio): measured as the ratio of the sum of Cash & Receivables and Current Liabilities, this variable controls for a firm’s ability to meet its financial obligations, along with its capacity to supply funds for the company´s regular operations.
R&D intensity (R&D): calculated as R&D expenditure divided by a firm’s total assets, this variable controls for levels of R&D spending. It is of particular importance to incorporate this variable, as a firms' risk of entering into Financial Distress increases with the intensity of their engagement in R&D. (Wei Zhang, 2015).
Furthermore, we control for plausible Financial Distress variation across different industry segments, through industry sector (IND) dummy variables, defined as the first two characters of The Standard Industrial Classification (SIC). Lastly, dummies for Year (Year) and Country (Country) variables are also implemented to control for any fluctuations that may happen due to time and space-specific contexts and circumstances, rather than the impact of independent or other control variables.
3.3 Methodology
The aim of this paper is to explore and understand the link between Financial Distress and CSR Performance over time through a panel data method. This research includes cross-sectional data with continuous variables, while employing an Ordinary Least Squares (OLS) method for all regression analyses as a baseline model. For our purposes, the programming software for the effective analysis of our dataset will be Stata.
For the purposes of this paper and to acquire a more complete understanding regarding the relationship between Financial Distress and CSR, a three-step methodology approach is will be applied. A set of three regressions is developed and relied upon, requiring the evaluation of different hypotheses and results. Our first regression will estimate solely the effect of a company’s Total ESG Score (ESG Score) on the three distinct dependent variables, these being the Altman Z Score (AltmanZ), Almeida and Campello (AC_DIS)’s Financial Distress model, and Berger et al.’s model (BOS_DIS). Moreover, the group of control variables we have
defined above is throughout all of the regressions that follow. As such and building upon these definitions and our methodology, our first regression is estimated as shown below.
Regression 1: 𝐴𝑙𝑡𝑚𝑎𝑛𝑍𝑖𝑡= 𝛼0𝑖𝑡+ 𝛽1𝐸𝑆𝐺𝑆𝑐𝑜𝑟𝑒𝑖𝑡+ 𝛽2𝑆𝑖𝑧𝑒𝑖𝑡+ 𝛽3𝑅&𝐷𝑖𝑡+ 𝛽4𝑅𝑂𝐴𝑖𝑡+ 𝛽5𝐶𝑎𝑠ℎ𝑖𝑡+ 𝛽6𝐿𝑒𝑣𝑒𝑟𝑎𝑔𝑒𝑖𝑡+ 𝛽7𝐿𝑖𝑞𝑢𝑖𝑑𝑖𝑡𝑦𝑅𝑎𝑡𝑖𝑜𝑖𝑡+ 𝛽8𝐼𝑁𝐷𝑖+ 𝛽9𝐶𝑜𝑢𝑛𝑡𝑟𝑦 + 𝛽10𝑌𝑒𝑎𝑟 + 𝜀𝑖𝑡 𝐵𝑂𝑆_𝐷𝐼𝑆𝑖𝑡= 𝛼0𝑖𝑡+ 𝛽1𝐸𝑆𝐺𝑆𝑐𝑜𝑟𝑒𝑖𝑡+ 𝛽2𝑆𝑖𝑧𝑒𝑖𝑡+ 𝛽3𝑅&𝐷𝑖𝑡+ 𝛽4𝑅𝑂𝐴𝑖𝑡+ 𝛽5𝐶𝑎𝑠ℎ𝑖𝑡+ 𝛽6𝐿𝑒𝑣𝑒𝑟𝑎𝑔𝑒𝑖𝑡+ 𝛽7𝐿𝑖𝑞𝑢𝑖𝑑𝑖𝑡𝑦𝑅𝑎𝑡𝑖𝑜𝑖𝑡+ 𝛽8𝐼𝑁𝐷𝑖+ 𝛽9𝐶𝑜𝑢𝑛𝑡𝑟𝑦 + 𝛽10𝑌𝑒𝑎𝑟 + 𝜀𝑖𝑡 𝐴𝐶_𝐷𝐼𝑆𝑖𝑡 = 𝛼0𝑖𝑡+ 𝛽1𝐸𝑆𝐺𝑆𝑐𝑜𝑟𝑒𝑖𝑡+ 𝛽2𝑆𝑖𝑧𝑒𝑖𝑡+ 𝛽3𝑅&𝐷𝑖𝑡+ 𝛽4𝑅𝑂𝐴𝑖𝑡+ 𝛽5𝐶𝑎𝑠ℎ𝑖𝑡+ 𝛽6𝐿𝑒𝑣𝑒𝑟𝑎𝑔𝑒𝑖𝑡+ 𝛽7𝐿𝑖𝑞𝑢𝑖𝑑𝑖𝑡𝑦𝑅𝑎𝑡𝑖𝑜𝑖𝑡+ 𝛽8𝐼𝑁𝐷𝑖+ 𝛽9𝐶𝑜𝑢𝑛𝑡𝑟𝑦 + 𝛽10𝑌𝑒𝑎𝑟 + 𝜀𝑖𝑡
This first combination of regressions will establish the type of association CSR possesses with Financial Distress. The subsequent results may reveal distinct kinds of relationships, our research expects however to find a positive relationship between the Financial Distress metrics and ESG score, in line with Hypothesis 1. It is important to remember that greater values within these Financial Distress variables imply inferior levels of Financial Distress.
Our second set of regressions will use the ESG Combined Score (ESGC Score) variable rather than the ESG Score in order to analyze once more the relationship between Financial Distress and CSR. In this case, the difference is related to the fact this variable aggregates the effects of controversies and scandals which a company may be involved with. A company which is well-known to suffer from a poor reputation in the eyes of the media or other sources of public information, may feel the consequences in its overall ESG Combined Score, given that it is derived from the ESG Score and ESG Controversies Score. In summary, the central objective of this score is to discount the ESG score based on damaging media stories. From the outcomes of these three regressions, conclusions can be drawn regarding the magnitude of the influence of the Controversies Score and its effects on the general model. We expect however, to find a negative relationship between the ESG Combined Score and Financial Distress, and thus in agreement with Hypothesis 1. Such a result would suggest that the impact of controversies is not overly relevant. The suggested regression, containing all our explanatory variables, is shown below.
Regression 2: 𝐴𝑙𝑡𝑚𝑎𝑛𝑍𝑖𝑡= 𝛼0𝑖𝑡+ 𝛽1𝐸𝑆𝐺𝐶𝑆𝑐𝑜𝑟𝑒𝑖𝑡+ 𝛽2𝑆𝑖𝑧𝑒𝑖𝑡+ 𝛽3𝑅&𝐷𝑖𝑡+ 𝛽4𝑅𝑂𝐴𝑖𝑡+ 𝛽5𝐶𝑎𝑠ℎ𝑖𝑡+ 𝛽6𝐿𝑒𝑣𝑒𝑟𝑎𝑔𝑒𝑖𝑡+ 𝛽7𝐿𝑖𝑞𝑢𝑖𝑑𝑖𝑡𝑦𝑅𝑎𝑡𝑖𝑜𝑖𝑡+ 𝛽8𝐼𝑁𝐷𝑖+ 𝛽9𝐶𝑜𝑢𝑛𝑡𝑟𝑦 + 𝛽10𝑌𝑒𝑎𝑟 + 𝜀𝑖𝑡 𝐵𝑂𝑆_𝐷𝐼𝑆𝑖𝑡= 𝛼0𝑖𝑡+ 𝛽1𝐸𝑆𝐺𝐶𝑆𝑐𝑜𝑟𝑒𝑖𝑡+ 𝛽2𝑆𝑖𝑧𝑒𝑖𝑡+ 𝛽3𝑅&𝐷𝑖𝑡+ 𝛽4𝑅𝑂𝐴𝑖𝑡+ 𝛽5𝐶𝑎𝑠ℎ𝑖𝑡+ 𝛽6𝐿𝑒𝑣𝑒𝑟𝑎𝑔𝑒𝑖𝑡+ 𝛽7𝐿𝑖𝑞𝑢𝑖𝑑𝑖𝑡𝑦𝑅𝑎𝑡𝑖𝑜𝑖𝑡+ 𝛽8𝐼𝑁𝐷𝑖+ 𝛽9𝐶𝑜𝑢𝑛𝑡𝑟𝑦 + 𝛽10𝑌𝑒𝑎𝑟 + 𝜀𝑖𝑡 𝐴𝐶_𝐷𝐼𝑆𝑖𝑡 = 𝛼0𝑖𝑡+ 𝛽1𝐸𝑆𝐺𝐶𝑆𝑐𝑜𝑟𝑒𝑖𝑡+ 𝛽2𝑆𝑖𝑧𝑒𝑖𝑡+ 𝛽3𝑅&𝐷𝑖𝑡+ 𝛽4𝑅𝑂𝐴𝑖𝑡+ 𝛽5𝐶𝑎𝑠ℎ𝑖𝑡+ 𝛽6𝐿𝑒𝑣𝑒𝑟𝑎𝑔𝑒𝑖𝑡+ 𝛽7𝐿𝑖𝑞𝑢𝑖𝑑𝑖𝑡𝑦𝑅𝑎𝑡𝑖𝑜𝑖𝑡+ 𝛽8𝐼𝑁𝐷𝑖+ 𝛽9𝐶𝑜𝑢𝑛𝑡𝑟𝑦 + 𝛽10𝑌𝑒𝑎𝑟 + 𝜀𝑖𝑡
Last but not least, the final set of regressions will use all three distinct dimensions of ESG (our ENV, SOC, and GOV scores) as explanatory variables, to explain our dependent variables AltmanZ, BOS_DIS and AC_DIS. This will provide us with insight into their individual contribution and effect on a firms’ levels of Financial Distress. The regression necessary for such an analysis, containing all our explanatory variables, is shown below.
Regression 3: 𝐴𝑙𝑡𝑚𝑎𝑛𝑍𝑖𝑡= 𝛼0𝑖𝑡+ 𝛽1𝐸𝑁𝑉𝑠𝑐𝑜𝑟𝑒𝑖𝑡+ 𝛽2𝑆𝑂𝐶𝑠𝑐𝑜𝑟𝑒𝑖𝑡+ 𝛽3𝐺𝑂𝑉𝑠𝑐𝑜𝑟𝑒𝑖𝑡+ 𝛽4𝑆𝑖𝑧𝑒𝑖𝑡+ 𝛽5𝑅&𝐷𝑖𝑡+ 𝛽6𝑅𝑂𝐴𝑖𝑡+ 𝛽7𝐶𝑎𝑠ℎ𝑖𝑡+ 𝛽8𝐿𝑒𝑣𝑒𝑟𝑎𝑔𝑒𝑖𝑡+ 𝛽9𝐿𝑖𝑞𝑢𝑖𝑑𝑖𝑡𝑦𝑅𝑎𝑡𝑖𝑜𝑖𝑡+ 𝛽10𝐼𝑁𝐷𝑖+ 𝛽11𝐶𝑜𝑢𝑛𝑡𝑟𝑦 + 𝛽12𝑌𝑒𝑎𝑟 + 𝜀𝑖𝑡 𝐵𝑂𝑆_𝐷𝐼𝑆𝑖𝑡= 𝛼0𝑖𝑡+ 𝛽1𝐸𝑁𝑉𝑠𝑐𝑜𝑟𝑒𝑖𝑡+ 𝛽2𝑆𝑂𝐶𝑠𝑐𝑜𝑟𝑒𝑖𝑡+ 𝛽3𝐺𝑂𝑉𝑠𝑐𝑜𝑟𝑒𝑖𝑡+ 𝛽4𝑆𝑖𝑧𝑒𝑖𝑡+ 𝛽5𝑅&𝐷𝑖𝑡+ 𝛽6𝑅𝑂𝐴𝑖𝑡+ 𝛽7𝐶𝑎𝑠ℎ𝑖𝑡+ 𝛽8𝐿𝑒𝑣𝑒𝑟𝑎𝑔𝑒𝑖𝑡+ 𝛽9𝐿𝑖𝑞𝑢𝑖𝑑𝑖𝑡𝑦𝑅𝑎𝑡𝑖𝑜𝑖𝑡+ 𝛽10𝐼𝑁𝐷𝑖+ 𝛽11𝐶𝑜𝑢𝑛𝑡𝑟𝑦 + 𝛽12𝑌𝑒𝑎𝑟 + 𝜀𝑖𝑡 𝐴𝐶_𝐷𝐼𝑆𝑖𝑡= 𝛼0𝑖𝑡+ 𝛽1𝐸𝑁𝑉𝑠𝑐𝑜𝑟𝑒𝑖𝑡+ 𝛽2𝑆𝑂𝐶𝑠𝑐𝑜𝑟𝑒𝑖𝑡+ 𝛽3𝐺𝑂𝑉𝑠𝑐𝑜𝑟𝑒𝑖𝑡+ 𝛽4𝑆𝑖𝑧𝑒𝑖𝑡+ 𝛽5𝑅&𝐷𝑖𝑡+ 𝛽6𝑅𝑂𝐴𝑖𝑡+ 𝛽7𝐶𝑎𝑠ℎ𝑖𝑡+ 𝛽8𝐿𝑒𝑣𝑒𝑟𝑎𝑔𝑒𝑖𝑡+ 𝛽9𝐿𝑖𝑞𝑢𝑖𝑑𝑖𝑡𝑦𝑅𝑎𝑡𝑖𝑜𝑖𝑡+ 𝛽10𝐼𝑁𝐷𝑖+ 𝛽11𝐶𝑜𝑢𝑛𝑡𝑟𝑦 + 𝛽12𝑌𝑒𝑎𝑟 + 𝜀𝑖𝑡
These regressions and their results can demonstrate the types of specific practices that are most advantageous for companies to engage in, in order to avoid financial pressure. In this phase, results may diverge as there is a great deal of uncertainty within the literature regarding the individual effects of our three dimensions on levels of Financial Distress. Despite the challenge this poses in identifying a pattern in terms of our individual dimensions’ results, these regressions will allow us to test Hypothesis 2, Hypothesis 3 and Hypothesis 4.
A traditional threat to the accurate regression analysis is heteroskedasticity, emerging when the size of an error term differs across the values of an independent variable. This issue does not necessarily mean that coefficient estimates are biased or inconsistent, but rather that their variance could be affected, thereby making subsequent OLS standard errors untrustworthy (Wooldridge, 2012). To correct for this issue, a robust standard errors technique is employed in all regressions of this study.
3.4 Summary Statistics
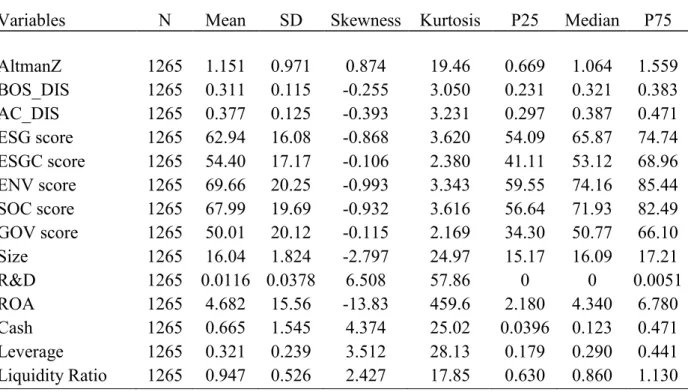
Table 3 reports summary statistics for all variables included in our regressions. Our summary statistics condense the data gathered from a total of 115 companies, all of which originate from 5 Southern European countries, during a timeframe of 11 years, from 2007 to 2017. As regards our dependent variables, our Altman Z score (AltmanZ), along with Almeida and Campello’s (AC_DIS) and Berger et al.’s (BOS_DIS) models of Financial Distress, it becomes evident that the average firm included in the sample possesses an Altman Z score of 1.151. When applying our BOS_DIS and AC_DIS models, we obtain values of 0.311 and 0.377 respectively. In terms of our independent variables, the ESG Score, ESG Combined Score, and the individual scores for performance in our environmental, social and governance dimensions, we obtain an average (median) of 62.94 (65.87), 54.40 (53.12), 69.66 (74.16), 67.99 (71.93) and 50.01 (50.77), respectively. Finally, in terms of our control variables, the businesses in our sample have an average (median) logarithm Book Value of Assets (Size) of 16.04 (16.09), an R&D Intensity of 0.0116 (0.0), an ROA of 4.682 (4.340), a Cash ratio of 0.665 (0.123), a ratio Debt on Total Assets (Leverage) of 0.321 (0.29), and a Liquidity Ratio of 0.947 (0.86). A tolerable range in variation was obtained for all our variables, along with an acceptable level of steadiness among our means and medians, indicating a normality of distributions across the board.
Figure 3 illustrates the evolution of scores obtained throughout the time frame of our analysis. There is a noticeable upward trend in the Environmental Score and Social Score, while the Governance Score remains constant throughout all 11 years. This constancy may slow the growth of the ESG Score, as it is a weighted average of all the three dimensions. Through the evolution of the ESG Combined Score, it appears that the Controversies Score may possess a significant impact in this overall score, with the trends we obtained presenting lower and steadier results when compared to the evolution of the overall ESG Score.
Figure 3 - This figure presents the ESG Scores’ average evolution between 2007 and 2017 for the whole sample.
In order to provide a more realistic and detailed analysis, our sample was divided by country. The following graph illustrates the scores’ evolution by each of the five countries included within our work. Starting with Figure 4, there is a clear upward trend in the ESG Score for the majority of our countries. In France, Greece and Spain, a greater level of awareness regarding the themes of Corporate Social Responsibility is apparent, with our scores evidencing a steady growth over our timeframe. In 2010, Portugal presented the highest values in terms of CSR performance when compared with the other countries in our sample, although the scores’ evolution also demonstrated high levels of unpredictability due to economic and political instability, Finally, we observed lower levels of CSR performance for Italy when compared with our other countries, although it also recorded the most stable levels within our sample, with the lowest level of variance throughout the entirety of our timeframe.
Figure4 - This figure presents the evolution of the ESG Score in each country from 2007 until 2017.
0 20 40 60 80
ESG Score ESG Combined Score Environmental Score Social Score Governance Score
Score 2007 2008 2009 2010 2011 2012 2013 2014 2015 2016 2017 0 20 40 60 80
France Portugal Spain Italy Greece
Score
4. Empirical Results
Before proceeding to the results of our OLS regressions, it is important to check the correlation matrix for multicollinearity among the variables included in each of our regressions. The absence of this econometric issue in our analyses was confirmed throughout our work and is available for perusing in Table 4. None of the independent variables employed in the same regression models has correlation coefficients greater than an accepted standard value.
4.1 OLS Method
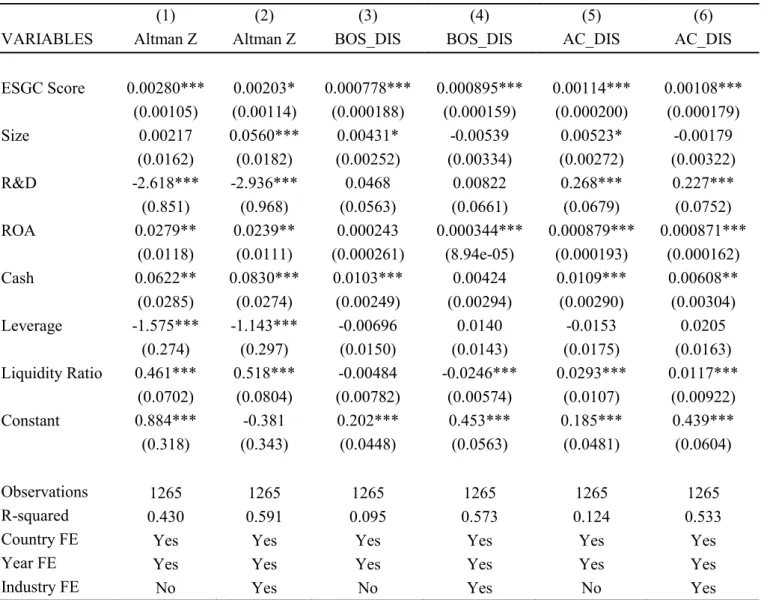
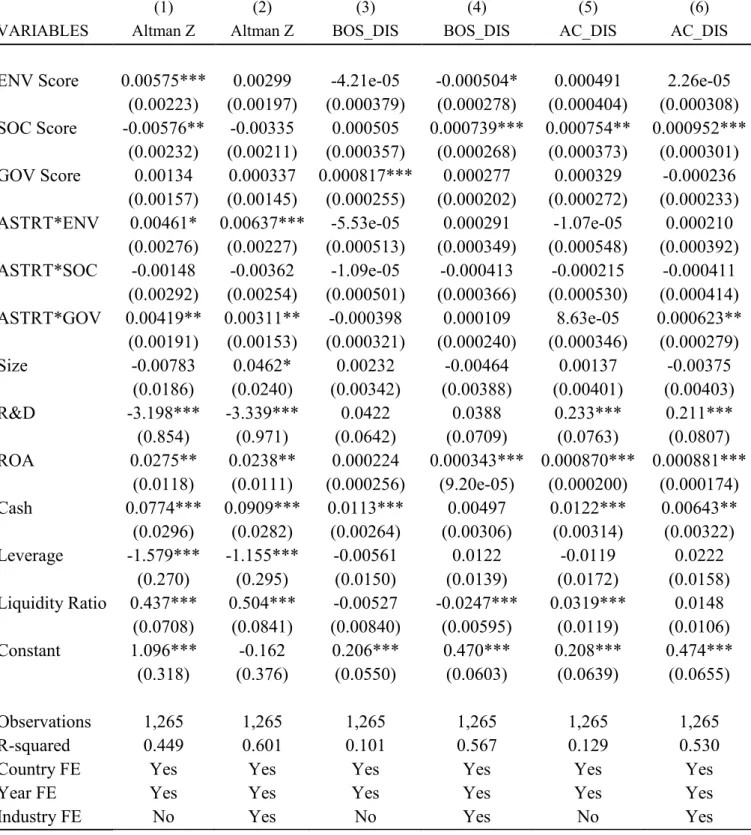
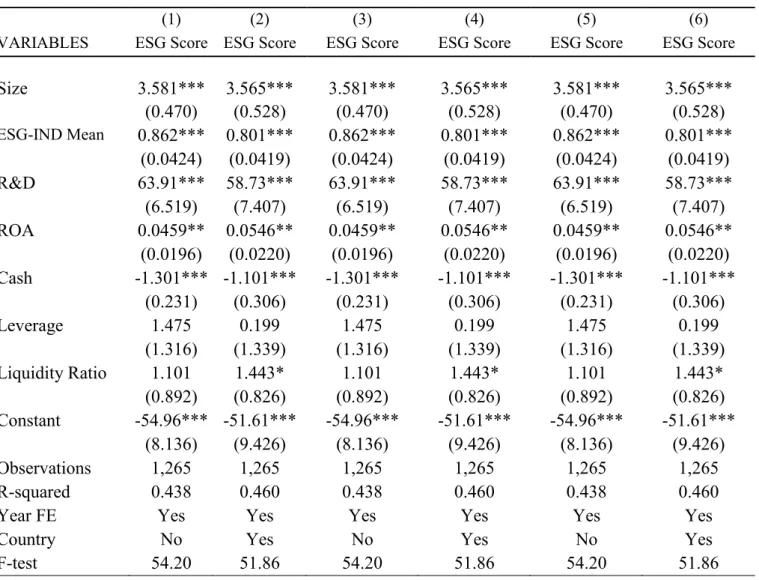
Table 5 reports regression outputs for the relationship between Financial Distress and CSR performance over the 2007-2017 period. In our first (1) regression, the measure of CSR performance matches the ESG Score, with greater values of Financial Distress proxies meaning inferior levels of distress for all our regression analyses. For the majority of our regressions, we were able to detect a positive and statistically significant (p<0.01) relationship between ESG Score and levels of Financial Distress, which suggests the existence of a negative relationship with Financial Distress. These results coincide with the existing literature, which supports that high levels of CSR performance lead to lower levels of Financial Distress, further confirming our H1. Our second (2) regression also provided interesting results, the introduction of a dummy variable for industry resulted in all control variables providing us with results below the ESG Score in a statistically significant manner. Our fourth (4) regression was the only to provide us with statistically significant p-values higher than 1%, corresponding to over 5%. In general, these results suggest that firms engaged in more intensive CSR strategies will tend to decrease their likelihood of facing situations of Financial Distress.
Regarding our control variables, it is clear that in analyses where they present statistically significant values, they present expected effects. Specifically, our Leverage returns negative statistically significant (p < 0.01) regression coefficients for AltmanZ, suggesting that companies with higher levels of indebtedness have increased likelihood of becoming financially constrained. The regression coefficient for Size is positive for AltmanZ in a statistically significant manner (p < 0.05), thus supporting the idea that larger firms are able to wield higher financial and political influence than smaller firms, in turn suggesting that they are less likely to experience Financial Distress. Moreover, R&D returns negative statistically significant (p < 0.01) regression coefficients for AltmanZ, meaning that firms with higher levels of R&D
investment are more likely to increase their likelihood of entering into situations of Financial Distress. There is a surprisingly result for that variable however, as it shows a positive relationship with AC_DIS. ROA and Cash in turn, demonstrate statistically significant (p < 0.05 or better) positive coefficients for the majority of our regressions. The regression coefficient for Liquidity Ratio is positive for both AltmanZ and AC_DIS at a statistically significant (p < 0.05 or better) level, while seemingly indicates a negative relationship with BOS_DIS.
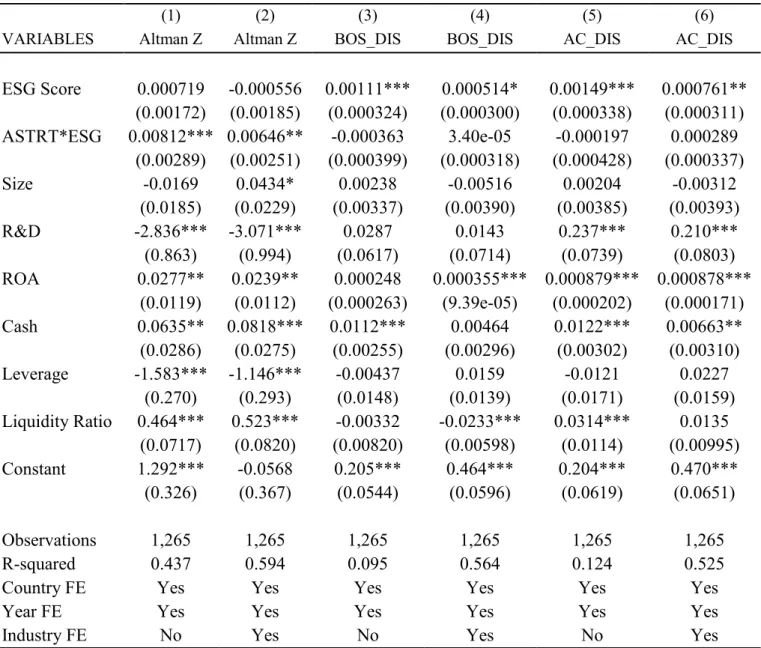
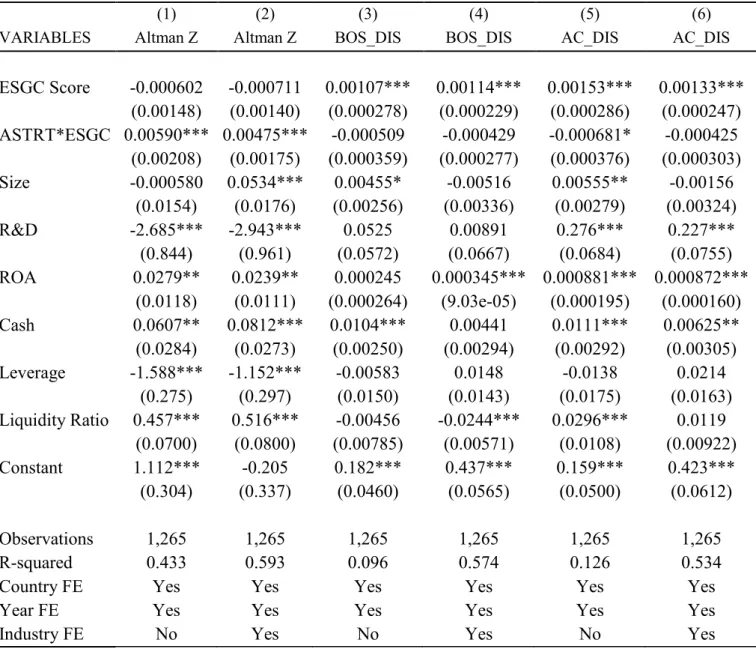
Table 6 shows our regressions’ results regarding the impact of the ESG Combined Score explanatory variable, estimated against levels of Financial Distress, these are once more checked along our AltmanZ, BOS_DIS and AC_DIS models. The subsequent results are similar comparing to our first set of regressions. For equations (1), and (3) to (6), the ESG Combined Score (ESGC Score) is positive and statistically significant at the 1% level. Equation (2) is the only that returns statistically significant values at the 10% level instead. These results support the idea that firms with higher levels of positive CSR performance are less likely to find themselves in situations of Financial Distress, thereby concurring with H1. Furthermore, these results imply that the weight given to controversies and corporate scandals is not strong enough to decrease the total ESG Score. There is also a possibility that the companies in this sample simply did not engage in disgraceful practices and activities at significantly high levels. During the evaluation of our control variables it becomes clear that Size is positively associated with our measures of Financial Distress and statistically significant (p < 0.10 or better) for equations (2), (3) and (5). R&D is consistent in returning statistically significant (p < 0.01) negative regression coefficients for AltmanZ, while hinting at a positive relationship with AC_DIS. ROA exhibits statistically significant (p < 0.01) positive regression coefficients for all equations, with the exception of equation (3) which does not return statistically significant values. The same happens for Cash in equation (4), with this variable adding no statistical significance to the model, despite its statistical significance for our other equations (p<0.05 or better). As for our first group of regressions, Leverage is negative for AltmanZ at a statistically significant level (p < 0.01). Finally, the results for Liquidity Ratio further confirm the results we obtained from our first group of regressions (Table 5).
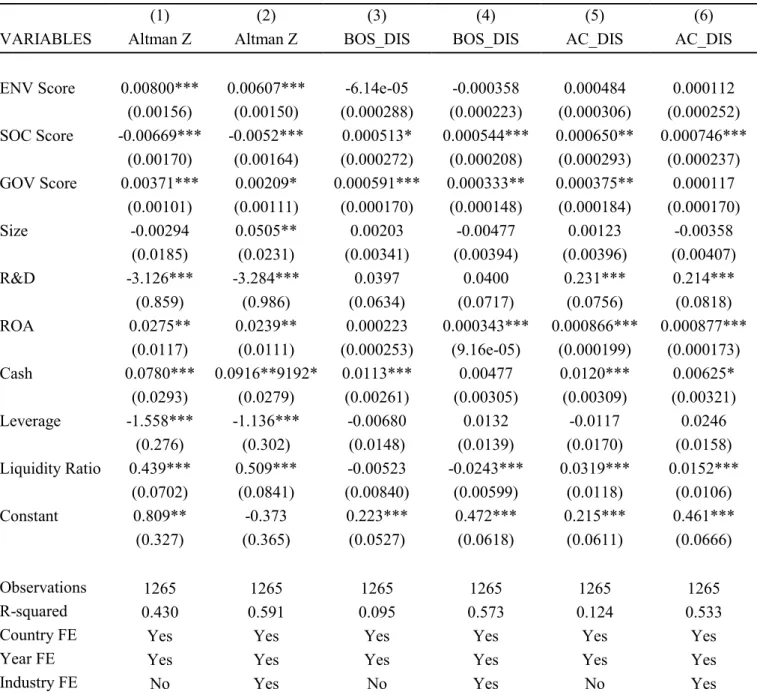
Lastly, Table 7 reports the outputs on the third set of regressions. Throughout this phase of our research, results proved to be too inconsistent and not statistically significant enough for valuable conclusions.
Beginning with our analysis of the Environmental Score (ENV Score), it presented statistically significant (p < 0.01) positive regression coefficients for AltmanZ, supporting our H2, but it did not manage to gain additional statistical significance when considering the BOS_DIS and AC_DIS models. The Social Score (SOC Score) analyses however, provided us with the most unexpected results in our regression analysis, returning a statistically significant and positive value for equations (3) to (6), and negative and statistically significant (p < 0.01) values for AltmanZ. The variable Governance Score (GOV Score) in turn, exhibited statistically significant (p < 0.01) positive regression coefficients for all equations, with the exception of equation (6) which is not statistically significant. These results concur with H4. In terms of the overall control variables, Size was positively associated at a statistically significant level (p < 0.05) only for equation (2), while R&D returned statistically significant (p < 0.01) negative regression coefficients for AltmanZ, despite showing a positive relationship with AC_DIS. Leverage was shown to be statistically significant only when tested for AltmanZ, while ROA demonstrated statistically significant (p < 0.05 or better) positive regression coefficients for all equations except for (3), but not at a statistically significant level in that particular case. Cash returned positive and statistically significant results for all equations except (4). Finally, the regression coefficient for Liquidity Ratio was positive for AltmanZ and AC_DIS at a statistically significant level (p < 0.01 or better), despite showing a negative relationship with BOS_DIS.
Regarding the interpretation of our results, there is a clear positive association between the individual Environmental Score and the AltmanZ score. This particular result agrees with the theory that focusing on environmentally responsible practices creates positive stakeholder perception, which in turn positively influences a firm’s economic performance (Schnietz and
Epstein, 2005; Gray and Shadbegian, 1993), therefore reducing the likelihood of Financial Distress. In the case of the Social Score, there is less clarity as to the consequences of our results, with clear positive links within our BOS_DIS and AC_DIS models, but a negative association with AltmanZ. This uncertainty may occur due to the nature of our dependent variables. Although these three measures serve as proxies for Financial Distress, the theories and content behind their creation differ greatly. AltmanZ corresponds to an accounting method