Subtidal Rocky Shore Communities of the Azores:
Developing a Biotope Survey Method
Francisco F.M.M. Wallenstein
†, Ana I. Neto
†, Nuno V. A
´ lvaro
†, and Ian Tittley
‡ †Universidade dos Ac¸oresCIRN, Grupo de Ficologia, Departamento de Biologia
Rua da Ma˜e de Deus, 52
Apartado 1422, 9501-801 Ponta Delgada Sa˜o Miguel, Ac¸ores, Portugal
‡Botany Department Natural History Museum Cromwell Road
London SW7 5DB, United Kingdom
ABSTRACT
WALLENSTEIN, F.F.M.M.; NETO, A.I.; A´ LVARO, N.V., and TITTLEY, I., 2008. Subtidal rocky shore communities of the Azores: Developing a biotope survey method. Journal of Coastal Research, 24(1A), 244–249. West Palm Beach (Florida), ISSN 0749-0208.
At 23 sites selected randomly around the island of Sa˜o Miguel (Azores), video records were made at the depths of 5, 10, 15, 20, 25, and 30 m where a rocky substratum was present. Semiquantitative abundance data of the most common benthic organisms (algae and fixed/sedentary macroinvertebrates) were recorded in the vicinity of each depth reference point. Qualitative samples of the more conspicuous organisms were taken for confirmation of identification in the laboratory. At each site, substratum type, geographical orientation, and depth level were recorded. Multivariate ysis (nonmetric multidimensional scaling; analysis of similarity [Anosim] tests; similarity percentages [Simper] anal-ysis) on the collected data enabled patterns of community distribution to be identified, as well as their relationship to abiotic factors. Since depth was found to be the sole determining factor for communities, it was the only one considered in the subtidal biotope survey protocol proposed here.
ADDITIONAL INDEX WORDS: Methodologies, rocky shores, quantification, image.
INTRODUCTION
Coastal ecosystem and community classifications for man-agement purposes have been developed recently in the Eu-ropean Union and United States (CONNORet al., 1997; HIS -COCK, 1995; MUMBY and HARBORNE, 1999; ZACHARIASand ROFF, 2000) and the marine biotope classification for Great Britain and Ireland by CONNORet al. (1997, 2003, 2004) is one of the most comprehensive. It is a hierarchical model that can be applied to any ecosystem and includes a larger habitat definition that coincides with the main divisions of the litto-ral zone. It contains subdivisions into habitat complexes and further into biotope complexes based on substrate categories and/or hydrodynamic features. These are further subdivided into biotopes according to the dominant and/or more abun-dant species at each location; subbiotopes are based on other noteworthy species. TITTLEY and BARTSCH (unpublished data) tested the British biotope classification on the North Sea island of Helgoland using numerical methods, and, in some cases where it proved difficult to determine biotopes precisely in the field, numerical analysis also produced un-clear results. ZACHARIAS, MORRIS, and HOWES(1999) devel-oped a model that allies the applicability of CONNOR et al. (1997) to larger scales with the possibility of predicting com-munities based on the physical characteristics of the habitat.
DOI:10.2112/05-0590.1 received 14 September 2005; accepted in re-vision 12 April 2006.
Although comprehensive, the abovementioned studies are essentially descriptive and the methodologies provided are not directly applicable to the Azores. The islands of the Azores are situated near the middle Atlantic Ocean (37⬚40⬘N and 25⬚31⬘W) and are exposed to medium and high levels of wave action and have a very restricted coastal zone with a depth of 1000 m at 200 m offshore. The shores of these vol-canic islands have a varying geomorphology, with cliffs alter-nating with rocky beaches of irregular rock sizes (BORGES, 2004; MORTON, BRITTON, and MARTINS, 1998) that provide habitat for a wide variety of fauna and flora. A recent prelim-inary classification of Azorean marine biotopes (TITTLEYand NETO, 2000) revealed structural and functional differences between Azorean and Northern European biotopes. Method-ologies and guidelines used by ZACHARIAS, MORRIS, and HOWES(1999) and CONNORet al. (1997) are not directly ap-plicable to the Azores because of its shore geomorphology and lack of continental shelf, with wave dynamics creating a dif-ferent environment for algal communities to develop. The most striking feature in the Azores is the absence of the large canopy-forming brown algae that dominate Northern Euro-pean shores in sheltered and moderately wave-exposed situ-ations. Fucus spiralis is sporadic in the Azores, while Lami-naria ochroleuca is known from deep water at only one lo-cation. Other large brown algae (Cystoseira spp., Sargassum spp.) characterise sheltered deep pools, lagoons, sublittoral fringe, and subtidal rocks but are not canopy forming like the fucoids and kelps. The sea shores of the Azores at both
in-tertidal and sublittoral levels are mainly dominated by algal turfs, 1–3 cm in height, that cover the rocks as a carpet (NETO, 2001). Intertidal communities are often characterised by multispecific turfs, a feature shared with other parts of Macaronesia and West Africa. The vertically zoned commu-nities of Gelidium microdon, Corallina elongata, Pterocladiel-la capilPterocladiel-lacea, Asparagopsis armata, and Codium adhaerens occur widely in the Azores (NETO2000; NETOand TITTLEY, 1995; TITTLEYand NETO, 2000; TITTLEY, NETO, and FARN -HAM, 1998) and create a distribution pattern intermediate between that on temperate shores where canopy-forming al-gae are often visually obvious and characterizing components of the biota (e.g., BARTSCH and TITTLEY, 2004) and tropical shores, which are usually characterised by algal turfs and invertebrates (e.g., FOSTER-SMITHet al., 2001; NETO, 2000).
Recent studies of biotopes and species assemblages on in-tertidal shores (WALLENSTEIN and NETO, 2006) revealed varying occurrences according to substrate category, shore height, and wave exposure. The (WALLENSTEIN and NETO, 2006) study also defined a standard method for future inter-tidal biotope surveys in the Azores. This paper presents the results of a preliminary study on the subtidal communities of the Azores from which a protocol for future biotope surveys in the Azores is proposed. The approach presented here for the Azores is potentially applicable elsewhere in Macaronesia and possibly other biogeographical regions where turf assem-blages prevail. The creation of a prescribed methodology for wider use is determined by the need for comparability of re-sults.
METHODS Site Selection
Rocky shore study sites around the island of Sa˜o Miguel were selected randomly by overlying a 2 km⫻ 2 km grid on a map of the island. The grid intersections around the coast-line created a pool of potential study sites numbered 1 to 71. Since most intersections did not fall directly on the coastline, a study site was located by a north or south or east or west landward projection from a numbered intersection. Sampling sites were selected from the pool of 71 using random num-bers. The total number of sites to be studied was not defined a priori; study ceased at the end of the summer period when sea conditions prevented further work. Altogether 23 sites were studied.
Field Study
All sites were studied by SCUBA diving to a maximum depth of 30 m for safety reasons (JOINER, 2001). At each site habitats where hard substrate was present were studied at reference depths of 5, 10, 15, 20, 25, and 30 m along a tran-sect and were filmed using a video camera (Sony DCR-TRV 240 E inside an Aquatica aluminium casing). An overview was taken at each depth reference point by slowly rotating the video camera through 360⬚. Algae and macroinvertebrate species and assemblages at the reference depths were then filmed. After fieldwork, film was edited using the software iMovie 3.0.3 for Macintosh, saved in Quicktime format, and
compiled in DVD format as a permanent record for checking purposes. The substratum at each study site was classified by direct observation into three categories: cobbles, boulders, and bedrock (WALLENSTEINand NETO, 2006). The most com-mon algae and macroinvertebrates were recorded in the vi-cinity of each depth reference point semiquantitatively using the DAFOR scale (D, dominant,⬎75%; A, abundant, 50–75%; F, frequent, 25–50%; O, occasional, 5–25%; R, rare, ⬍5%; NETO, 1997). Qualitative samples of the more conspicuous algae were taken for confirmation of identification in the lab-oratory.
Data Treatment and Analysis
Data (species and their DAFOR abundances at every depth at each study site) were analysed numerically using the Primer v. 6 software package (CLARKEand WARWICK, 2001). Nonmetric multidimensional scaling (nmMDS) was used to express the Bray Curtis similarity of depth recordings at sites based on the species present and their abundance. Results were expressed as two-dimensional plots in which the sepa-ration of sample points indicated the degree of similarity. Points in the plots were subsequently labelled with geograph-ical, substratum and depth information to facilitate interpre-tation. Analysis of similarity (Anosim), a nonparametric pro-cedure applied to the rank similarity matrix underlying the ordination of site recordings, was used to test the significance of the grouping in the nmMDS plot of sample points against abiotic factors. The similarity percentages (Simper) analysis, species contribution to similarity, was used to identify the species responsible for separating points in the plots.
RESULTS AND DISCUSSION
Sixteen biological categories were identified from the video recordings, based on the most conspicuous subtidal organ-isms of Azorean shores. These were (cf. WALLENSTEINand NETO, 2006): Asparagopsis/Falkenbergia, calcareous crusts, Calcareous turf, Codium elizabethiae, Dictyota bartayrsiana, Dictyota dichotoma, Dictyota volubilis, Halopteris filicina, Jania longifurca, Peyssonnelia sp., P. capillacea, Stypocaulon scoparium, noncalcareous turf, Zonaria tournefortii, hydro-zoans, and sponges.
The results of the nmMDS analysis based on the semi-quantitative abundances in the above categories are given in Figures 1–3. The results for the Anosim and Simper tests are given in Tables 1–3.
Geographical Aspect
No clear grouping was identified in the nmMDS plot when the geographical aspect of the sampling sites was overlaid (Figures 1a and b). The most evident pattern that could be identified in Figure 1a was the greater spread of recording sites from the north (#), west (⽧), and southwest (䉭) sides of the island when compared with those from east (䡵), north-east (□), and south (䉱). This pattern was maintained when data were transformed into presence–absence (which empha-sizes rare species) with neither the more conspicuous species nor the rare ones influencing the distribution of points in the plot (Figure 1b).
Figure 1. nmMDS plots (stress 0.17) with recording sites labelled by geographical aspect (a, untransformed data; b, presence–absence data; S,
䉱; SW,䉭; E,䡵; NE,□; W,⽧; N,#).
Figure 2. MDS plot (stress 0.17), for untransformed data, where sample quadrats are labelled by the substratum category where they were read (bedrock,䉱; boulders,䉭; cobbles,䡵; boulders⫹bedrock,□; boulders⫹ cobbles,⽧; bedrock⫹cobbles,䡩; tetrapods,#).
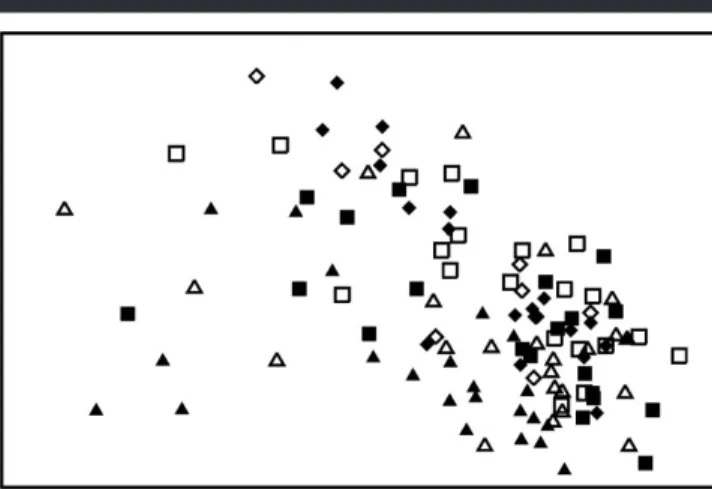
Figure 3. nmMDS plot (stress 0.17) of untransformed data with depths of recording sites (5 m,䉱; 10 m,䉭; 15 m,䡵; 20 m,□; 25 m,⽧; 30 m,
#).
Substrata
Adding substratum information to the ordination showed no clear trends or grouping, and all substrata categories over-lapped with each other (Figure 2). A high stress value sup-ports this. The low number of recording sites with cobbles (䡵, substratum C) indicated the low abundance of this type of substratum around the island, since selection of study sites was random.
The results of the Anosim pairwise comparisons, based on random permutations, gave a global R value near to zero (Ta-ble 1), which indicated no significant differences between re-cording sites, and thus substratum type does not have any impact in community composition. This is consistent with the nmMDS plot, which also showed no differences between sub-stratum types.
Depth
Depth differences or a gradient in community structure were not easily identifiable from the nmMDS plot, and the
lack of differences was confirmed by a high stress value (Fig-ure 3). Closer inspection of the plot suggested separation of some recording sites between the shallowest (䉱, 5 m) and deepest (#, 30 m) levels, but intermediate levels (䉭, 䡵, □, and⽧) were intermingled and indicated the patchy pattern of algal communities associated with rocky substrata in the Azores.
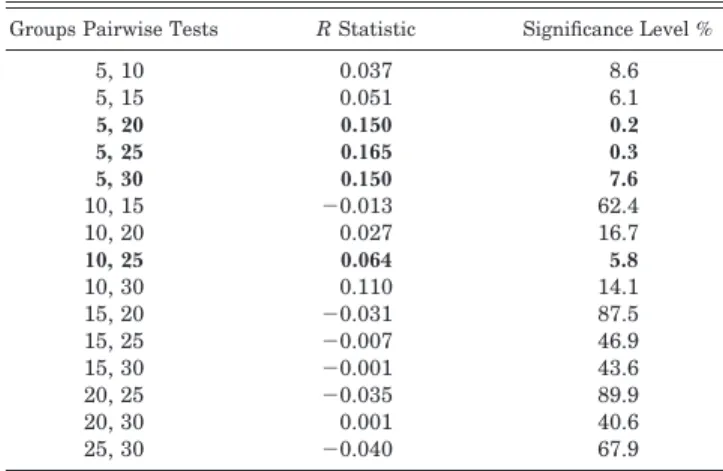
The Anosim tests (Table 2) for significant differences be-tween recording sites at differing depths identified significant separation between 5 m and below 20 m, and between 10 and 25 m. In contrast, the very low global R value indicated no significant differences in community composition across re-cording sites at all depths.
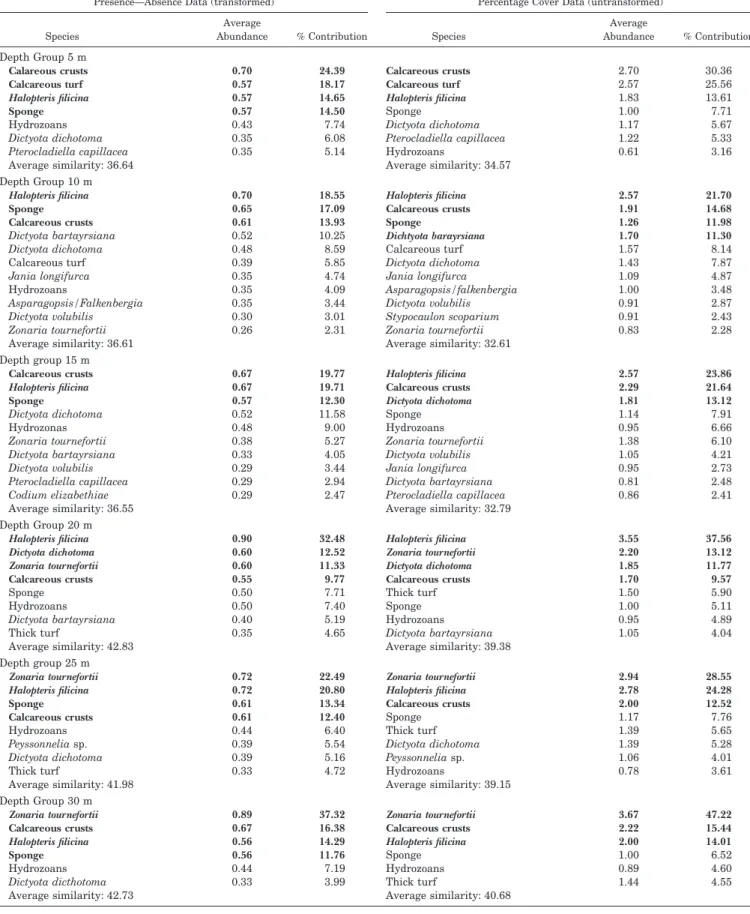
The results of a one-way Simper analysis on untransformed data showed the transition of communities with increased depth (Table 3). The average similarity within depth groups was relatively low, but it was consistently higher at deeper
Table 1. ANOSIM global test for substrata; sample statistic (global R),
⫺0.035 significance level of sample statistic, 78.6%; number of permuta-tions, 999 (random sample from a large number); number of permuted statistics greater than or equal to global R, 785 (R, bedrock; B, boulders; C, cobbles; bold rows indicate a significant result).
Groups Pairwise Tests R Statistic Significance Level % R, B + R R, B R, B + C R, T R, C ⫺0.066 0.007 ⫺0.064 ⫺0.073 0.032 66.7 34.7 67.1 62.1 33.9 R, R + C B + R, B B + R, B + C B + R, T B + R, C ⫺0.202 ⫺0.119 0.07 ⫺0.04 0.552 79 83.3 16.3 56.2 3.6 B + R, R + C B, B + C B, T B, C B, R + C ⫺0.244 ⫺0.053 ⫺0.13 ⫺0.022 ⫺0.245 71.4 66.1 82.4 45.9 79.4 B + C, T B + C, C B + C, R + C T, C T, R + C C, R + C 0.132 0.396 0.102 0.214 ⫺0.083 ⫺1 18.5 8.3 37.5 20 60 100
Table 2. ANOSIM global test for depth; sample statistic (global R), 0.045; significance level of sample statistic, 1.5%; number of permutations, 999 (random sample from a large number); number of permuted statistics greater than or equal to global R, 14 (bold rows indicate a significant result).
Groups Pairwise Tests R Statistic Significance Level % 5, 10 5, 15 5, 20 5, 25 5, 30 0.037 0.051 0.150 0.165 0.150 8.6 6.1 0.2 0.3 7.6 10, 15 10, 20 10, 25 10, 30 15, 20 ⫺0.013 0.027 0.064 0.110 ⫺0.031 62.4 16.7 5.8 14.1 87.5 15, 25 15, 30 20, 25 20, 30 25, 30 ⫺0.007 ⫺0.001 ⫺0.035 0.001 ⫺0.040 46.9 43.6 89.9 40.6 67.9
levels. The results showed (1) the 5-m depth level to be main-ly characterised by the exclusive presence of calcareous algal turf characteristic of the transition from the intertidal to the subtidal zones, (2) at 10–20 m the presence of Dictyota spp. as the most striking feature, and (3) at 20–30 m the occur-rence of Z. tournefortii, characteristic of deeper levels; calcar-eous crusts, H. filicina and sponges were well distributed along the whole depth gradient.
CONCLUSIONS
Results for the geographical aspect of recording sites indi-cated no floristic differences on the north, south, east, and west coasts and that the entire island can be considered uni-form for random selection of study sites. Results also show that there are no significant differences in algal assemblages on differing substrata, unlike at intertidal levels (WALLEN -STEINand NETO, 2006), and future studies should not take this factor into consideration. The composition of the com-munities derived from the Simper analysis (Table 3) based on average abundances of species at each depth level also represented a first attempt at biotope definition. This prelim-inary result gave an indication of the species to be used in a biotope classification.
The definition of a precise method for community charac-terization and consequent biotope identification is important for comparison studies in space and time. The method devel-oped for the island of Sa˜o Miguel, detailed iteratively below, is systematic and recognizes the need to collect data in a structured and systematic way, as is usual in quantitative ecological studies. Published information on algal communi-ties in the Azores (NETOand TITTLEY, 1995; TITTLEY, NETO, and FARNHAM, 1998) indicates that the method will have
wider application in the Azores archipelago and throughout Macaronesia.
BIOTOPE SURVEY PROTOCOL
The results of this preliminary survey and analysis suggest that future surveys should undertake stratified sampling along a depth gradient between the two extreme depth levels, 5 and 30 m, likely to show differences in community struc-ture. Two intermediate (transition) levels should be studied to establish whether or not recordings at these levels asso-ciate more closely with those at upper or lower levels. To reduce variation within depth levels, sampling should be re-stricted to 2-m depth ranges, with depth intervals of 6 m between (i.e., 4–6, 12–14, 20–22, and 28–30 m). Thus, the model for future biotope survey methods on Sa˜o Miguel sug-gests that location is nested in each depth level, and six lo-cations will be studied at each depth level, with three repli-cated recordings made at each location.
Field Method
(1) Six locations per depth level to be selected randomly. (2) The first sample quadrat to be placed by chance at the
middle depth level (i.e., 5, 13, 21, 29 m).
(3) Subsequent quadrats to be recorded in a direction and distance from each other determined by two-digit random numbers (11 to 89 for which the second digit dictates the distance 1 to 9 m, while the first digit dictates direction, 1, north; 2, northeast; 3, east; 4, southeast; 5, south; 6, southwest; 7, west; 8, northwest). Random numbers re-quiring sampling outside the depth range to be ignored. (4) Percentage cover of algal species to be recorded in three
replicate readings of three 0.50 m ⫻ 0.50 m quadrats (nine in total, see NETO, 1997).
(5) Algae, sponges, hydrozoans, and bryozoans to be recorded quantitatively using the point-to-point method (HAWKINS and JONES, 1992).
Table 3. SIMPER analysis results showing average abundance of species/ecological classes at each depth level, and their percentage contribution to the similarity of recording sites at each depth level for both presence—absence data (transformed data, left-hand side) and percentage cover data (untransformed data, right-hand side). Bold species/ecological classes: (i) presence/absence, average abundance⬎0.55; (ii) percentage cover, percentage contribution⬎ 9.5%).
Presence—Absence Data (transformed)
Species
Average
Abundance % Contribution
Percentage Cover Data (untransformed)
Species Average Abundance % Contribution Depth Group 5 m Calareous crusts Calcareous turf Halopteris filicina Sponge Hydrozoans Dictyota dichotoma Pterocladiella capillacea Average similarity: 36.64 0.70 0.57 0.57 0.57 0.43 0.35 0.35 24.39 18.17 14.65 14.50 7.74 6.08 5.14 Calcareous crusts Calcareous turf Halopteris filicina Sponge Dictyota dichotoma Pterocladiella capillacea Hydrozoans Average similarity: 34.57 2.70 2.57 1.83 1.00 1.17 1.22 0.61 30.36 25.56 13.61 7.71 5.67 5.33 3.16 Depth Group 10 m Halopteris filicina Sponge Calcareous crusts Dictyota bartayrsiana Dictyota dichotoma 0.70 0.65 0.61 0.52 0.48 18.55 17.09 13.93 10.25 8.59 Halopteris filicina Calcareous crusts Sponge Dichtyota barayrsiana Calcareous turf 2.57 1.91 1.26 1.70 1.57 21.70 14.68 11.98 11.30 8.14 Calcareous turf Jania longifurca Hydrozoans Asparagopsis/Falkenbergia Dictyota volubilis Zonaria tournefortii Average similarity: 36.61 0.39 0.35 0.35 0.35 0.30 0.26 5.85 4.74 4.09 3.44 3.01 2.31 Dictyota dichotoma Jania longifurca Asparagopsis/falkenbergia Dictyota volubilis Stypocaulon scoparium Zonaria tournefortii Average similarity: 32.61 1.43 1.09 1.00 0.91 0.91 0.83 7.87 4.87 3.48 2.87 2.43 2.28 Depth group 15 m Calcareous crusts Halopteris filicina Sponge Dictyota dichotoma Hydrozonas Zonaria tournefortii Dictyota bartayrsiana 0.67 0.67 0.57 0.52 0.48 0.38 0.33 19.77 19.71 12.30 11.58 9.00 5.27 4.05 Halopteris filicina Calcareous crusts Dictyota dichotoma Sponge Hydrozoans Zonaria tournefortii Dictyota volubilis 2.57 2.29 1.81 1.14 0.95 1.38 1.05 23.86 21.64 13.12 7.91 6.66 6.10 4.21 Dictyota volubilis Pterocladiella capillacea Codium elizabethiae Average similarity: 36.55 0.29 0.29 0.29 3.44 2.94 2.47 Jania longifurca Dictyota bartayrsiana Pterocladiella capillacea Average similarity: 32.79 0.95 0.81 0.86 2.73 2.48 2.41 Depth Group 20 m Halopteris filicina Dictyota dichotoma Zonaria tournefortii Calcareous crusts Sponge Hydrozoans Dictyota bartayrsiana Thick turf Average similarity: 42.83 0.90 0.60 0.60 0.55 0.50 0.50 0.40 0.35 32.48 12.52 11.33 9.77 7.71 7.40 5.19 4.65 Halopteris filicina Zonaria tournefortii Dictyota dichotoma Calcareous crusts Thick turf Sponge Hydrozoans Dictyota bartayrsiana Average similarity: 39.38 3.55 2.20 1.85 1.70 1.50 1.00 0.95 1.05 37.56 13.12 11.77 9.57 5.90 5.11 4.89 4.04 Depth group 25 m Zonaria tournefortii Halopteris filicina Sponge Calcareous crusts Hydrozoans Peyssonnelia sp. Dictyota dichotoma Thick turf Average similarity: 41.98 0.72 0.72 0.61 0.61 0.44 0.39 0.39 0.33 22.49 20.80 13.34 12.40 6.40 5.54 5.16 4.72 Zonaria tournefortii Halopteris filicina Calcareous crusts Sponge Thick turf Dictyota dichotoma Peyssonnelia sp. Hydrozoans Average similarity: 39.15 2.94 2.78 2.00 1.17 1.39 1.39 1.06 0.78 28.55 24.28 12.52 7.76 5.65 5.28 4.01 3.61 Depth Group 30 m Zonaria tournefortii Calcareous crusts Halopteris filicina Sponge Hydrozoans Dictyota dicthotoma Average similarity: 42.73 0.89 0.67 0.56 0.56 0.44 0.33 37.32 16.38 14.29 11.76 7.19 3.99 Zonaria tournefortii Calcareous crusts Halopteris filicina Sponge Hydrozoans Thick turf Average similarity: 40.68 3.67 2.22 2.00 1.00 0.89 1.44 47.22 15.44 14.01 6.52 4.60 4.55
(6) The number of point intersections at which each species occurs to be counted (maximum of 36).
(7) Voucher specimens to be taken for confirmation of iden-tification in the laboratory.
(8) Macroinvertebrate recording (sea urchins, sea stars, sea cucumbers, tube worms, and fire worms) to be undertak-en within a minimal sampling area of 1.5 m⫻ 15 m rep-licated three times (see MARTINSet al., 2005) in which the groups of organisms above are counted.
Data Treatment
(1) Percentage cover of benthic organisms to be entered into a spreadsheet for each sample area.
(2) Data imported to the software Primer v. 6.
(3) MDS analysis to be used to identify grouping of samples according to different abiotic factors.
(4) Anosim to be used to test the significance of groups iden-tified.
(5) Simper analysis to identify the species that contribute to the separation of samples according to factor, and to sug-gest a preliminary biotope classification, for both trans-formed data (presence–absence) and untranstrans-formed data. (6) Species relevant for biotope definition to be chosen
ac-cording to both following criteria:
a. Average abundance ⬎ 0.55 (for presence–absence data).
b. Percentage contribution ⬎ 9.5% (for untransformed data).
ACKNOWLEDGMENTS
The authors wish to thank Dr. Kenneth Robert Clarke of the Plymouth Marine Laboratory for helping with the data treatment and interpretation, the firm NERUS for supplying a boat, skipper, and some SCUBA gear when necessary, and Joa˜o Brum and Pedro Raposeiro for helping with field work. We also thank the anonymous referees who helped improve the manuscript. This work was funded by the project POC-TIMGS/54319/2002, Biotope, Classification, Mapping, and Modelling of Azores Littoral Biotopes, and supported also by CIRN-Centro de Investigac¸a˜o de Recursos Naturais, both from Fundac¸a˜o para a Cieˆncia e Tecnologia (Portugal). The work performed in the present study complies with the cur-rent laws of Portugal.
LITERATURE CITED
BARTSCH, I. and TITTLEYI., 2004. The rocky intertidal biotopes of Helgoland: Present and past. Helgoland Marine Research, 58, 289– 302.
BORGES, P., 2004. Ambientes litorais nos grupos Central e Oriental
do arquipe´lago dos Ac¸ores, conteu´dos e dinaˆmica de microescala. Ponta Delgada, Portugal: Universidade dos Ac¸ores, Ph.D. thesis, 413p.
CLARKE, K.R. and WARWICK, R.M., 2001. Change in Marine
Com-munities: An Approach to Statistical Analysis and Interpretation (2nd edition). Plymouth, UK: PRIMER-E, 176p.
CONNOR, D.W.; ALLEN, J.H.; GOLDING, N.; HOWELL, K.L.; LIEBER
-KNECHT, L.M.; NORTHEN, K.O., and REKERJ.B., 2004. The
Ma-rine Habitat Classification for Britain and Ireland (version 04.05). Peterborough, UK: Joint Nature Conservation Committee. www.jncc.gov.uk/MarineHabitatClassification (accessed May 6, 2006).
CONNOR, D.W.; ALLEN, J.H.; GOLDING, N.; LIEBERKNECHT, L.M.; NORTHEN, K.O., and REKER, J.B., 2003. The National Marine
Habitat Classification for Britain and Ireland (version 03.02). Pe-terborough, UK: Joint Nature Conservation Committee. www.jncc.gov.uk/marinehabitatclassification (accessed November 4, 2003).
CONNOR, D.; BRAZIER, D.P.; HILL, T.O., and NORTHEN, K.O., 1997. Marine Nature Conservation Review: Marine Biotope Classifica-tion for Britain and Ireland, Volume 1. Littoral biotopes (version 97.06). Peterborough, UK: Joint Nature Conservation Committee, Report no. 229, 361p.
FOSTER-SMITH, B.; ANTIA, E.; KENDALL, M.; JOHN, D., and SEKU,
F., 2001. Shore biotopes of West Africa—An introduction to bio-tope mapping. University of Newcastle, Institute of Oceanogra-phy—University of Calabar, The Natural History Museum, Uni-versity of Ghana, Plymouth Marine Laboratory, Darwin Initiative Report 3, Ref. 162/7/451.
HAWKINS, S.J. and JONES, H.D., 1992. Marine Field Course Guide.
1. Rocky Shores. Marine Conservation Society. London, UK: Immel Publications, 144p.
HISCOCK, K. (ed.), 1995. Classification of benthic marine biotopes of the north-east Atlantic. In: Proceedings of a BioMar-Life Workshop (Cambridge, UK; 16–18 November 1994). Peterborough, Joint Na-ture Conservation Committee.
JOINER, J.T. (ed.), 2001. NOAA Diving Manual, Diving for Science and Technology (fourth edition). Flagstaff: Best Publishing Com-pany, 660p.
MARTINS, G.M.; WALLENSTEINF.F.M.; A´LVARO, N.V.; NETO, A.I.
and COSTA, A.C., 2005. Sampling strategies for biotope definition: Minimal sampling area for selected groups of macroinvertebrates in the rocky subtidal of Sa˜o Miguel, Azores. Helgoland Marine Re-search, 59, 219–223.
MORTON, B.; BRITTON, J.C., and MARTINS, A.M.F., 1998. Coastal Ecology of the Azores. Ponta Delgada, Portugal: Sociedade Afonso Chaves, 249p.
MUMBY, P.J. and HARBORNE, A.R., 1999. Development of a
system-atic classification scheme of marine habitats to facilitate regional management and mapping of Caribbean coral reefs. Biological Conservation, 88, 155–163.
NETO, A.I., 1997. Studies on algal communities of Sa˜o Miguel,
Azores. Ponta Delgada, Portugal: Universidade dos Ac¸ores, Ph.D. thesis, x⫹309p.
NETO, A.I., 2000. Ecology and dynamics of two intertidal algal com-munities on the littoral of the Island of Sa˜o Miguel (Azores). Hy-drobiologia, 432, 135–147.
NETO, A.I., 2001. Macroalgal species diversity and biomass of
sub-tidal communities of Sa˜o Miguel (Azores). Helgoland Marine Re-search, 55, 101–111.
NETO, A.I. and TITTLEY, I., 1995. Structure and Zonation of algal turf communities on the Azores: A numerical approach. Boletim do Museu Municipal do Funchal, Sup. 4, 487–504.
TITTLEY, I. and NETO, A.I., 2000. A provisional classification of algal
characterized rocky shore biotopes in the Azores. Hydrobiologia. 440(1), 19–25.
TITTLEY, I.; NETO, A.I., and FARNHAM, W.F., 1998. Marine algae of the island of Flores, Azores: Ecology and floristics. Boletim do Mu-seu Municipal do Funchal, Sup. 5, 463–479.
WALLENSTEIN, F.F.M.M. and NETOA.I., 2006. Intertidal rocky shore
biotopes of the Azores: A quantitative approach. Helgoland Marine Research, 60, 196–206.
ZACHARIAS, M.A. and ROFF, J.C., 2000. A hierarchical ecological
ap-proach to conserving marine biodiversity. Conservation Biology, 14(5), 1327–1334.
ZACHARIAS, M.A.; MORRIS, M.C., and HOWES, D.E., 1999. Large
scale characterisation of intertidal communities using a predictive model. Journal of Experimental Marine Biology and Ecology, 239, 223–242.