Economics
Society
EHES WORKING PAPERS IN ECONOMIC HISTORY | NO. 113
Portugal’s wine globalization waves, 1750-2015
Pedro Lains
Institute of Social Sciences, University of Lisbon
EHES Working Paper | No. 113 |May 2017
Portugal’s wine globalization waves, 1750-2015*
Pedro Lains
Institute of Social Sciences, University of Lisbon
Abstract
From 1750 to 2015 we may detect three waves of globalization of wines produced in Portugal, namely, port wine exports for the British market in the 18th century, common wines exports to France in the second half of the 19th century, and finally the growth of exports to European markets from the last decade of the 20th century up to the present times. This chapter explores the fundamentals of such waves looking at trends in output, productivity, domestic and foreign consumption, commercial agreements and economic policies. The first two waves came to halt as conditions in the foreign markets changed, because they did not have a solid domestic base of production and commercialization. The chapter argues that the third wave is of a different kind as it developed from a more solid domestic base of the wine sector that had developed for decades based on domestic consumption. Thus we may conclude that wine globalization is also about changing domestic economic conditions. The process was however long and painful, as the sector had a very irregular performance throughout the 20th century which is however related to the overall backwardness of the Portuguese economy in the European context.
JEL classification: N53, N54, O13, Q11, Q17
Keywords: Portugal; Agriculture; Wine; Globalization; Domestic markets; Competitiveness.
* To be published in Wine’s Evolving Globalization: A New Comparative History. Edited by Kym Anderson and
Vicente Pinilla. Oxford: Oxford University Press (forthcoming). I would like to thank the editors for useful comments. The usual caveat applies.
Notice
The material presented in the EHES Working Paper Series is property of the author(s) and should be quoted as such. The views expressed in this Paper are those of the author(s) and do not necessarily represent the views of the EHES or
evolution of its output and exports is closely related to changes in domestic economic conditions as well as changes in the international markets. Vines were cultivated all over the territory, from the northern hills of Trás-os-Montes, to the Douro valley, from the coastal region of Estremadura to the dry climates of southern Alentejo and further to the islands of Madeira and the Azores. Until recently, wine was also an important source of calorie intake, together with grains, olive oil, fish and meat. The small size of the domestic economy, its geographical position at the southern periphery of Europe, as well as the evolution of domestic economic policies and international treaties and tariffs, are key elements for the understanding of the evolution of wine production and trade in Portugal. Portugal has lagged behind economic development elsewhere in Europe for a long time, and most of its industries reflect that backwardness and were seldom on the technological frontier. Yet the economic history of Portugal is also punctuated by instances where local innovation and technological advances were of great relevance, and winemaking provides examples of such positive developments.
Moreover, Portugal’s wine producers managed to develop a strong export sector from earlier periods in history. Indeed, David Ricardo’s famous treatise on comparative advantage used as an example the exchange of wine for cloth between industrializing Britain and agrarian Portugal (Ricardo 1817). The country is ranked highly by a number of global wine market indicators.1 For example, since the 19th century it has had around 10% of its total crop
land under vine, which is one of the highest in the world and about twenty times the global average. True, the yields of those vineyards are lower than in neighbouring countries, so its wine production per capita is usually a little below the leaders (France and Italy) but often ahead of Spain. It is frequently ranked second or third in the world in terms of the value of
wine exports per capita, after Spain during 1860-1890 and Algeria from 1890 to 1960 (and briefly Tunisia post-World War II). The share of wine in its total exports was higher than for any country other than Algeria up to 1970. Only in the past quarter-century has it slipped in its ranking by that indicator. Moreover, Portugal has consumed as much wine per capita as its wealthier neighbours most of the past ten decades and is ranked first globally in terms of wine’s share of national alcohol consumption.
Portugal’s wine history is marked by four major traits. In the 18th century, due to
changes in international politics, port wine developed into a buoyant export industry with Great Britain its most important market at the time. Yet port remained a relatively small part of total wine production in the country, and the sector evolved with little transformation from what it had been in earlier times. By mid-19th century Portugal’s vines, as those of other Southern European producers, especially France and Spain, were affected by oidium and phylloxera that were imported from North America. The reaction to the those diseases involved a great transformation of the sector leading to higher levels of productivity in wine production, lowering of the quality of that wine, and a greater share of international trade.
The adjustments continued to the end of the 19th century. Thereafter the sector continued to expand across the country, but it catered mainly to the domestic market and protected colonial markets, and involved overproduction and a succession of crises. Then in the 1930s came the regulation which improved conditions of winegrowers and the quality of their wine, albeit only partially. According to a largely publicized official slogan of the time, “to drink wine is to feed one million people in Portugal”. That was a major trait of the sector up to the end of the Estado Novo in 1974, and accession to the European Communities in 1986. In the last decades of the 20th century, Portugal’s wine industry followed at a distance the major transformations of the sector elsewhere in the world, including the increase in the
share of quality wines catering for social consumption. As a result, wineries have increased in size and brands have become more important.
We thus identify three waves of globalization of Portugal’s wine since 1750, and provide a description and an understanding of the fundamental features of those waves. For that purpose, we deal with four traits of Portugal’s wine sector in each wave, namely production, domestic consumption, exports and commercial policies. We start in the first section by providing a long-term overview of the weight of the industry in Portugal’s
agricultural sector. The following section deals with the emergence of the port wine industry and its relevance for the wine sector as a whole. The third section examines the
transformations of output, productivity and foreign trade stemming from the phylloxera invasion. The focus then shifts to the regulations introduced in the 1930s, the rapid increase in production for domestic consumption up to the 1980s, and the export boom that occurred in the most-recent decade, before drawing together the main conclusions of the chapter.
The agrarian background
Due to the efforts of a number of economic historians, particularly Reis (2016), it is now possible to depict the long-term trend of agricultural output and productivity in Portugal. The evolution of agricultural output in the 18th century is the outcome of different forces about
which there is still uncertainty. In some cases, there is a close relationship between agricultural cycles and major political events at the domestic or international level, but in other cases the causes of the cycle may relate to changes in climate conditions, demographic factors, innovations in crops and technological change more broadly, institutional bottlenecks, and protectionist and other types of economic policies. The role of foreign markets has
certainly had an impact as well, but not necessarily a dominant one throughout the centuries (Freire and Lains 2016).
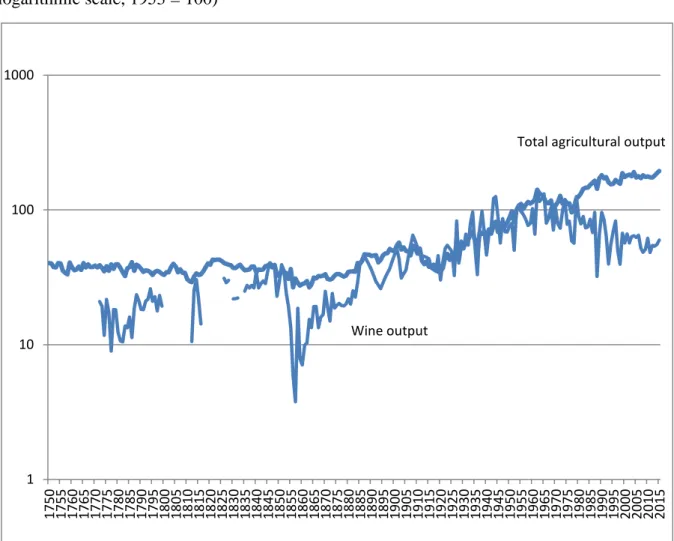
The evolution of agricultural (and wine) output is shown in Figure 7.1, and Table 7.1 presents long-term trend rates of growth between peak years. There are clearly four main long-term trends since 1750 marked by the peak years of 1821, 1902, 1962 and 2015. The second half of the 18th century and first two decades of the 19th century was a period of almost no growth. It contrasts with the next period, to the end of the 19th century, when the trend growth rate was 0.36% per year. The first six decades of the 20th century were marked by a higher trend growth rate of 1.52% per year, and it was followed by a slowdown to 0.60% per year for the period 1962 to 2015.
Portuguese agriculture went through a “silent revolution” over the 18th century, driven by the development of markets and market integration and in a context of “unchanged
institutional and political context” (Serrão 2009, pp. 47-48). This was also a period of large inflows of gold from Brazil, which could have financed food imports but instead domestic agricultural markets were protected from the outside world (see below). Paradoxically or not, this was the period of the rise of port wine exports from the Douro region (Serrão 2016, 2009). The decline of output was accentuated in the last decades of the 18th century and the first decade of the 19th century, thanks to wars in the north Atlantic that affected trade between Portugal and Brazil and, more importantly, the Napoleonic wars and the French invasions of continental Portugal from 1807 to 1811.
The interpretation of agricultural output growth after 1850 may be set in the context of the growth in other sectors of the economy. The second half of the 19th century was a period of moderate growth of the industrial sector and the overall economy. In that context the agricultural sector’s performance in terms of output and factor productivity was relatively good. And it was even better in terms of exports because this was a period when wine exports
expanded. It was also a period of increasing domestic market integration due to improvements in transport, including railways and roads, and to regional specialization between urban and rural areas and within rural areas.
Agricultural growth came to a halt after 1902, mostly because of the exhaustion of the positive influences up to then. After World War I, however, farm output gains a new
momentum, this time due to a large extent to state protection through tariffs and price
controls, public investments in infrastructure and education to accompany private investment, and the bettering of the institutional framework. The slower-growth years from 1962 to 2015 may be explained in terms of changes in economic policies affecting the agricultural sector as it became increasingly dependent on subsidies and regulations, but growth in the late 1980s was associated with Portugal’s accession to the European Communities.2
Growth of output and productivity was accompanied by changes in the structure of the agricultural sector, which were largely due to changes in the structure of demand, particularly domestic demand because the sector remained relatively closed to international competition. Changes in domestic demand were related to changes in national income, thus favouring sectors producing products with high income elasticities of demand such as animal products, fruits and vegetables.
By 1850, Portugal was still largely a rural economy, with two-thirds of its active population employed in agriculture. That share declined only slowly, and did not fall below one-third until 1974. Industry expanded faster than agriculture up to 1930, then there were two decades of even growth before industrialization regained momentum. Despite the relative decline of agriculture, and despite the sector’s relative backwardness by European standards, Portugal’s agricultural sector went through periods of growth of total factor productivity and associated structural changes in land use and product mix (Lains 2003). Total factor
productivity increased by 0.75 in 1865-1902, by 0.4%, in 1902-27, and then peaked at 1.9% in 1927-1963 before declining during 1962-73 (at -0.8% per year, see Lains (2009, p 340).
Wine has had a large share of total agricultural output. In 1515 it was 15% (Reis 2016, p.174), in 1850 it was 19%, during 1861-70 it averaged 22%, and in 1900-09 it peaked at 23%. These are extremely high shares by international standards. True, it had declined to 13.5% in 1935-39, but it remained at that level for some time and even by 1970-73 it was 11% and was still 9% in 2013.3 Figure 7.1 shows the evolution of wine output volume from 1772 to 2015, expressed as an index to aid comparison with the evolution of total agricultural output. It shows that output increased faster for wine than for the rest of the agricultural sector from 1772 to a peak in 1846, and then it fell sharply due to the oidium disease that affected vines by mid-19th century. Then wine output expanded faster than agriculture again, to
another peak in 1908, followed by a period where the two curves rose similarly through to the 1960s. Thereafter wine expanded slower than other total agricultural output.
Wine output evolved according to particular determinants, including changes in external demand, the spread of diseases, changes in the structure of output, and the evolution of domestic demand. These are the focus of the following sections.
Contra Ricardo: port for export, 1750-1860
Early modern economies were not very open, and that was the case for Portugal: its wine output was mostly consumed in the domestic market and wine exports were relatively unimportant, as were food imports. The main import was grain, but it accounted for only 1.4% of food consumption by value in Portugal in 1700. By 1800, the external food balance
was slightly negative, and the value of wine exports was just below that of grain imports. Table 7.2 shows that olive oil contributed more export earnings than wine in 1700, but since then the value of wine exports increased greatly while that of olive oil exports stagnated through to 1850. For most of the 16th and 17th century Portugal’s wine exports were
insignificant before they increased rapidly from the late 17th century: wine exports doubled in real value from 1600 to 1650 and then increased 4.7 times during 1650-1700. Yet wine exports accounted for just 1% of the total value of national food consumption in 1700 and 1750, before they increased six-fold during 1750-1800. By the beginning of the 19th century, wine exports accounted for 3.8% of total food consumption, but they slipped back to 3.1% by 1850.4
Wine production for exports, despite being small in scale, was one of the most
dynamic sectors of the economy, particularly the part that exported port wine through the city of Porto at the mouth of the river Douro. Those exports were fortified wines produced from vines cultivated in the steep slopes of the valley. They required considerable investment in the preparation of land, wine making, manufacturing of casks, and transportation including to improve the navigability of the Douro River, the roads, and the ships required to export the wine.
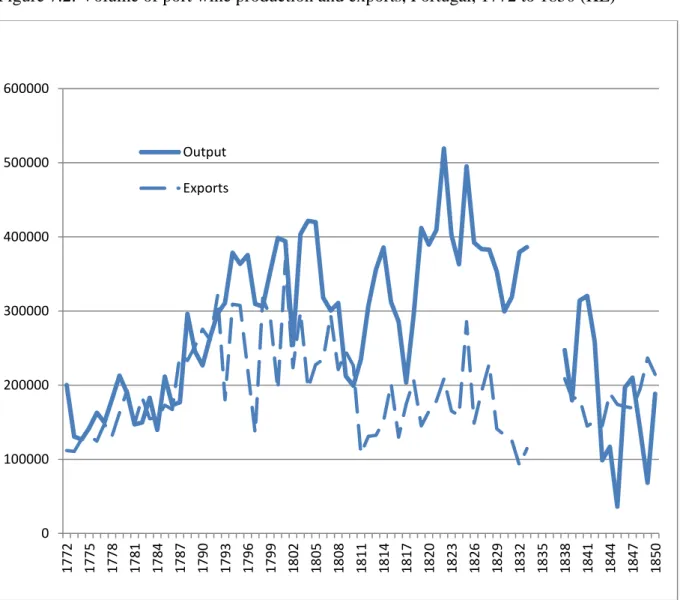
Figure 7.2 shows the evolution of port wine output and exports from 1772 to 1850. It shows output was overwhelmingly exported up to the end of the 18th century, and then both
output and exports declined, although the latter at a faster pace. The first half of the 19th century was a period of decline for this particular segment of Portugal’s wine sector.
Port wine exports were dependent on external factors, particularly trade agreements with Great Britain, the growth of international demand for fortified wines, and the
international situation in terms of war and peace. Port wine was one of the first sectors in
Portugal to be subject to specific policy measures, including the demarcation of the region of production, but political intervention apparently did not condition the growth of output (Martins 1988, p.393).
The emergence of port wine is closely link to international politics and in particular in the interest that England had in establishing an alliance with Portugal, at the time of French expansionism under Louis XIV which culminated in the wars of Spanish succession (1701-1714). Portugal was a precious ally for England not only because of the strategic position of the port of Lisbon, but also because it was a source of Brazilian gold. The wine market in England was developing rapidly, and a replacement of French wines from Bordeaux was needed. Port wine was the ready answer, and it was the aim of the commercial and defence treaties signed between the two countries in 1703, which became known as the Methuen treaty.
While port was not created by the Anglo-French wars, the international setting certainly provided the right circumstances for its development in the English market (see Alexandre 2008, pp. 139-40 and Cardoso forthcoming). The Methuen treaty favoured
Portuguese wines to the detriment of French ones, and in return Portugal conceded to Britain special treatment for its exports of woollens. The port trade evolved not out of Ricardian comparative advantage but out of economic policy driven by rent-seeking: English and Portuguese negotiators of the treaty had interests, respectively, in woollens and wines (Anderson 2014; Grantham 1999).
By 1710, Portugal had a 50% market share in British wine imports and France had just 5%, having dropped from 70% in the 1680s (Palma and Reis 2016, pp. 33-34). Table 7.3 shows that Portugal’s share in the British market peaked at 72% in the second half of the 18th
century. Portugal’s share fell over the 19th century but increased again slightly in the first decades of the 20th century.
This was not just a story of demand and protectionism. The wine sector of the Douro region had to adapt to the new market, which required investments in land transformation, transportation and wine making. It was also necessary to develop a new institutional setting to control the quality of production and prices (Simpson 2011). The outcome was that port rose from almost nothing in the 1680s to a peak in 1800 when it accounted for 40 per cent of Portugal’s wine production, implying a remarkable 3.7% annual growth over that period – dubbed the ‘Century of Port’. In a relatively short time, port had become the country’s second most important engine of pre-industrial economic dynamism, along with maize.
Port wine production was one of the most advanced economic sectors in 18th century Portugal, even when compared to manufactures and services. It was an industry that was widely exposed to international market forces. It was also the first to be regulated in an extensive way, with the creation of the Companhia das Vinhas do Alto Douro in 1756, which defined the Doura wine region and regulated output, prices and commercialization (Martins 1988, p. 392). Although it was set up by the State, as a majestic company it wanted to auto-regulate. This arrangement may have had advantages in the short term, but it also limited the growth of the sector and added to conflicts between growers and traders. It led to the
merchants in Porto taking control of the sector: its board was composed almost totally of merchants from Porto and later even from London.5 But the Douro producer and trade companies were “remarkably hybrid in character”, reflecting the regional and international complexity of the trade, which put together producers from remote rural regions in Portugal, to traders in Porto and in London (Duguid and Lopes 1999).
With the rise of liberalism from the 1820 revolution onwards, the role of the Douro Company was increasingly put into question. In 1834, its majestic powers were abolished and it was turned into a regular commercial company, thereby abolishing the monopoly of port
wine exports through Porto. In 1852, it lost all of its powers regarding the production and trade of port wine, and in 1865 the sector was fully liberalized. The liberalization lasted nominally until 1907, but protection of the sector became mostly indirect (Pereira 2008, pp. 179-80; Alexandre 2008, pp. 146-47). As trade expanded, many Douro farmers stopped their wine production and instead sold their grapes to Porto export merchants. Later those
merchants lost their trade to British merchants. This vertical integration of port wine, which led the transfer of power from the producers to the merchants in Porto and then in London, was a consequence of the need to compete in an increasingly competitive market, where the control of quality was of paramount importance and merchants were better qualified to guarantee it than scattered producers (Duguid 2005, pp. 525-26).
From 1678 to 1987, four cycles have been identified for the port wine sector, in terms of production and trade (Martins 1988, pp. 394-403; 1991). The first cycle stretches from 1678 to 1810 involved the creation and consolidation of the sector in terms of both production and trade. Output increased rapidly at 3.5% per year and port exports became Portugal’s top export item (apart from re-exports of cotton and sugar imported from Brazil), accounting in 1800 for 15% of total exports. Port wine during these 132 years was virtually totally exported to a single market, namely England or Britain. By the end of the 18th century, port accounted for 60% of all English wine imports.
A period of instability and stagnation followed, a consequence of overall military activity and political instability in Europe and in Portugal, which lasted from 1810 to 1865. During 1811-13, exports to Britain halved, and that new lower level lasted for most of the rest of the 19th century. Total port exports declined by one-third between 1790-1809 and 1864, aggravated by the fact that in 1850-52 the Douro region was affected by oidium (Martins 1988, pp. 403-409). Britain remained by far the largest market, with about 90% of total exports from Portugal. In 1850-52, which aggravated the scenario.
The negative trend was reversed in the 1860s due to the diversification of countries of destination for the exports. Britain’s relative weight declined as new markets developed in Germany and other northern countries, as well as in France and Brazil. Export prices,
however, declined and port wine became less important in Portugal’s trade as the Portuguese economy diversified. Even so, by 1930-39 port still accounted for 20% of total exports from Portugal, down from 30% in the 1870-79.
New firms were founded, new international trade treaties were signed, and new regulations were enacted to protect brands. But the government in Lisbon preferred to protect trade rather than production. From 1865 to 1907, production and trade were totally
liberalized, following the general trend in Portugal then. This stimulated fast growth but did not improve quality. By 1907, new regulations were enacted in 1907 but they proved highly ineffective.6
Things start to improve two regimes later, with the ascension of the Estado Novo when the Casa do Douro, the Grémio dos Exportadores, and the Instituto do Vinho do Porto were founded. This provided a new institutional framework that would last for most of the 20th century. From the 1960s onwards a new positive cycle was marked by growth and market diversification. By the decade of the 1980s, France had become the largest market for
Portugal’s port exports, with a 40% market share. Moreover, commercialization was also transformed as bottle wine exports increased their share to 80% of total wine exports in 1986. Also, the firm structure of the sector changed, with the number of export firms falling from 113 in 1934-35 to 43 in the 1980s. It was trade that conditioned production rather than the other way round, such that the state protected traders more than producers (Martins 1988) and producers had little influence on the market. Prior to the 1950s, producers did their own
blending, but by the 1870s port was divided into the modern classification of “vintage” and “tawny” (Duguid 2005, p. 524n).
The dynamism of Port wine production and exports was not matched by the rest of Portugal’s wine sector, which was relatively backward like the rest of Portuguese agriculture as more like the rest of Portuguese agriculture as a compared to agriculture in Northern Europe.
Phylloxera, the export boom and its backlash, 1860-1930
Following two decades of recovery in response to the stabilization of the domestic and international markets, in 1852, Portugal’s vines were affected by a mildew fungus (oidium) originated in North America. The disease reached first the Douro region, due to its wider contacts with the outside world, and spread rapidly southwards and caused a sharp contraction in wine output (Figure 7.1). From the peak in 1851 to the trough in 1857, total wine output fell by almost 90%. Exports contracted by one-third as stocks were depleted. Yet there was a fast recovery, as the cure (by sulphite) was readily available and was used comprehensively despite its relatively high cost. The rapid recovery demonstrates the dynamism and capacity to adjust of Portugal’s wine sector. Government intervention was kept to a minimum, but it was also a turning point in that respect, as new forms of government intervention were introduced (Martins 1996).
Soon after wineries recovered from oidium, they were affected by another disease also imported from North America, the phylloxera insect. That far more devastating disease arrived first in France in the early 1860s. It reached the Douro region in 1865. Historically this is the region that has been affected first by various global factors, both positive and
negative (Martins 1991, p.: 653; Matias 2002; Freire 2010; Simpson 2011). By 1883, one-quarter of Portugal’s vine area had been affected by phylloxera, of which 90% was in the Douro region. Ten years later half of the national vine area had been attacked. In order to combat the insect, wine growers resorted to carbon sulphide, and the substitution of American for local vine rootstocks. The new rootstocks were considerably more productive, not only because they matured one or two years earlier than the local ones, but also because they produced on average one-third more grapes. In the process, the Douro region ceased to be the leader and the relevance of the south increased considerably (Martins 1991).
Policies also changed, as the Douro Company was closed in 1852 and in 1865 the Douro region ceased to have privileges. By the end of the 19th century the area under vines
was considerably larger than before phylloxera arrived in Portugal, and wine output expanded accordingly (Martins 2005, pp. 222 and 232-33). The volume of wine output increased by 0.61% per year between the two peak years from 1846 and 1908. Then there was a sharp decline, which as to a large extent was due to the rise of protectionist policies and then to the consequences of World War I which contracted exports (Table 7.1).
Wineries spread across the country in many different ways and fashions, and they were cultivated with other crops such as olive and other fruit trees or vegetables, and in both lowlands and up to 1000 metres of altitude (Pereira 1983, p. 141). According to one estimate, half of Portugal’s active population in 1900 was directly or indirectly involved in wine production (Freire 2010, p. 51). At an estimated 983 reis per hectare, the value of land occupied by vines was one of the highest in Portugal during 1900-09, after fruits and vegetables at 1,277 reis, and rice at 1,000 reis, and higher than that of potato and maize and well above that of wheat.7 Wine production brought higher returns than that of grains and was not affected by import competition and the instability that it provoked and it employed labour
more regularly through the year (Martins 2005, pp. 235-6). Urbanization and the growth of transport infrastructure in Portugal were crucial contributors to that, as they increased domestic wine consumption (as also in Spain, see Fernández and Pinilla 2014, p. 69).
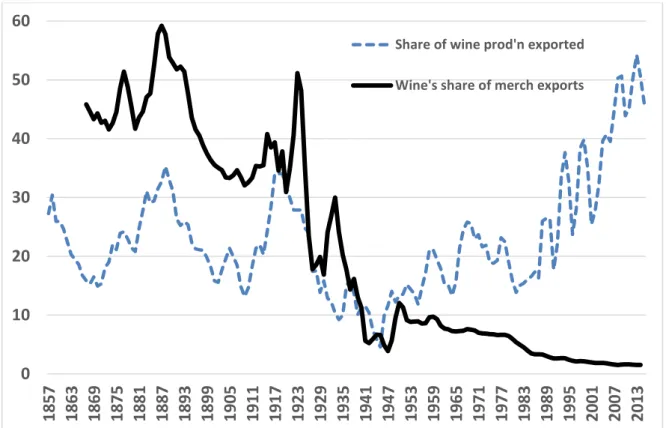
From the beginning of the 20th century to the immediate aftermath of World War I, wine exports increased again and reached slightly above 30% of output in 1919. However, the growth of wine output in the interwar period was insufficient to stop the decline in the share of the sector in total agricultural output, which fell from 23% in 1900-09 to 13.5% in 1935-39. The share of wine in Portugal’s total exports also declined, from close to half prior to the 1890s to one-third in 1910-13, one-sixth in 1935-38 and one-tenth in the 1950s (Figure 7.3). Clearly, the domestic sector was largely dominant as an outlet for Portugal’s wine sector, and we have to explain its evolution looking to what happened within borders, in terms of the growth and changing patterns of consumption, but its large exposition to international trade also needs to be taken into account.
The increase in output after the phylloxera was however mostly made out of wines with low quality standards which were sold in bulk in the domestic and the international markets, mainly to France, where they were to fortify and improve the quality of wines produced there. The increase in exports went along with an increase in the domestic consumption which was related to changes in the structure of demand for agricultural products. Figure 7.3 shows the evolution of the wine export shares, by volume. The share of exports increased to 40.5% in 1886, declining thereafter to 11.4% in 1908, to increase again reaching another peak during World War I and declined to World War II to increase again thereafter.8
Global wine trade was rather limited by the middle of the 19th century, mostly because of the high costs of conservation and transportation. Thus trade was overwhelmingly in liquor
wines, such as port and sherry. During the rest of the century, the cost of shipping table wines was reduced and the methods of production improved so that wines lasted for longer. But the growth of trade was also an outcome of the liberalization of trade since the 1860s and most and foremost from the sharp increase in the demand for imports in France due to the attack of its vineyards by the phylloxera. Consumption across Europe and other continents was also increasing, as a consequence of rising incomes and industrialization. The wine export surge lasted however for only a few decades, as by 1892 France and other wine importers increased tariffs in order to protect domestic production or in the case of France, production from the North African colonies, namely Algeria.9
By the mid-19th century port, Madeira and table wines were by far Portugal’s single largest export items, amounting to 51.9% of total exports, and Britain the largest market, importing 75% of exports by volume, in 1850-54, and then decreased to 58%, in 1910-14. In the following decades that overall picture changed considerably, particularly in the last decades of the 19th century, as Portugal’s exports diversified both in terms of its composition
and regional distribution.
Even if the Portuguese response to increases in international demand was not fully satisfactory, there were two instances in which wine exports were rather responsive. Firstly, in spite of the wine disease that affected the Douro port wine production area in 1867-8, wine producers of the region, taking advantage of the freedom to export all kinds of wines from Porto granted in 1865, managed to keep their exports up by mixing the genuine port wines with wines from the Southern regions of Portugal, not yet affected by the phylloxera (Pereira 1983, p. 225; Lains 1986). The mixture of wines led to a decline in quality and complaints from British importers. Nevertheless, the volume and price of exports did not decline until
9 Pinilla and Ayuda (2002, pp. 54-55). For the rise and fall of the Algerian wine sector, see Meloni and Swinnen
after 1870, following a general fall in international prices. The maintenance of export levels contrasts with the drastic decrease in port wine production. According to official estimates, in 1880 output had decreased by 24 ML, and a further decrease of 54 ML was registered in 1888.
Exports went through the phylloxera crisis without drastic decline: by 1880 the export peak of 1875-77 had already been reached, and they increased further until 1886. Brazil accounted for most of this increase, which may reflect the decrease in quality of port wines after phylloxera (Pereira 1983, p. 130; Martins 1990, p. 229). There was a peak in the 1880s which was due to the increase of exports to France, whose vineyards had been severely affected by phylloxera. The main market for port wine was Britain, which by 1850-54 imported 75% of the volume exported by Portugal. This proportion decreased to 58% by 1910-14.
Exports could not continue to depend on port wine, however, given that its strong alcoholic content pleased neither the British consumer nor the custom officer. Furthermore, the 1892 Méline tariff discriminated against heavier wines; and from 1906 Germany
discriminated in favour of Italian Marsala wine which was a strong competitor for port and Madeira wines. The alternative would have been to export more table wine. Portuguese table wines were known to be strong, almost as strong as port wine. For the boom in the French market this happened to be an advantage because France imported wine to distil and mix with her own wines. In 1880-84 40% of total output was exported, and the share of exports in port wine output was 79% in 1860-64 and 105% in 1909-13.10 In 1888, Portugal’s share by
volume of French wine imports was 8%, down from 15% in 1876. After 1889 wine sales to
10 Exports exceed production some years because they draw from stocks of previous years’
France were reduced, as French vineyards recovered and the imports from other sources, such as Algeria, increased (Lains 1986, p. 401).
In 1891, France increased its tariffs on foreign wine, thus protecting imports from Algeria. This led to a crisis in the Spanish wine sector which up to then was France’s main supplier (Pinilla and Ayuda 2002, pp. 52-53). In 1891, wine exports from Spain peaked at 32 times the level of 1850 and 6 times that of 1877, before suddenly falling to half that peak by the end of the 1890s. Between 1890 and 1938, imports of wine into France averaged 10-25% of domestic output, and the Spanish quota fell from the maximum of 80% of that market to a maximum of 26% by the 1930s. That decline was mostly all due to tariff protection (Pinilla and Serrano 2008, p. 136).
Meanwhile, the share of Portuguese wines sold on the British market decreased from 37% of total volume imports to 21% during 1891-96. The main reason for this decline was a shift in taste in Britain away from consumption of high-alcohol wines. The structure of the British tariff schedule did not help either. Britain in 1860 imposed higher tariffs on heavier wines, port and sherry, discriminating in favour of lighter wines from France. In the abundant consular correspondence between Lisbon and London on this subject, the British Government defended this discrimination as a tax on the alcoholic content of wine. However, it was diplomatically important for Britain to improve relations with France, and the 1860 Cobden-Chevalier treaty led to discrimination in favour of French wines, which happened to have lower alcoholic content, and against those of Portugal (and Spain).
Wine duties in Britain were subsequently reduced in 1876 and 1886. Nevertheless, Portuguese wines were still too alcoholic to benefit from the reductions in tariffs. Spanish exporters adapted better to the changes in the British market: 96% of Spanish wines exported to Britain in 1876 fell within the higher duty scale, but 22 years later this proportion had fallen to 25%. Spanish table wine exports increased from practically nil (1.4 ML) to 15 ML
over that period. The comparable trend for Portugal was: 96% of heavy wines in 1876 and 94% in 1898. It is thus not surprising that Portuguese wine exports to Britain hardly increased in the period (from 0.9 to 1.3 ML). The larger increase in Spanish exports of lighter wines was due to a treaty with Britain in 1886 which reduced the scale in their favour. However, the fact is that Spain produced such wines and Portugal did not: in 1886 Portugal already had most-favoured-nation treatment from Britain, and as such it was not barred from exporting the same kind of wines, if only they were produced at competitive prices (Lains 1986, p. 403).
Market diversification was achieved by increasing sales to Germany and the United States, as well as Brazil and African colonies. By 1910-14, Scandinavia and Germany purchased 27% of Portugal’s port wine export volume (Pereira 1983, pp. 217-32; Martins 1990, pp. 248-51). Exports of table wine were marked by a large increase in exports to France in the 1880s, before which Portugal’s main markets were Britain and Brazil. After the
temporary boom in exports to France, table wine export levels were maintained and eventually increased after 1900-04, while exports to France fell back to their earlier level. This was due to the favourable trend in exports to Brazil and to Portugal’s African colonies, the latter protected after 1892 (Martins 1990, pp. 252-53; Lanero 2014, pp. 88). Wine was already the single most important export to those colonies in 1870, but the amounts were very small. By the end of the 19th century wine trade to the colonies had expanded considerably but then they declined during World War I alomg with the local economy (Clarence-Smith 1985, pp. 68, 94 and 120-122; Lains 1986).
Portugal had difficulty securing trade agreements with its major partners as protectionist measures were successively implemented across Europe. The commercial treaties between Portugal and France from 1866 and 1882 were not reconfirmed by France during the French tariff reforms of 1890-91. In 1892, France applied its general tariff on
Portuguese wines whereas Spain was exporting wines to France at the lower minimum tariff. In 1894, France imposed its higher tariff on wines from Italy, Switzerland and Portugal; Germany did likewise on Spain and Portugal, as did Italy on France and Portugal. Wine was predominantly exported to neighbouring countries, or to countries to which nationals had emigrated. That was the case of wine imports into France, mainly from Spain and the French colony of Algeria, and into Germany, mainly from Italy through Austria or Switzerland, and from France (Martins 1990, p. 116).
Another reason that may explain Portugal’s lack of commercial treaties after the mid-1880s is linked to the relative unimportance of Portugal. This is evident from the British reaction to Portugal discriminating against her products in retaliation to the preferential treatment that Britain had given to French wines under the Cobden-Chevalier treaty of 1860. Despite the complaints from British merchants who were paying higher import duties in Portugal from 1866, Britain kept wine duties according to their alcoholic content, providing a de facto preferential treatment for French lighter wines. There was not much Portugal could do about it, after ten years of negotiations with Britain and after at least three years’
discussion in parliament. Portugal finally gave most favoured nation status to Britain in 1876, without compensations in return (Lains 1986).
The share of Portugal in the volume and value of global wine exports peaked during the two decades of the world wars, at 9%, with rises before World War I and steady falls since World War II (Figure 7.5). Its share of global wine production increased through to the 1940s but catering mostly to the domestic market as export volumes and the export ratio declined after World War I (Figures 7.3 and 7.5). Wine followed a general trend in Portuguese agriculture during the protectionist period that started with grains in the early 1890s and spread to the other sectors during World War I and its aftermath. With Spanish producers facing a shortfall in demand in South America and also in Europe where wine consumption
was still relatively small and growing only slowly, winegrower prices and profits were depressed up to at least the 1930 (Fernández and Pinilla 2014).
Growth of wine output and consumption during the second half of the 19th century was
mostly concentrated in Europe. From the beginning of the 20th century, Spain and Portugal, suffered from the same negative factors, as France gave preference to wines from Algeria, as consumption in the more-industrialized nations plateaued and protectionism increased, as abolition took hold in the United States, and as expanded wine production in other parts of the world increased the level of competition (Pinilla and Ayuda 2007, pp. 180-181). There was also a redistribution of wine regions at the world level as output in the Americas expanded, as well as in the French colonies in North Africa, particularly Algeria. Between 1960 and 1900, France, Italy, Spain and Portugal accounted for 79% of world output, but by 1910-14 that share had fallen to 73% and by the 1930s to 68%, before it fell at a slower rate through to 1990 (averaging 62% over those six decades, see Anderson and Pinilla 2017).
The wine sector’s political leverage in Portugal remained relatively small for most of the 19th century. By the turn of the 20th century however, as output increased and exports
declined and wine ceased to be simply a local problem and became a national one, some pro-active measures were taken by the Portuguese governments. One was the creation of wine regions. Portugal was a pioneer in the creation of wine regions, with the Douro wine region founded in 1756, but little had been done since then and Port wine remained an exception for all that time. From 1907 to 1911, six new wine regions were set up by the Portuguese
government, most in the region around Lisbon, namely, Carcavelos, Colares and Bucelas, as well as Setúbal, 30 kilometres to the south of Lisbon, Vinhos Verdes in the north and Madeira, added to the existent Douro wine region that was also reorganized (Martins 1991, p. 683; Freire 2010, p. 53).
The domestic and international turmoil of the interwar period impeded the
consolidation of institutional changes that would promote a better equilibrium for the wine industry, which was severely affected by an increasing productive capacity that faced a thriving domestic and international demand. Domestic and international politics would however change soon, and paradoxically the new authoritarian regime and reinforced protectionism at the international level would assist relevant changes in the sector.
Domestic consolidation and the third wave, 1930-2015
The Estado Novo led to an overhaul of the institutional framework of the Portuguese state and the agricultural and wine sectors were naturally affected and to a large extent. State
intervention spread across many fields, including education, health and research, as well as roads and electrification and irrigation. Portugal remained one of the poorest western
European economies with low levels of instruction and capital per labour, but the dictatorship, looking for sources of political legitimization, was able to build a new set of economic
infrastructures that impacted positively in the economy, at least in the short and medium turn. The agricultural sector output kept growing for at least three more decades, whereas volatility of prices and incomes were to a large extent contained. The paradox of having protectionism accompanied by growth and structural change was not unlike what happened in a few other peripheral countries of Europe.11 Wheat and wine were two of the most protected sectors from the 1930s onwards, while others hit by the crisis in the 1930s, namely producers of pork, beef, dairy, potato and wood, did not receive any protection from the State (Lanero 2014, pp. 90-91).
The new institutional setting increased the level of regulation of production and commercialization of the wine sector. The measures that were taken were mostly aimed at controlling the level of output and assuring better storage conditions and distribution in the domestic and colonial markets, then at increasing the quality of the wines produced for export to European markets. In 1937, the six wine regions created between 1907 and 1911 were consolidated and put under the supervision of the Junta Nacional dos Vinhos, one of the many institutions that characterised the corporatist state (Freire 2010, p. 53). After 1950, the
concern with quality somehow increased and measures were implemented to improve the quality of grapes, providing technical assistance and fostering the creation of producer’s cooperatives. Yet the share of output from the demarcated wine regions changed very little in the years to come, from 62% of total wine output in 1939-49 to 58% in 1960-69. The
production of table wines still accounted for 96% of total wine output in 1939-49, and 95% in 1960-73. Contrarily, better-quality port wines accounted for only 2.5% and 3.5% of total output in the same two periods (Baptista 1993, pp. 209 and 215. The number of wine cooperatives increased from just one in 1935 to 19 in 1955 and 57 in 1969, and in this latter year cooperatives accounted for 24% of total wine output (Baptista 1993, pp. 235 and 236; Lanero 2014, p. 91).
Other southern European win growers facing rising wages and lower wine prices also resorted to the creation of cooperatives in order to increase their ability to survive, and especially so in France, followed by Italy, Spain and Portugal. In France, winegrowers had easier access to capital, as the French government provided a large part of the capital needed at lower interest rates (Simpson 2000, p. 115). Cooperatives in Spain accounted for 40% of total wine production in 1964, when there numbered 600 (Martínez and Medina 2010, p. 88).
Wine output expanded considerably and increased its share of agriculture in the Portuguese economy, thanks to state assistance and price protection, but also to the shape of
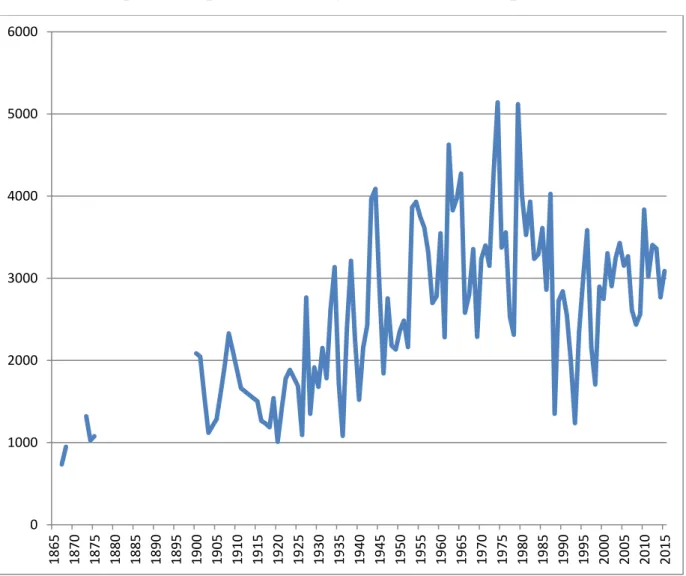
comparative advantages of the country. The increase in wine production was however accompanied by a fall in relative prices and thus the weight of the wine sector in total agricultural output, at current prices, declined from 23.3% in 1900-09 to 13.5% in 1935-39, and it remained at that lower share through to the early 1970s (Lains 2009, p. 343). The vine area under production remained relatively stable, fluctuating between 300 to 400 thousand hectares from the late 19th century up 1970 before declining gradually to around 200 thousand hectares. Wine productivity measured by output per hectare increased steeply in Portugal during the second half of the 20th century (Freire 2010, pp. 40-41). Figure 7.4 shows the doubling in wine production per hectare between 1930 and 1980.
Trends in the wine sector in Portugal followed closely trends of the other three large Mediterranean producers, namely, France, Italy and Spain, as the output share in that group of four countries fell from 63% of the world total, in 1960-64, to just 49% in 2010-14. Grape yields varied considerably in the same countries, from the maximum of 10.4 tons per hectare, in Italy in 2005-09, to a minimum of 2.5 tons per hectare in Spain in 1965-69. Portugal’s yields declined from 6.0 tons in 1961-64 to 3.0 tons in 1985-89, and increased from then to 4.5 tons in 2000-04 and 4.0 in 2005-09 (Anderson and Nelgen 2011, Table 97).
Price and revenue volatility increased as output exceeded demand. In the 1930s, overproduction and low prices in the domestic market were joined by economic depression in international markets. Wine production cannot rapidly adapt to changes in markets, as vines are a medium term investment (Freire 2010, pp. 17-18; Martins 1996, p. 415). But port wines were not as affected as table wines. This was a major characteristic of the sector that put it in a different group from the rest of Portuguese agriculture. The fact that output could not adjust quickly to changes in demand implied that the sector was affected by successive crisis which translated in high levels of income volatility for winemaker and grapegrowers.
Per capita consumption of wine peaked in the mid-1950s in France, in the late 1950s in Italy, in the mid-1970s in Spain and in the latter 1960s in Portugal. Wine per capita consumption declined in the four Mediterranean countries during the second half of the 20th
century and in 2010-14 consumption levels were similar the cases of France, Italy and Portugal, at a little over 40 litres per capita, whereas Spain had fallen by then to around 15 litres.
For most of the 20th century up to the 1980s, wine producers in Spain catered mostly for the domestic market, which was dominated by poor quality wines sold in bulk (Simpson 2000, pp. 98-99). The domestic market expanded rather slowly and had not much potential for further growth. In fact, as incomes increased and preferences changed, the growth in demand was increasingly concentrated in higher-quality wines sold in bottles and under brands. Then the state intervened with the aim of contracting production by reducing the area under vines and promoting quality improvements in the wines produced (Fernández 2012, pp. 41-42). Then the international market improved, which Spanish producers were able to capitalize on (Fernández and Pinilla 2014). The sustained increase in output was thus largely dependent on export markets, particularly for wines of higher quality.
Success in global markets was dependent in part on the capacity to secure
international trade agreements. Portugal joined the European Free Trade Association (EFTA) as a developing economy and had preferential treatment for some of its agricultural exports, including wine, but the gains from trade were very small. Portugal also took advantage of the colonial markets, due to tariff protection and the rapid growth of demand for wine associated with the expansion of local economies. By 1956-60, wine exports former colonies amounted to about 110 ML or 73% of total wine exports, although they accounted for only 10% of the total value of exports to them. This changed quickly as Portugal joined the General
reduced. In 1972, three years before independence, the colonies were surpassed by the other markets as the main outlet for Portuguese wine exports (Clarence-Smith 1985, pp. 161-2 and 201). In that same year, Portugal signed a commercial agreement with the EEC, before the first enlargement and the decline in the relevance of EFTA, but also with little consequences for the wine sector, except the small volumes of quality quality that was exported (Amaro 1978).
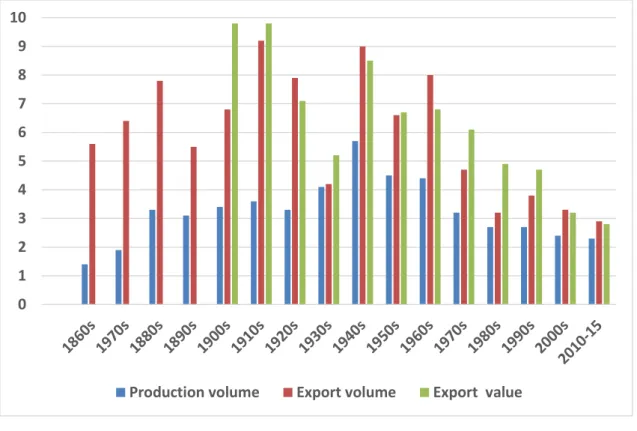
The share of output exported thus rose consistently, after declining from 1930 onwards to a low close to 5% during World War II, reaching 30% again in the late 1960s. It was only by the end of the 20th century that the wine export share reached a new peak at 50%. The increase in the share of exports was at least as fast in Portugal as in its three neighbouring countries, and in 2013-15 it was 46%, the same as Italy’s, above France’s 32% and close to Spain’s 50%. Figure 7.6 shows the growth in wine output and exports, as well as in the unit value of exports. In the decades to the end of the period, export volume increased as did their unit value, whereas output declined. These trends were markedly different from what
occurred in previous years. Yet the growth of Portugal’s wine export volume after 1980 was lower than that of the other three key Mediterranean countries, contributing it its continuing decline in global exports (Figure 7.5). However, Portugal’s unit values of wine exports were second only to those of France, as shown in Table 7.4.
From about 1980 onwards, world wine trade expanded rapidly, due to the increase in consumption of better-quality wines in the more-developed economies, the trend being accompanied by improvements in trade practices, including the expansion of branding. Spain and even more so Portugal lagged behind in joining that positive trend. What happened since 1980 was coined “a revolution in the vineyards and wines of Spain’s” (Martínez and Medina 2010, p. 77). The response of European producers was different from that of other world regions, such as the United States and Australia that increasingly produced homogeneous
quality wines at large scale, whereas European countries continued producing in the
traditional way, only increasing the level of output. Yet European producers still accounted for a large share of global wine trade throughout 1970-2000, which was still overwhelmingly sold in the European market (Fernández and Pinilla 2014, pp. 88-89). The growth of
multinational firms operating in alcoholic beverages also helped exports, and their relevance increased in countries such as the UK, France and the Netherlands from the 1960s. But not so in Portugal. The main reason for Portugal’s lag resided in the relatively small size of the firms operating there.
World trade in quality wine surged again after the turn of the century (Fernández and Pinilla 2014, pp. 91-92). In Spain the consumption of quality wines increased from 14% in 1987 to 38% of total consumption in 2009. In per capita terms, table wines consumption declined from 36 to 8 litres per person in the same period of time, whereas quality wines remained at 6 litres in the same period. The change in the structure of wine consumption was also accompanied by a change of where it was consumed, which was increasingly more so outside the residence. Wine was becoming increasingly consumed socially. The Spanish “wine revolution” also reached Spanish vineyards, as the area was reduced by one-third between 1980 and 2009 and the types of vines produced changed considerably too. Yields increased by 85% during 1994-2009 to 32 hl/litre in 2009, making Spain one of the highest yielding countries in the world (Martínez and Medina 2010).
Spanish and Portuguese wine producers have not been the most favoured within the European Common Market (Fernández and Pinilla 2014, p. 90). A nominal rate of direct protection to prices estimated by the OECD stands at 8.6% in 1986-92, 6.4% in 1993-99, 1.7% in 2000-6 and 0.3 and 0% in respectively 2007-13 and 2014. Yet indirect support to wine producers increased in the same period and on overage the level of support remained unchanged between 2007 and 2012, with a “nominal rate of total producer assistance”, which
measures total support as percentage of gross value of wine production, averaging 20% in that period. The largest recipients of aid were France, Italy and Spain, and in equal-4th position were Germany, Austria and Portugal. Per hectare of vine, Portugal and Spain came slightly below the EU-27 average, whereas Italy, Germany and France came above the average. Producers in France received double the amount that producers in Portugal and Spain
received. Per litre of wine produced, Portugal was even with France and both were above the EU-27 average, whereas Italy and Germany were slightly below (Anderson and Jensen 2016, p. 294).
EU subsidies are granted in a complex framework which can hardly be captured by any particular country or type of producer. Regulations adopted by the EU were initially (in 1966) mainly French and to a lesser extent Italian. The EU regulates quantities, prices and quality of wines. The first two are forms of direct protection to producers and distributors the third is only indirect as it is also consumer protection. Seven out of the eight European Common Market 1966 wine tariffs were copied from those of France, implying that all the other five EEC countries had to adjust, particularly in Germany where a substantial reduction in tariffs for wines was required for containers below two litres (Meloni and Swinnen 2013, pp. 266-267).
In Portugal, wine has a large weight in the agricultural sector, representing in 2012 11% of value added and 8% of employment, thus with a labour productivity above the
average. Its export performance is also positive, particularly in bottled wines, which increased at 4.6% per year during 2005-2011. Apparently the sector has been unable to fully exploit subsidies, which is probably due to difficulties in investment stemming either from low availability of funds from the financial sector or difficulties in securing markets. As a result, only about half of EU-approved support funds were spent (Plano Estratégico para a
In 1997, associations representing merchants, producers, wine cooperatives, distillers, farmers and wine regions founded the non-profit association with the name ViniPortugal with the aim of marketing Portugal’s wine in foreign markets.12 The date of creation of the
association is indicative of Portugal’s delay. But the list of things to be done probably does not differ from lists of other associations in other countries or even from other times. What really matters is the reasons why the sound measures are not followed, which may have more to do with limits to investment which may be the outcome of low profitability, low levels of starting capital to serve as collateral, or lack of financial intermediates of capacity to influence economic policies and subsidies.13
Conclusion: a reversal of fortunes?
Between 1930 to 1960, the European market was divided into two types of wines, namely, wines produced in wine regions with high or medium quality that could be differentiated by the consumer, and table wines. From 1870 to 1930, globalization and the phylloxera
transformed the wine sector, as production, productivity and international trade increased. From 1930 onwards another transformation took place, as the outcome of state intervention, definition of wine regions and increasing regulation, catering mostly for protected domestic markets, but with some exports of higher-quality wines. Since 1980 a new transformation took place as the domestic markets of southern European countries increasingly demanded higher-quality wines.
12http://www.viniportugal.pt/AboutUs
It is clear from this study that Portugal’s wine producers were able to adjust with significant rapidity and efficiency to changes in both domestic and international market conditions. Presumably that stemmed from the large wine comparative advantage Portugal has enjoyed over the past 250 years. Despite the growth of the sector, it is only in recent decades that Portugal’s wines have been competing well in international markets, due to the country exporting wines of better quality.
We have defined in this chapter three waves of globalization of Portugal’s wines, each with very different traits. The first wave was that of port exported mainly to Britain, which increased rapidly in the 18th and the first decades of the 19th century, but then declined. The second wave occurred as a consequence of growth of demand for table wines in France because of phylloxera, and this wave came to a halt by the last decades of the 19th century. The third wave occurred at the end of the 20th century and is still on-going. This is occurring in a context of widespread international competition. A key question now regarding this third wave is whether/when it is going to end. Success in this third wave for Portugal is based on previous developments in its domestic market – in contrast to the second wave, when
producers were simply taking advantage of changes in the international markets. Because the latest wave is to a large extent related to parallel changes in the domestic market, they provide a more solid base for such developments. This wave may thus lead to a reversal of fortune for Portugal’s wines in international markets.
Alexandre, V. (2008), ‘A Real Companhia Velha no primeiro quartel do século XIX: o contexto internacional’, pp. 139-149 in A Companhia e as Relações Económicas de Portugal com o Brasil: População e Sociedade 16.
Amaral, L. and D. Freire (2016), ‘Agricultural policy, growth and demise, 1930–2000’, pp. 245-276 in D. Freire and P. Lains (eds.), An Agrarian History of Portugal, 1000-2000: Economic Development on the European Frontier, Leiden: Brill.
Amaro, R.R. (1978), ‘A agricultura portuguesa e a integração europeia: a experiência do passado (EFTA) e a perspectiva do futuro (CEE)’, Análise Social 14(2): 279-310. Anderson, K. and S. Nelgen (2011), Global Wine Markets, 1961 to 2009: A Statistical
Compendium, Adelaide: University of Adelaide Press.
Anderson, K. and H.G. Jensen (2016), ‘How Much Government Assistance do European Wine Producers Receive?’ Journal of Wine Economics 11(2): 289–305.
Anderson, K. and V. Pinilla (with the assistance of A.J. Holmes) (2017), Annual Database of Global Wine Markets, 1835 to 2015, Wine Economics Research Centre, University of Adelaide, to be posted at www.adelaide.edu.au/wine-econ/databases/global-wine-history
Anderson, R.W. (2014), ‘Rent Seeking and the Treaty of Methuen’, Journal of Public Finance and Public Choice 32(1-3): 19-29.
Baptista, F.O. (1993), A Política Agrária do Estado Novo, Porto: Afrontamento.
Cardoso, J.L. (forthcoming), ‘The Anglo-Portuguese Methuen Treaty of 1703: Opportunities and Constraints of Economic Development, In A. Alimento and K. Stapelbroek (eds.), The Politics of Commercial Treaties in the Eighteenth Century: Balance of Power, Balance of Trade, London: Palgrave Macmillan.
Clarence-Smith, G. (1985), The Third Portuguese Empire, 1825-1975: A Study in Economic Imperialism, Manchester: Manchester University Press.
Costa, L., D. Freire and J. Reis (2016), ‘The Chronic Food Deficit of Early Modern Portugal: Curse or Myth?,” Gabinete de História Económica e Social Working Papers 58. Duguid, P. (2005), ‘Networks and Knowledge: The Beginning and End of the Port
Commodity Chain, 1703-1860’, Business History Review 79: 493-526, Autumn. Duguid, P. and T. Silva Lopes (1999), ‘Ambiguous Company: Institutions and Organizations
in the Port Wine Trade, 1814-1834’, Scandinavian Economic History Review 48(1): 84-102.
Fernández, E. (2010), ‘Unsuccessful Responses to Quality Uncertainty: Brands in Spain’s Sherry Industry, 1920–1990’, Business History 52(1): 100–19.
Fernández, E. (2012), ‘Especialización en baja calidad: España y el mercado internacional del vino, 1950-1990’, Historia Agraria 56: 41-76, April.
Fernández, E. and V. Pinilla (2014), ‘Historia económica del vino en España (1850-2000)’, pp. 67-98 in R. Compés López and J.S. Castillo Valero (eds.), La Economía del Vino en España y en el Mundo. Almería: Cajamar Caja Rural.
Freire, D. (2010), Produzir e Beber: A Questão do Vinho no Estado Novo, Lisbon: Âncora. Grantham, G. (1999), ‘Contra Ricardo: On the Macroeconomics of Pre-industrial Economies’,
European Review of Economic History 3(2): 199-232.
Instituto Nacional de Estatística (2016), Estatísticas Agrícolas – 2015, Lisbon: Instituto Nacional de Estatística.
Lains, P. (1986), ‘Exportações portuguesas, 1850-1913: A tese da dependência revisitada’, Análise Social 22(2): 381-419.
Lains, P. (2003), ‘New Wine in Old Bottles: Output and Productivity Trends in Portuguese Agriculture, 1850-1950’, European Review of Economic History 7(1): 43-72. Lains, P. (2007), ‘Growth in a Protected Environment: Portugal, 1850-1950’, Research in
Lains, P. (2009), ‘The Role of Agriculture in Portuguese Economic Development, 1870-1973’, pp. 333-52 in P. Lains and V. Pinilla (eds.), Agriculture and Economic Growth in Europe Since 1870, London: Routledge.
Lains, P. (2016), ‘Agriculture and Economic Development on the European Frontier, 1000-2000’, pp. 277-311 in D. Freire and P. Lains (eds.), An Agrarian History of Portugal, 1000-2000: Economic Development on the European Frontier, Leiden: Brill.
Lains, P. and P. Silveira e Sousa (1998), ‘Estatística e produção agrícola em Portugal, 1848-1914’, Análise Social 33(5): 935-68.
Lanero, D. (2014), ‘The Portuguese Estado Novo: Programmes and Obstacles to the
Modernization of Agriculture, 1933-1950’, pp. 85-111 in L. Fernández Prieto, L. Pan Montojo and M. Cabo Villaverde (eds.), Agriculture in the Age of Fascism:
Authoritarian Technocracy and Rural Modernization, 1922-194, Turnhout: Brepols. Lopes, T. da Silva (2005), ‘Competing with Multinationals: Strategies of the Portuguese
Alcohol Industry’, Business History Review 79: 559-85, Autumn.
Martínez-Carrión, J.M. and F.J. Medina-Albaladejo (2010), ‘Change and Development in the Spanish Wine Sector, 1950–2009’, Journal of Wine Research 21(1): 77–95.
Martins, C.A. (1988), ‘Os ciclos do vinho do Porto: ensaio de periodização’, Análise Social 24(1): 391-429.
Martins, C. A. (1990), Memória do Vinho do Porto, Lisbon: Instituto de Ciências Sociais da Universidade de Lisboa.
Martins, C.A. (1991), ‘A filoxera na viticultura nacional’, Análise Social 26(3-4): 653-88. Martins, C.A. (1996), ‘A intervenção política dos vinhateiros no século XIX’, Análise Social
31(2-3): 413-35.
Martins, C.A. (1998), , Vinha, Vinho e Política Vinícola Nacional. Do Pombalismo à Regeneração. 3 Vols. Unpublished PhD Dissertation, Universidade de Évora.
Martins, C.A. (2005), ‘A agricultura’, pp. 219–58 in P. Lains and Á. Ferreira da Silva (eds.), História Económica de Portugal, 1700–2000, Volume 2, Lisbon: Imprensa de Ciências Sociais.
Matias, M.G. (2002), Vinho e Vinhas em Tempo de Crise: O Oídio e a Filoxera na Região Oeste, 1850-1890, Caldas da Rainha: Património Histórico-Grupo de Estudos. Meloni, G. and J. Swinnen (2013), ‘The Political Economy of European Wine Regulations’,
Journal of Wine Economics 8(3): 244–84.
Meloni, G. and J. Swinnen (2014), ‘The Rise and Fall of the World’s Largest Wine Exporter and its Institutional Legacy’, Journal of Wine Economics 9(1): 3–33.
Palma, N. and J. Reis (2016), ’From Convergence to Divergence: Portuguese Demography and Economic Growth’, Groningen Growth and Development Centre Research Memorandum 161, University of Groningen, Groningen.
Pan-Montojo, J. (2009), ‘Las vitiviniculturas europeas: de la primera a la segunda globalización’, Mundo Agrario 9(1).
Pereira, G.M. (2008), ‘Nos 250 anos da região demarcada do Douro: Da companhia pombalina à regulação interprofissiona’, pp. 175-85 in A Companhia e as relações económicas de Portugal com o Brasil: População e Sociedade 16.
Pereira, M.H. (1983), Livre-Câmbio e Desenvolvimento Económico, Lisbon: Sá da Costa Editora.
Pinilla, V. and M.I. Ayuda (2002), ‘The Political Economy of the Wine Trade: Spanish Exports and the International Market, European Review of Economic History 6(1): 51-85.
Pinilla, V. and M.I. Ayuda (2007), ‘The International Wine Market, 1850-1938: An
N. Gibert (eds.), Wine Society and Globalization: Multidisciplinary Perspectives on the Wine Industry, New York: Palgrave Macmillan9.
Pinilla, V. and R. Serrano (2008), ‘The Agricultural and Food Trade in the First
Globalization: Spanish Table Wine Exports 1871 to 1935, A Case Study’, Journal of Wine Economics 3(2): 132-48.
Plano Estratégico para a Internacionalização do Sector de Vinhos de Portuga, ViniPortugal (no publication date).
Reis, J. (2016), ‘Gross Agricultural Output: A Quantitative, Unified Perspective, 1500-1850’, In Dulce Freire and Pedro Lains (Eds.), pp. 172-216 in An Agrarian History of
Portugal. Economic Development on the European Frontier, 1000-2000, Leiden: Brill.
Ricardo, D. (1817), On The Principles of Political Economy and Taxation, London: John Murray Albemarle-Street (third edition 1821).
Serrão, J.V. (2009), ‘Land Management Responses to Market Changes: Portugal Seventeenth to Nineteenth Centuries’, pp. 47-73 in V. Pinilla (ed.),Markets and Agricultural Change in Europe from the Thirteenth to the Twentieth Centuries, Turnhout: Brepols. Serrão, J. V. (2016), ‘Extensive Growth and Market Expansion, 1703-1820’, pp. 132-71 in D.
Freire and P. Lains (eds.), An Agrarian History of Portugal, 1000-2000: Economic Development on the European Frontier, Leiden: Brill.
Simpson, J. (2000), ‘Cooperation and Cooperatives in Southern European Wine Production: The Nature of a Successful Institutional Innovation, 1880-1950’, pp. 95-126 in K.D. Kauffman (ed.), New Frontiers in Agricultural History, Bradford: Emerald.
Simpson, J. (2011), Creating Wine: The Emergence of a World Industry, 1840-1914, Princeton: Princeton University Press.
Soares, F.B. (2005), ‘A agricultura’, pp. 157-83 in P. Lains and Á. Ferreira da Silva (eds.), História Económica de Portugal, 1700–2000, Volume 3, Lisbon: Imprensa de Ciências Sociais.
Figure 7.1: Volume of wine and total agricultural output, 1750 to 2015 (real values, semi-logarithmic scale, 1953 = 100)
Sources: Total output: 1750-1848, Reis (2016); 1848-1997, Lains (2007); 1997-2015, Contas Económicas da Agricultura, Instituto Nacional de Estatística (2016). Wine output: 1772-1835, Martins (1998); 1835-2015, Anderson and Pinilla (2017).
1 10 100 1000 17 50 17 55 17 60 17 65 17 70 17 75 17 80 17 85 17 90 17 95 18 00 18 05 18 10 18 15 18 20 18 25 18 30 18 35 18 40 18 45 18 50 18 55 18 60 18 65 18 70 18 75 18 80 18 85 18 90 18 95 19 00 19 05 19 10 19 15 19 20 19 25 19 30 19 35 19 40 19 45 19 50 19 55 19 60 19 65 19 70 19 75 19 80 19 85 19 90 19 95 20 00 20 05 20 10 20 15 Wine output
Figure 7.2: Volume of port wine production and exports, Portugal, 1772 to 1850 (KL) Source: Martins (1990, pp. 229-30). 0 100000 200000 300000 400000 500000 600000 17 72 17 75 17 78 17 81 17 84 17 87 17 90 17 93 17 96 17 99 18 02 18 05 18 08 18 11 18 14 18 17 18 20 18 23 18 26 18 29 18 32 18 35 18 38 18 41 18 44 18 47 18 50 Output Exports
Figure 7.3: Share of wine production exported, and wine’s share of all merchandise exports, Portugal, 1855 to 2015 (%, 3-year moving average)
Source: Anderson and Pinilla (2017). 0 10 20 30 40 50 60 18 57 18 63 18 69 18 75 18 81 18 87 18 93 18 99 19 05 19 11 19 17 19 23 19 29 19 35 19 41 19 47 19 53 19 59 19 65 19 71 19 77 19 83 19 89 19 95 20 01 20 07 20 13
Share of wine prod'n exported Wine's share of merch exports
Figure 7.4: Wine production per hectare, Portugal, 1865 to 2015 (litres per hectare)
Source: Author’s computation from data in Anderson and Pinilla (2017). 0 1000 2000 3000 4000 5000 6000 18 65 18 70 18 75 18 80 18 85 18 90 18 95 19 00 19 05 19 10 19 15 19 20 19 25 19 30 19 35 19 40 19 45 19 50 19 55 19 60 19 65 19 70 19 75 19 80 19 85 19 90 19 95 20 00 20 05 20 10 20 15
Figure 7.5: Portugal’s shares of global wine production and exports, 1860 to 2015 (%)
Source: Anderson and Pinilla (2017).
0 1 2 3 4 5 6 7 8 9 10