Article
Printed in Brazil - ©2016 Sociedade Brasileira de Química0103 - 5053 $6.00+0.00*e-mail: [email protected], [email protected]
Determination of Phenolic Acids and Quercetin in Brazilian Red Wines from
Vale do São Francisco Region Using Liquid-Liquid Ultrasound-Assisted Extraction
and HPLC-DAD-MS
Fabio de S. Dias,*,a Jorge M. David*,b and Juceni P. Davidb
aCentro de Ciências Exatas e Tecnológicas, Universidade Federal do Recôncavo da Bahia,
44380-000 Cruz das Almas-BA, Brazil
bInstituto de Química, Universidade Federal da Bahia, Campus Ondina, 40170-290 Salvador-BA, Brazil
This work describes a method for the determination of gallic, caffeic and p-coumaric acids,
as well as quercetin, in Brazilian red wines by employing reverse phase high performance liquid chromatography (RP HPLC) coupled to diode array and mass detectors. The method was performed using a sample volume of 10 µL. The limits of detections were 0.36, 0.27, 0.33 and 0.59 mg L-1 for gallic acid, caffeic acid, p-coumaric acid and quercetin, respectively. The precision, as estimated
by the relative standard deviation, was between 1.0 and 2.0% for different concentrations of gallic acid, caffeic acid, p-coumaric acid and quercetin. The accuracy was evaluated by addition and
recovery experiments, and the obtained values were between approximately 92 and 117% recovery. The method was then applied to the analysis of red wine samples that were collected from the São Francisco region, Bahia State, Brazil. The concentrations of analytes were determined in ten Brazilian wines and varied from 5.26 to 10.22 mg L-1 for quercetin, 6.65 to 43.92 mg L-1 for gallic acid, 3.58 to 7.83 mg L-1 for p-coumaric acid, and 3.59 to 10.5 mg L-1 for caffeic acid.
Keywords: chromatographic separation, quercetin, Brazilian red wine, cinnamic acid derivative
Introduction
It has been reported that phenolic compounds can be of biological benefit to humans by promoting anti-inflammatory, antimicrobial, anticoagulant and antioxidant activities.1 It has
been suggested that moderate wine intake provides protection against CHD (coronary heart disease) due to the antioxidant properties of its phenolic acids, which delay the onset of
atherogenesis and regulate thrombotic tendencies.2 The
relative contribution of phenolic derivatives to antioxidation is associated with their effectiveness as hydrogen donors, which is dependent on the number and of hydroxyl groups and the extent conjugation, as well as the presence of electron-donating and electron-withdrawing substituents
on the aromatic ring.3 The occurrence of flavonoids is very
common in leaves and fruits,4 although it is believed that
the antioxidant properties of red wines are linked with total
polyphenol concentrations5 rather than specific compounds.
The polyphenolic derivatives of red grape skin and seeds have some important secondary compounds that are also
responsible for antioxidant activity. There are analytical studies about wines analysis that have been reported in the
literature.6 Many methods have been used to determine the
phenolic compounds in wine, but high performance liquid chromatography (HPLC) is the method of choice for this
analysis7 and is often coupled with UV-Vis, diode array
detection (DAD),8 electrochemical (ED),9 mass spectrometry
(MS)10 and fluorescence detectors (FD).11 The present work
describes the determination of gallic acid, caffeic acid,
p-coumaric acid and quercetin in Brazilian wines produced
in the Vale do São Francisco region. This process employs ultrasound extraction and HPLC combined with diode array detectors and mass spectrometry. The method enabled the identification and determination of phenols in different types of wines.
Experimental
Reagents and solvents
used in the process were HPLC grade. Water was supplied by a Millipore (Bedford, MA, USA) Milli-Q water purifier and was used after filtration through a 0.45-µm pore size membrane filter. Standards of all the phenolics investigated were obtained from Sigma-Aldrich (St. Louis, MO, USA).
The phenolic stock solution (100 mg L-1) was prepared in
ethanol-water (1:1). The stock solution was diluted to give different standard solutions.
Sample preparation
Ten samples of different types of red wine were purchased from commercial markets in the city of Salvador (Bahia, Brazil). The samples were chosen for being representative of wines (Shiraz, Cabernet Sauvignon, Shiraz, Tanat, Petite Shirazand the blend Cabernet Sauvignon/Shiraz) produced in the Vale do São Francisco
region, Brazil. All wines were stored in the dark at 4 °C
until their analysis.
Extraction procedures
The following procedure was used to extract phenolic compounds from wine: 20 mg sodium chloride and 20 mg sodium metabisulfite were added to 10 mL of wine, which was then subjected to three continuous liquid-liquid extractions with 3 mL of ethyl acetate acidified by 37% aqueous hydrochloric acid for 10 min in ultrasound. The extract was evaporated using a rotary evaporator and then dissolved in 1 mL of an ethanol/water solution (10:90 v/v).
Analysis
The analysis of the samples was performed with an HPLC-DAD-MS model 2010 A in a Shimadzu system (Kyoto, Japan) consisting of an auto sampler LC SIL 10 AD; an ESI (electrospray ionization) interface operating in negative mode with an ion spray voltage of 3000 V and a capillary temperature of 350 °C, the nebulizing
gas flow (N2) of 40 mL min-1. The instrument was auto
tuned for optimum ionization process and sensitivity
with polyethylene glycol (PEG) and p-nitro-phenol.
Quadrupole mass spectrometer data were collected in
full scan mode within a range from 100 to 600 m/z with a
photodiode array detector (DAD 100). A column C18, 2.1 × 75 mm (particle diameter 3.5 µm) and a guard column (4.6 mm internal diameter × 12.5 mm) Agilent (California, USA), were employed. The mobile phase was composed of water acidified with formic acid (pH = 3.0, solvent A) and
methanol (solvent B); a flow rate of 0.6 mL min-1 was used.
The following gradient was used: 0-2 min, 15% B; 2-7 min,
15-30% B; 11-15 min, 30-80% B (cleaning the column); 15-20 min, 80-15% B (return of the initial conditions). UV absorbance was monitored from 200 to 400 nm.
Results and Discussion
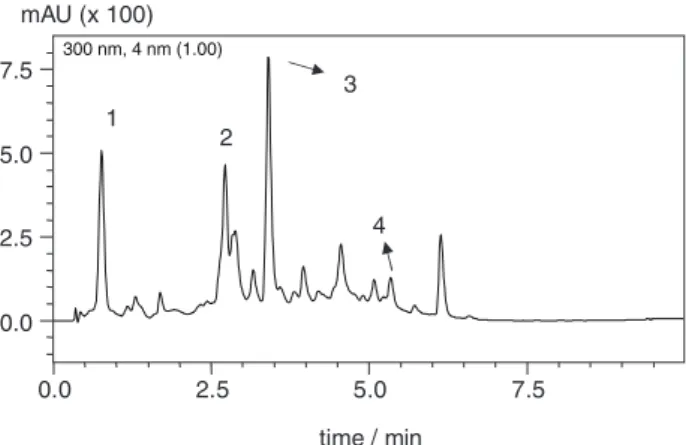
The phenolic compounds were identified by comparing retention times, UV-Vis spectra and mass spectra obtained from real samples, pure standards (Figures 1 and 2), and real samples spiked with different concentration levels (Table 1). Absorption spectra obtained using a 280 nm wavelength were utilized to determine the phenolic compounds.
Identification and determination of quercetin, gallic acid, caffeic acid and p-coumaric acid in Brazilian wines
Based on the mass spectrum base peak and on the retention times of compounds (Table 2), it was possible to identify and quantify gallic acid, caffeic acid,
p-coumaric acid and quercetin in wines produced in Vale
do São Francisco. By analyzing the MS (Supplementary
Figure 1. Chromatogram of the standard mixture (peaks 1: gallic acid; 2: caffeic acid; 3: p-coumaric acid and 4: quercetin).
Figure 2. Chromatogram of a representative sample of Brazilian red wine, Cabernet Sauvignon. Peaks 1: gallic acid; 2: caffeic acid; 3: p-coumaric
Information section), it was possible to observe the presence
of gallic acid by a negative pseudo-molecular ion ([M – H]−)
at m/z 169 corresponding to gallic acid besides the peak at
m/z 338, which was due to the adduct that formed between
two pseudo-molecular ions ([M – H]− + [M – H]−). Caffeic
acid presents an [M – H]− at m/z 179 (with an adduct peak
at m/z 358). p-Coumaric acid yields an [M – H]− at m/z 163,
whereas a peak that is observed at m/z 209 corresponds to
the formation of an adduct between the molecular ion and
formic acid from the mobile phase ([M – H]− + HCOOH).
The presence of quercetin is indicated by the pseudo-molecular ion [M – H]− at m/z 301.
Analytical features
The analytical curves were obtained using standard solutions at different concentrations for each analyte. The corresponding regression equations and other characteristic parameters that were used to determine the phenolic compounds are shown in Table 3. The analytical curves exhibit excellent linear behavior over the concentration range that was under study.
The limit of detection (LOD) and the limit of quantification (LOQ) were established by analyzing
the calibration curves.12 The LOD ranged from 0.27 to
0.59 mg L-1 and the LOQ ranged from 0.90 to 1.96 mg L-1
for all analytes (Table 3).
Relative standard deviations (RSD) calculated for
concentrations of 10 and 30 mg L-1 were 1.40 and 1.20%
for gallic acid, 1.63 and 1.08% for caffeic acid, 1.73
and 1.07% for p-coumaric acid and 1.72 and 1.28% for
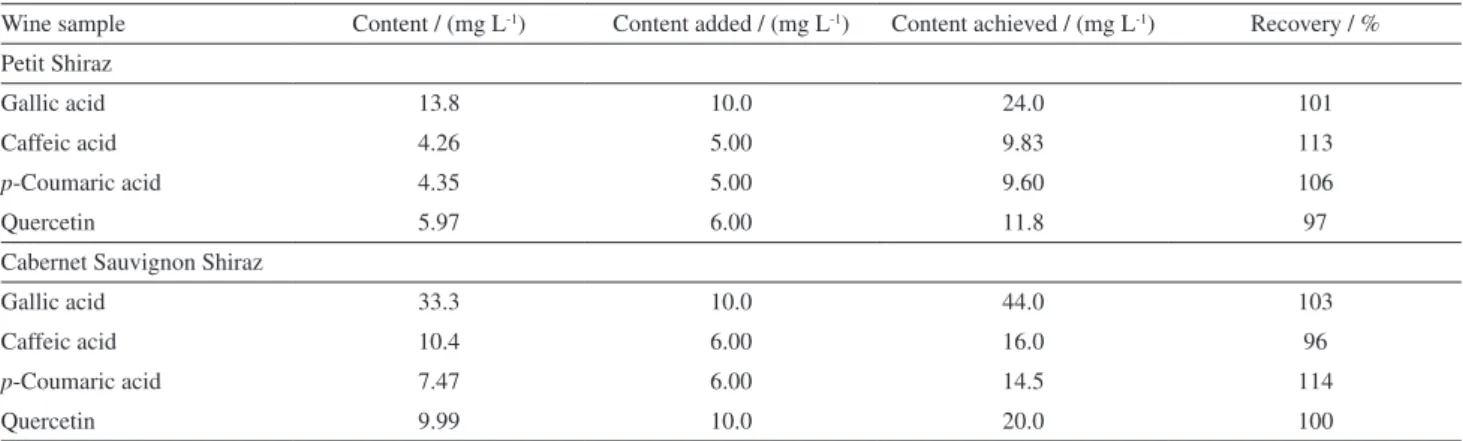
quercetin, respectively. In order to evaluate accuracy of the method, addition and recovery tests were performed by comparing the concentrations of the analytes found in four wine samples spiked with known amounts of each polyphenol. The concentrations were then obtained using the corresponding calibration curve, which yielded values that were between approximately 92 and 117% of the recovery (Table 1).
Application
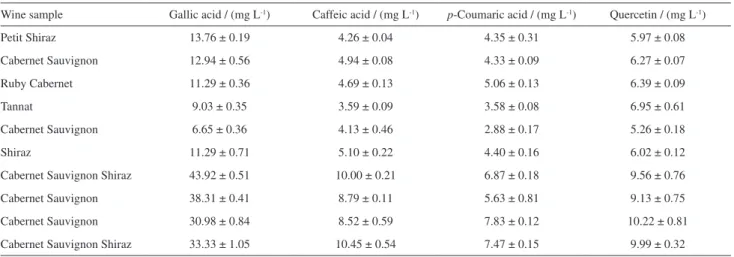
Table 4 shows the concentrations of these compounds, as was determined for ten Brazilian wines: quercetin
concentrations varied from 5.26 to 10.22 mg L-1, gallic
acid varied from 6.65 to 43.92 mg L-1, p-coumaric
acid varied from 3.58 to 7.83 mg L-1, and caffeic acid
varied from 3.59 to 10.5 mg L-1. Concentration data
concerning the concentrations of gallic acid, caffeic acid,
p-coumaric acid and quercetin found in wines produced
in a number of regions have been reported in the literature
(Table 5). Minuti and Pellegrino13 have found an array of
concentrations for different phenolic acids (and quercetin) in
red wines, including 33.78 to 104.82 mg L-1 for gallic acid,
0.24 to 4.10 mg L-1 for caffeic acid, 0.30 to 3.39 mg L-1 for
p-coumaric acid and 0.03 to 0.98 mg L-1 for quercetin. For
wines produced in Hungary, concentration values varied from 29.7 to 79.2 mg L-1 for gallic acid, from 23.3 to 30.8 mg L-1
for caffeic acid, from 0.4 to 8.9 mg L-1 for p-coumaric acid,
varying from 5.80 to 13.40 mg L-1 for quercetin.14
The wide range of phenolic compound concentrations obtained in this work can be explained, at least in part, by the analytical and natural variability of the data. The
Table 1. Spiked tests for gallic acid, caffeic acid, p-coumaric acid, and quercetin in Brazilian wines from Vale do São Francisco. Concentrations (mg L-1) were obtained by the HPLC-DAD-MS method developed within
Wine sample Content / (mg L-1) Content added / (mg L-1) Content achieved / (mg L-1) Recovery / % Petit Shiraz
Gallic acid 13.8 10.0 24.0 101
Caffeic acid 4.26 5.00 9.83 113
p-Coumaric acid 4.35 5.00 9.60 106
Quercetin 5.97 6.00 11.8 97
Cabernet Sauvignon Shiraz
Gallic acid 33.3 10.0 44.0 103
Caffeic acid 10.4 6.00 16.0 96
p-Coumaric acid 7.47 6.00 14.5 114
Quercetin 9.99 10.0 20.0 100
Table 2. Selective ion monitoring of a target and retention time for each of the phenolic compounds
Analyte Retention time / min [M – H]– (m/z)
Gallic acid 0.75 169
Caffeic acid 2.7 179
p-Coumaric acid 3.4 163
phenolic composition of red wines is highly complex and closely related to the origin of the grapes, soil type, climate and the wine’s production and conservation processes.
The reported data on phenolic compound levels found in Brazilian wines produced in Vale do São Francisco are in accordance with the values that have been found in wine samples from several countries.
Conclusions
In the present work, we described a simple and sensitive method that allows for the determination of
quercetin, gallic acid, caffeic acid and p-coumaric acid
in the Brazilian red wines of the Vale do São Francisco
region. This procedure, which is suitable for routine analyses, includes a stage of ultrasound-assisted liquid-liquid extraction that is followed by a chromatographic quantification step. The method is characterized by good precision, linearity and accuracy. The optimized procedure was applied to a wide range of red wines to provide a general knowledge regarding the content of common antioxidants in wines.
Supplementary Information
Supplementary data (ESI mass spectra of the phenolics) are available free of charge at http://jbcs.sbq.org.br as PDF file.
Table 3. Analytical features of the developed HPLC method
Analyte LODa / (mg L-1) LOQb / (mg L-1) Analytical curve Determination coefficient (R2)
Gallic acid 0.36 1.19 Abs = 34330C – 14743 0.997
Caffeic acid 0.27 0.90 Abs = 150669C – 350791 0.998
p-Coumaric acid 0.33 1.10 Abs = 243971C – 5435 0.998
Quercetin 0.59 1.96 Abs = 37745C – 179854 0.999
aLOD was calculated according to the expression DP × 3/IC, where DP is the standard deviation of the response and IC is the slope of the calibration curve; bLOQ was established by using the expression DP × 10/IC.
Table 4. Concentrations of gallic, caffeic and p-coumaric acids and quercetin found in Brazilian wines
Wine sample Gallic acid / (mg L-1) Caffeic acid / (mg L-1) p-Coumaric acid / (mg L-1) Quercetin / (mg L-1)
Petit Shiraz 13.76 ± 0.19 4.26 ± 0.04 4.35 ± 0.31 5.97 ± 0.08
Cabernet Sauvignon 12.94 ± 0.56 4.94 ± 0.08 4.33 ± 0.09 6.27 ± 0.07
Ruby Cabernet 11.29 ± 0.36 4.69 ± 0.13 5.06 ± 0.13 6.39 ± 0.09
Tannat 9.03 ± 0.35 3.59 ± 0.09 3.58 ± 0.08 6.95 ± 0.61
Cabernet Sauvignon 6.65 ± 0.36 4.13 ± 0.46 2.88 ± 0.17 5.26 ± 0.18
Shiraz 11.29 ± 0.71 5.10 ± 0.22 4.40 ± 0.16 6.02 ± 0.12
Cabernet Sauvignon Shiraz 43.92 ± 0.51 10.00 ± 0.21 6.87 ± 0.18 9.56 ± 0.76
Cabernet Sauvignon 38.31 ± 0.41 8.79 ± 0.11 5.63 ± 0.81 9.13 ± 0.75
Cabernet Sauvignon 30.98 ± 0.84 8.52 ± 0.59 7.83 ± 0.12 10.22 ± 0.81
Cabernet Sauvignon Shiraz 33.33 ± 1.05 10.45 ± 0.54 7.47 ± 0.15 9.99 ± 0.32
Table 5. Review about the concentration of gallic acid, caffeic acid, p-coumaric acid and quercetin concentrations in wine from different regions
Country Gallic acid Caffeic acid p-Coumaric acid Quercetin Reference
Italy 33.8-104.8 0.24-4.10 0.30-3.39 0.03-0.98 13
Hungary 29.7-79.2 23.3-30.8 0.4-8.9 5.80-13.4 14
Czech Republic 1.4 0.46-0.8 0.18-0.8 NDa 15
Spain – 6.6-21.26 11.67-14.19 7.4-9.75 16
Brazil 6.7- 44.0 3.6-10.5 2.88-7.9 5.3-10.3 this work
Acknowledgments
The authors are grateful to PRONEX/FAPESB, Conselho Nacional de Desenvolvimento Científico e Tecnológico (CNPq) and CAPES for providing grants and fellowships.
References
1. Barreiros, A. L. B. S.; David, J. M.; David, J. P.; Quim. Nova
2006, 29, 113.
2. Frankel, E. N.; Kanner, J.; German, J. B.; Parks, E.; Kinsella, J. E.; Lancet 1993, 341, 454; Pandey, K. B.; Rizvi, S. I.; J. Braz. Chem. Soc. 2010, 21, 909.
3. Rice-Evans, C. A.; Miller, N. J.; Bolwell, P. G.; Bramley, P. M.; Escarpa, A.; Gonzalez, M. C.; J. Chromatogr. A 2000, 897, 161;
Miller, N. J.; Rice Evans, C. A.; Davies, M. J.; Clin. Sci. 1993,
84, 407.
4. Barreiros, A. L. B. S.; David, J. M.; David, J. P.; de Queiroz, L. P.; Phytochemistry 2000, 55, 805; Felício, J. D.; Rossi,
M. H.; Park, H. R.; Gonçalvez, E.; Braggio, M. M.; David, J. M.; Cordeiro, I.; Fitoterapia 2001, 72, 453.
5. Esparza, I.; Santamaría, C.; Calvo, M. I.; Fernández, J. M.;
Microchem. J. 2009, 9132.
6. Bentlin, F. R. S.; Pulgati, F. H.; Dressler, V. L.; Pozebon, D.;
J. Braz. Chem. Soc. 2011, 22, 327; Welke, J. E.; Hoeltz, M.;
Dottori, H. A.; Noll, I. B.; J. Braz. Chem. Soc. 2010, 21, 441; Dias, F. S.; Silva, M. F.; David, J. M.; Food Anal. Methods 2013,
6, 963; Welke, J. E.; Zanus, M.; Lazarotto, M.; Schmitt, K. G.; Zini, C. A.; J. Braz. Chem. Soc. 2012, 23, 678.
7. Pereira, V.; Câmara, J. S.; Cacho, J.; Marques, J. C.; J. Sep. Sci.
2010, 33, 1204; Mercolini, L.; Saracino, M. A.; Bugamelli, F.;
Ferranti, A.; Malaguti, M.; Hrelia, S.; Raggi, M. A.; J. Sep. Sci.
2008, 31, 1007.
8. Aznar, Ò.; Checa, A.; Oliver, R.; Hernández-Cassou, S.; Saurina, J.; J. Sep. Sci. 2011, 34, 527.
9. Kolouchová-Honzlíková, I.; Melzoch, K.; Filip, V.; Smidrkal, J.;
Food Chem. 2004, 87, 151.
10. Flamini, R.; Mass Spectrom. Rev. 2003, 22, 218; Spácil, N. Z. L.; Solich, P.; Talanta 2008, 76, 189.
11. Vitrac, X.; Monti, J. P.; Vercauteren, J.; Deffieux, G.; Mérillon, J. M.; Anal. Chim. Acta 2002, 458, 103; Dias, F. S.; Lovillo, M.
P.; Barroso, C. G.; David, J. M.; Microchem. J. 2010, 96, 17. 12. Numanoğlu, E.; Boyaci, İ. H.; Topcu, A.; J. Food Drug Anal.
2008, 16, 74.
13. Minuti, L.; Pellegrino, R.; J. Chromatogr. A 2008, 1185, 23.
14. Nikfardjam, M. S. P.; Márk, L.; Avar, P.; Figler, M.; Ohmacht, R.;
Food Chem. 2006, 98, 453.
15. Sladkovský, R.; Solich. P.; Urbánek, M.; J. Chromatogr. A 2004,
1040, 179.
16. Rodríguez-Delgado, M. A.; Pérez, M. L.; Corbella, R.; González, G.; García Montelongo, F. J.; J. Chromatogr. A 2000, 87, 427.
Submitted: August 25, 2015