Manuscript prepared for an international journal Date: 11 June 2017
Classroom ventilation with manual opening of
windows: Findings from a two-year-long
experimental study of a Portuguese secondary school
Rog´erio Duarte
1, Maria da Gl´oria Gomes
2, and Ant´onio Moret Rodrigues
21CINEA, DEM, Escola Superior de Tecnologia de Set´ubal, Instituto Polit´ecnico de Set´ubal,
Campus do IPS, Estefanilha, 2914-761 Set´ubal, Portugal.
2CEris, ICIST, DECivil, Instituto Superior T´ecnico, Universidade de Lisboa, Av. Rovisco Pais 1,
1049-001 Lisbon, Portugal
Correspondence to:Rog´erio Duarte ([email protected])
Abstract. Classrooms in Southern Europe are traditionally ventilated with manual opening of windows. This is an energy-sparing and perfectly appropriate way of ventilating classrooms when weather conditions are warm, however, as outdoor air temperatures drop, teaching staff and students tend to leave windows closed and, as a consequence, ventilation rates fall leading to poor indoor air quality. To safeguard classrooms’ indoor air quality and promote energy conservation, understanding
5
the conditions for which manual window-airing is appropriate is of great relevance. Yet, given the stochastic nature of window-airing, it is difficult to get hold of this understanding. The main objective of this paper is to find out when manual window-airing of classrooms is appropriate. To achieve this objective, four free-running classrooms of a Portuguese public secondary school were monitored during a two-year period. Ventilation rates were determined and it is concluded that
10
manual opening of windows provides appropriate ventilation for outdoor running mean temperatures larger than 160C; and, for the studied classrooms, this translates into appropriate ventilation for
approximately a quarter of the academic year. Because of the significance of this result, the paper concludes with a review of the ventilation strategy used in the studied classrooms.
Keywords. Natural ventilation; free-running classrooms; manual window-airing; window opening
15
patterns; indoor air quality; thermal comfort.
Highlights
– Ventilation rates in four free-running classrooms are determined during two full academic years.
– Manual window-airing of classrooms is appropriate with outdoor running mean temperatures
20
larger than 190C.
– For outdoor running mean temperatures between 16 and 190C manual window-airing is still
appropriate, but depends on indoor air temperature.
– When outdoor running mean temperatures are lower than 160C, regardless of indoor air
tem-perature, manual window-airing is inappropriate.
25
– For the studied classrooms, manual window-airing provides appropriate indoor air quality and thermal comfort for 25% of the academic year.
Nomenclature
acr : Air change rate, s´1.
c : Relative CO2concentration (relative to
the outdoor concentration), ppm. C : Absolute CO2concentration, ppm.
d : Current day. D : Set in R2.
Esol : Solar energy, MJ/m2.
I : Interval in R. 9
M : Metabolic CO2production rate per person,
cm3/s/person.
n : Number of students per lesson, persons. N : Number of elements in a list.
P : probability mass function, adimensional. Q : Ventilation rate per person, m3/s per person. R : Precipitation, mm. RH : Relative humidity, %. t : Time, s. T : Temperature,0C. V : Volume, m3. WS : Wind speed, m/s.
α : Constant used to define running mean temperature.
∆ : Referring to change of a quantity. ř
: Referring to daily total or sum. Subscripts
0 : Referring to initial condition. f : Referring to final condition. in : Referring to indoor. out : Referring to outdoor. Superscripts
: Referring to daily mean or median. cl` : Referring to the region to the right
of contour line cl g : Referring to graph. rm : Referring to running mean. 30
1 Introduction
Classrooms in Southern European countries are traditionally naturally ventilated. During the inter-mediate seasons, windows are opened and occupants welcome the fresh outdoor airflow into the classrooms. As days become warmer, the risk of overheating increases, however, this risk is re-duced with correctly-sized windows, appropriate solar protection, night-time ventilation and the use
35
of building mass.
During wintertime, Southern Europe’s mild climate and the use of passive solar heating allows acceptable indoor thermal environments in naturally ventilated classrooms. However, this is possible only if ventilation rates are kept at a minimum; indeed, during wintertime, the inflow of cold outdoor air causes draughts and occupants reaction is to leave classroom windows closed; as a result, the
40
likelihood of poor indoor air quality increases.
Supporting this line of reasoning, reports pertaining to different geographic locations confirm the prevalence of poor indoor air quality in naturally ventilated classrooms, especially with cold weather (Santamouris et al., 2008; Pegas et al., 2011; Almeida and Freitas, 2014; Pereira et al., 2014). These reports are cause for concern, since poor indoor air quality in classrooms has been
as-45
sociated with undesirable effects on students productivity (Wargocki and Wyon, 2007a,b; Haverinen-Shaughnessy et al., 2011; Bak´o-Bir´o et al., 2012; Petersen et al., 2015), absenteeism (Shendell et al., 2004) and increased health symptoms (Fraga et al., 2008; Bartlett et al., 2004; Rudnick and Milton, 2003; Mendell and Heath, 2005). Still, in spite of these concerns, along the academic year there are conditions for which natural ventilation is perfectly appropriate, and, from the point of view of
50
users, better than mechanical ventilation alternatives.
In fact, mechanical systems have problems too; if not properly balanced and maintained, they are frequently a source of thermal discomfort, noise and can even increase indoor air pollution, as discussed in Bluyssen (1996), Mendell and Smith (1990), Sepp¨anen and Fisk (2002), Clements-Croome et al. (2008) or Mumovic et al. (2009). Additionally, mechanical systems come with
in-55
to free natural ventilation, small (or no) heating costs and small maintenance costs.
Indeed, since European countries invest mostly in the retrofitting of existing naturally ventilated schools (Gertis and Sedlbauer, 2010; Mumovic et al., 2009), school staff will inevitably compare natural ventilation with alternative hybrid or mechanical ventilated solutions. Moreover, because
60
staff is aware of the benefits and accustomed to natural ventilation, an important research question— useful to designers and school administrators—is to know when the traditional natural ventilation with manual opening of windows is appropriate and when it is not. In other words, it is important to know the conditions for which natural ventilation with opening of windows ensures appropriate indoor air quality.
65
This is the main topic of this paper. Obviously, because natural ventilation depends on archi-tectural design, on the building envelope, on the role played by occupants, as well as the outdoor and indoor environments, another associated research topic is to reconcile natural ventilation results with passive design solutions used in the classrooms and with the use of windows.
To determine the conditions for which natural ventilation is appropriate the paper starts by
pre-70
senting the research setting: Four classrooms of a Portuguese secondary school were selected and monitored during a two-year period. The paper describes the classrooms, explains how the class-rooms were used and describes the outdoor and indoor physical environment. Next, the method used to determine classroom ventilation is explained and applied. Statistical methods are used to examine and interpret classroom ventilation results and to derive the conditions for which natural ventilation
75
is appropriate. A review of the natural ventilation results taking into consideration the character-istics of the studied classrooms and the use of windows is then presented. This review highlights best practices in natural ventilation design and provides clues relevant to those (designers and school administrators) seeking information on when to use natural ventilation, ensuring classroom indoor air quality and thermal comfort.
2 Description of the classrooms
Four classrooms of a secondary public school located in Lisbon, Portugal, were studied. The school was built in late 1940s in a traditional neighbourhood removed from commercial and heavy traffic areas. Its location is currently home to a diverse and cosmopolitan population and this is reflected in the ethnic diversity of students, with classes including a significant proportion of non-Portuguese
85
students, native of Africa, Asia, South America and Eastern European countries (teachers, however, are mostly Portuguese). In 2007, the school was one among several Portuguese public schools to be refurbished to contemporary standards (Parque Escolar, 2011a). Details on architectural standards and building services engineering standards guiding the refurbishing programme are provided in Parque Escolar (2009a) and Parque Escolar (2009b).
90
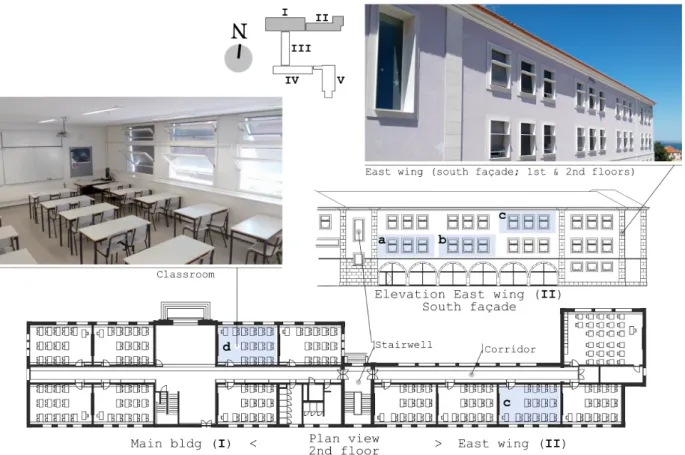
The school consists of five buildings arranged in U-shape, as shown is the generic layout at the top of Figure 1. The Main Building (I) is linked to an East Wing (II) and, through a Connecting Building (III), to a South Wing (IV). The South Wing is connected, in turn, to a Gymnasium (V). A plan view of the of the Main Building and East Wing (2ndfloor) is included in Figure 1. Additionally, an elevation of the East Wing (south fac¸ade) is also represented. The four studied classrooms are
95
highlighted and identified with letters a, b, c and d.
Classrooms a and b are located on the 1stfloor of the East Wing, and are identical to classroom
clocated on the 2ndfloor. Classroom d is the only one located at the Main Building and, contrary to
the remaining classrooms, is on the north fac¸ade.
Additional elements included in Figure 1 are photographs of a classroom and of the East Wing
100
south fac¸ade.
Access to classrooms a, b and c is via indoor corridors—identified in the 2nd floor plan view, Figure 1. Corridors have outdoor windows (seven each, oriented north, of the same type as class-room windows but with larger area), used for daylighting and ventilation purposes. Indoor corridors
105
communicate with a stairwell—also identified in Figure 1—providing access to the different floors of both the Main Building and the East Wing. The stairwell has one large window facing south and,
Fig. 1: The studied classrooms highlighted and identified with letters a, b, c and d.
at the 2ndfloor, one smaller window facing north. Both these windows are used for daylighting but
only the north-facing window is suited for ventilation.
With the recent refurbishment, most of the original fac¸ade characteristics were kept and the
110
large building mass typical of the 1940s construction was preserved, however, the envelope air-tightness was improved with the replacement of the existing windows by new ones. Fixed shading devices were also added. Table 1 presents a summary of the classrooms’ characteristics. A detailed description of the classrooms’ ventilation strategy is presented in the following section.
Table 1: Characteristics of the studied classrooms (Parque Escolar, 2009a,b, 2010, 2011a,b).
Geometry
Floor area:54 m2(9 ˆ 6 m2) headroom:3 m
Walls, floor and ceiling
Exterior wall: Stone masonry 65 cm thick (no thermal insulation layer).
Interior wall: Ceramic brick masonry 33 cm thick.
Floor/ ceiling: Reinforced concrete slab with a self-levelling cementitious floor covering. Sound absorbing dropped ceiling (perforated gypsum boards).
Windows
Area:8 m2in total (1.4 ˆ 1.9 m2per window).
Type:Manually operated windows divided into upper and lower pivoting parts (see classroom photograph). Glazing:Double glazing (6+12+4).
Framing:Wood.
Air permeability:Class 3 or higher (EN ISO 12207, 1999). Sun shielding
Fixed:Vertical and horizontal shading elements along the perimeter of window. Horizontal shading element between upper and lower window parts (see south fac¸ade photograph). Movable:Exterior roller blind (fabric).
Lighting and equipments
Lighting:Recessed luminaires using tubular fluorescent lamps T5/16mm (10 W/m2).
Equipments:Video projector; desktop computer. Generic usage
Class size:25 students (design).
Class Type:Mixed classes (boys with girls) in approximately a 1:1 ratio.
Class grade:From 5thto 12thgrade.
Schedule:Between mid-September and mid-June Monday to Friday from 8.10 AM to 6.30 PM. Bank, Christmas, February half-term (carnival) and Easter holidays excluded.
School dress code policy:Casual (teachers and students). 115
2.1 Ventilation strategy
Original school design relied entirely on natural ventilation (manual opening of windows) and class-rooms were not heated (or cooled).
With the refurbishment, manual opening of windows was kept and even extended because
orig-120
inal casement windows (side hung) were replaced by pivoting windows divided into upper and lower parts. A mechanical Demand Controlled Ventilation (DCV) system, controlling indoor CO2
concen-tration and air temperature, was also installed providing temperature neutral fresh air to the class-rooms. When this system is working, fresh air is supplied below classroom windows and exhausted from the corridor. Ventilation openings in the indoor wall allow air to flow from the classroom to the
125
corridor. Each classroom has three of these openings providing a total free flow area of 0.25 m2.
During warm periods windows can be opened (in different combinations of upper and lower pivoting parts) and cross ventilation between classroom and corridor windows can be used to effec-tively ventilate classrooms. Moreover, with the north facing stairwell window open, stack ventilation is noticeable from corridors (especially, from the 1st floor corridor) to the stairwell. Obviously, if
130
cross ventilation and stack ventilation are suspended (because corridor and stairwell windows are closed), classroom single-sided ventilation is always possible.
With cold weather, windows are typically kept closed. Before school refurbishment, due to large window air-leakage, adventitious ventilation was significant; however, with the newly installed windows, classrooms’ air tightness was greatly improved and adventitious ventilation became very
135
low. Obviously, the designers’ team assumed the DCV system would be used with cold weather, however, since the school was refurbished and during the monitoring period, between 2012 and 2014, this system was not used. Classroom ventilation was entirely dependent on manual opening of windows (upper and lower parts; in classrooms, corridors and stairwell), according to students and teachers’ preferences and instructions provided to school janitors (see Section 3.3).
3 Classrooms’ usage
3.1 Experimental procedure
To monitor changes in classroom usage, lesson logs between mid-September 2012 and mid-June 2014 were consulted. For each monitored classroom and for each lesson the following parameters were selected: number of students attending the lesson (approximately the same as class size,
be-145
cause of low absenteeism) and class grade. During the two-year monitoring period more than 16 distinct classes from 5thto 12thgrade and a total of more than 300 students attended lessons at the monitored classrooms.
Using records for each lesson, daily mean values of class size and of class grade were deter-mined.
150
3.2 Monitoring results and discussion
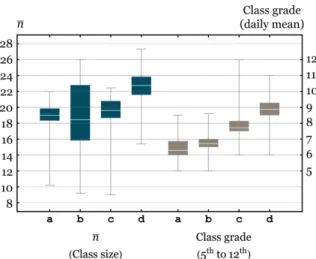
Figure 2 presents, for classrooms a, b, c and d, four box-whisker plots of daily mean class size n, and four box-whisker plots for daily mean class grade.
Each box-whisker plot represents the median (white horizontal line), the lower and upper quar-tiles (1stand 3rdquartiles at the bottom and top of the colour rectangle, respectively) and the lower
155
and upper fences (the smaller of the extrema or 1.5 times the interquartile range of the data) at the bottom and top of the vertical lines. The y-axis on the left of Figure 2 presents values for daily mean class size. The y-axis on the right is used to measure the daily mean class grade.
Fig. 2: Box-whisker plots for daily mean size and daily mean grade of classes attending lessons in classrooms a, b, c and d.
Figure 2 shows that the median number of students per lesson varies between 18.5 and 22.8.
160
Classroom d is used by classes of larger size and the largest variability in class size is found in classroom b. As regards class grade, classrooms a and b are essentially used by classes from 5thto
9thgrade, whereas classrooms c and d are used to teach lessons to older students, including 12thand
11thgraders.
Figure 2 shows inter- and intra-classroom variability. Inter-classroom variability was expected
165
(and promoted when choosing the monitored classrooms) to allow a more diverse and representative sample. Intra-classroom variability is a consequence of classroom use by distinct classes in the morning and afternoon, and, because lessons scheduled to take place in a classroom differ depending on the day of the week and on the academic year.
3.3 Interaction with the built environment
170
No objective instructions (or training) as to window opening or use of blinds was provided to either teachers or students. During lessons, students were allowed to open/ close classroom windows and operate blinds under the supervision of the teacher and subject to existing group dynamics. Because corridor and stairwell windows were typically closed, single-sided ventilation was the ventilation mode most common in classrooms. According to school janitors, corridor and stairwell windows
were kept closed to prevent the ingress of rain, birds and insects.
Night-time ventilation was not implemented. As a rule, at the end of the school day janitors checked if classroom windows were closed; however, this check was more attentive during winter-time. Indeed, with warm weather, classrooms’ upper window parts were frequently left open, among other reasons, because the risk of rain ingress was smaller and because roller blinds prevented/
min-180
imised the risk of ingress of birds and insects.
4 Outdoor conditions
4.1 Experimental procedure
Outdoor conditions were monitored from mid-June 2012 to mid-June 2014, two complete cycles of 365 days, including night-time, weekends and holidays. During this period, a weather station
185
was used to record (10-minute frequency): air dry-bulb temperature, air relative humidity, global radiation on a horizontal plane (referred in this paper as solar energy), precipitation and wind speed (at approximately 10 m height). Details on range and accuracy of the sensors used are presented in Davis (2010).
Additionally, to determine relative indoor CO2concentrations (relative to the outdoor
concen-190
tration), a reference outdoor value of 395 ppm was used. This value was chosen based on records from sensors with accuracy of ˘30 ppm (CO2Meter, 2011), that monitored the atmospheric CO2
concentration at the school site during 15 days periods in autumn, winter and spring of the 2012-2013 academic year.
From the database of 10-minute records of outdoor environmental variables, daily mean and
195
daily total values were determined.
4.2 Monitoring results and discussion
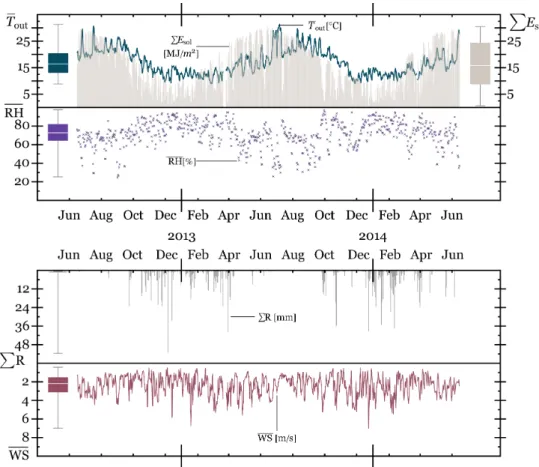
Figure 3 presents scatter plots obtained from the daily values of outdoor environmental variables. Figure 3 is divided into top and bottom parts. The top part has y-axes directed upwards and includes
Fig. 3: Scatter and box-whisker plots for the monitored outdoor environmental variables (Tout, daily
mean air temperature;ř Esol, daily total solar energy; RH, daily mean air relative humidity;ř R,
daily total precipitation; WS, daily mean wind speed ).
daily values of outdoor air temperature Tout (left y-axis), outdoor air relative humidity RH (left
200
y-axis) and solar radiationř Esol(right y-axis). The bottom part of Figure 3 has y-axes directed
downwards and includes daily values of precipitationř R (left y-axis) and wind speed WS (left y-axis).
Box-whisker plots are also presented for every outdoor variable.
205 Seasonal trends are clearly visible in Figure 3. Larger values of outdoor air temperature and solar energy are common at the beginning and end of the academic year (beginning of autumn and end of spring), whereas low values occur in wintertime. For relative humidity and precipitation Figure 3 presents less sharply defined seasonal trends, however, a seasonal pattern opposite to that of outdoor air temperature is suggested for outdoor air relative humidity; more frequent precipitation
is visible during the winter months, especially in the 2013-2014 academic year.
As regards wind speed, no clear seasonal trend is noticeable. Wind speeds appear to fluctuate randomly about a mean value. This results is justified by Lisbon’s location, close to the Atlantic Ocean (and the Tagus river estuary), leading to “windy” weather conditions regardless of the season1.
Figure 3 confirms Lisbon’s mild climate. The median of daily outdoor temperatures is 16.40C
215
and the interquartile range varies between 13.0 and 20.50C. As regards air relative humidity, the
median of daily values is 72.8% and typical values are neither excessively low nor high. Figure 3 also suggests that insolation values in Lisbon are large; indeed, large values of daily solar energy (median of daily total equals 15.8 MJ/m2) are accompanied with low daily precipitation (median of daily total equals 0.0 mm). Daily wind speed fluctuates around a median value of 2.2 m/s.
220
Figure 3 offers important insight into the way outdoor conditions influence natural ventilation in classrooms. In wintertime, and for a part of the intermediate seasons, Figure 3 shows that daily outdoor air temperatures lay below 160C, thus, the likelihood of draughts when classroom windows
are open is high. To avoid draughts it is likely that classroom windows are kept closed, reducing natural ventilation in the classrooms. During the beginning and at the end of the academic year,
225
outdoor air temperature and insolation are higher and, for these conditions, classroom overheating becomes more likely. However, because wind speeds remain (on average) constant regardless of the season, natural ventilation should keep its ability to cool the indoor environment, therefore, classroom windows are most likely left open, increasing natural ventilation in classrooms.
5 Classrooms’ indoor environment
230
5.1 Experimental procedure
To investigate the environmental conditions inside the classrooms indoor air temperature and indoor CO2concentration were monitored from mid-September 2012 to mid-June 2014, the beginning of
1As for wind directions, Lisbon is dominated by northwest winds; however, at the regional and urban scale this pattern changes. Alcoforado and Lopes (2003) presents a detailed description of changes in wind direction in Lisbon.
the 2012-2013 academic year and the end of the 2013-2014 academic year, respectively.
Sensors were placed at the classrooms’ interior walls, approximately 2.5 m above the floor,
235
away from stagnant areas and out of reach of students. Sensors signals were recorded by the school’s building management system (implementing sequence event recording) and sensors’ characteristics are presented in Sauter (s/d). A summary of these characteristics is: air temperature range from -20 to 600C with ˘0.40C accuracy; CO
2concentration range from 0 to 2000 ppm with ˘50 ppm
accuracy.
240
Daily mean indoor air temperature and daily median indoor CO2concentration were obtained
from the instantaneous records collected during the two-year monitoring period. In determining these values, only the period between the start and the finish of teaching on any school day was considered (recall classrooms’ usage in Table 1).
5.2 Monitoring results and discussion
245
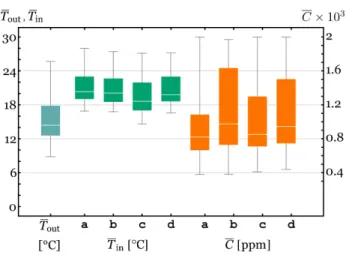
Figure 4 presents, for each classroom, box whisker plots of daily mean indoor air temperature, Tin,
and daily median indoor CO2 concentration, C. Additionally, Figure 4 includes a box-whisker
plot for daily mean outdoor temperature. This box-whisker plot is different from the one in Figure 3 because it uses data from school days only, that is to say, weekends and holidays were not considered (however, a 24 hour daily period from 12 AM to 11 PM was used).
250
The left y-axis in Figure 4 is used to measure daily mean indoor and outdoor air temperatures. The right y-axis measures daily median indoor CO2concentration.
Fig. 4: Box-whisker plots for daily mean outdoor air temperature (Tout), daily mean indoor air
temperature (Tin) in classrooms a, b, c and d and, daily median indoor CO2concentration (C) in
classrooms a, b, c and d.
Observing first the box-whisker for daily outdoor temperature, and comparing it to the corre-sponding box-whisker in Figure 3, it is concluded that the median of daily outdoor temperatures
255
drops by 2 K (from 16.4 to 14.40C) when non-school days are removed from the database. This
reduction is a consequence of shifting the academic year towards wintertime, a choice that has advantages and disadvantages. With this academic schedule the risk of classroom overheating is reduced, however, as discussed in Section 4.2, to prevent draughts classroom windows are typically kept closed most of the wintertime, compromising classroom natural ventilation for a large period
260
of the academic year.
In marked contrast to the low daily outdoor air temperatures, Figure 4 shows that 1st, 2nd
(me-dian) and 3rdquartiles of daily indoor air temperatures typically lay between 19 and 240C, a
temper-ature range associated with thermal comfort (EN ISO 15251, 2007; de Dear and Brager, 2002). It is concluded, therefore, that classrooms’ envelope is capable of filtering the unwanted outdoor
en-265
vironmental conditions, namely, the excessively low outdoor air temperatures (and excessively high too).
Before commenting the indoor CO2 concentrations, the interrelationship between indoor and
joint probabilities P˚ associated with different combinations of classroom daily indoor air
tem-270
perature and outdoor running mean temperature, i.e., P˚“ P`Trm
out“ Tj, Tin“ Tk
˘
, with Trm outthe
outdoor running mean temperature (defined below) and pTj, Tkq defining a specific outdoor-indoor
temperature pair.
Joint probabilities were determined for 25 different combinations pTj, Tkq, with TjP t9, 12, 15, 18, 21u
and TkP t14, 17, 20, 23, 26u.
275
With respect to the outdoor running mean temperature, this is a filtered version of the daily outdoor air temperature described in Section 4. A recursive expression used for its computation is (EN ISO 15251, 2007),
Tout,drm “ p1 ´ αqTout,d´1` αTout,d´1rm , (1)
with d an index identifying the current day (d ´ 1 is the previous day) and α a constant with
recom-280
mended value 0.8.
An expression for the starting term of the recursive process is (EN ISO 15251, 2007),
Tout,1rm “pTout,d´1` 0.8Tout,d´2` 0.6Tout,d´3`
0.5Tout,d´4` 0.4Tout,d´5` 0.3Tout,d´6`
0.2Tout,d´7q{3.8 .
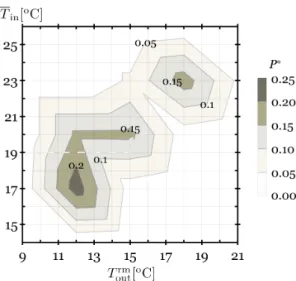
Fig. 5: Contour plot for joint probabilities of outdoor-indoor temperature pairs, P˚“
P`Trm
out“ Tj, Tin“ Tk
˘
, with Trm
out the outdoor running mean temperature, Tin the daily indoor
air temperature, TjP t9, 12, 15, 18, 21u and TkP t14, 17, 20, 23, 26u.
To help interpret Figure 5, the contour line 0.20 is inspected. Because 0.20 is the largest value—
285
the largest probability—associated with the contour lines, Figure 5 tells that the most probable com-binations of outdoor and indoor air temperatures have a probability of occurring of approximately 20%p“ 0.20q, and lay in the neighbourhood of the pair (12.00C, 17.50C). Moreover, because
Fig-ure 5 uses data for full academic years, it can be said that temperatFig-ure pairs in the neighbourhood of (12.00C, 17.50C) occur for 20% of the academic year, approximately.
290
Contour lines for 5, 10 and 15% probability are also included in Figure 5, and ranges of oc-currence are significantly larger for these probabilities. Considering, for example, the 0.15 contour line, it is concluded that outdoor-indoor temperature pairs with such probability occur both for cold weather (11.00C, 17.00C) and for warm weather (18.00C, 23.50C).
To communicate the thermal acceptability of the indoor environment, Figure 5 includes the
295
lower limit line of indoor thermal comfort, category III, as described in EN ISO 15251 (2007)—the dashed white line2. Below this line, the indoor environment is regarded as being too cold; above this line the indoor thermal environment is acceptable. Figure 5 makes it clear that as outdoor temperatures fall, classrooms become too cold and the probability of thermal discomfort increases.
2The analysis that follows assumes that for the studied classrooms differences between daily indoor air temperature and operative temperature are small.
Considering the data used to draw Figure 5 it is found that along the academic year the probability
300
that a classroom is thermally uncomfortable (outdoor-indoor temperature pairs falling below the dashed line) is 39.5%.
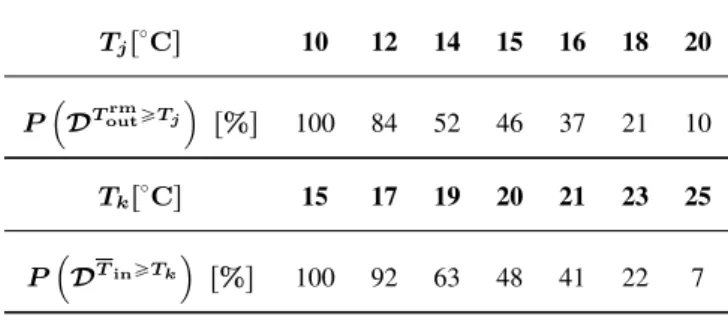
Other probabilities that help understand the interrelationship between outdoor and indoor air temperatures are presented in Table 2. This table shows probabilities of outdoor-indoor temperature pairs falling to the right of lines of constant outdoor running mean temperature and probabilities
305
of outdoor-indoor temperature pairs falling above lines of constant daily indoor air temperature. These regions are expressed, respectively, as set DToutrměTj“ t`Trm
out, Tin ˘ P R2 : Trm outě Tju and set DTiněTk“ t`Trm out, Tin ˘ P R2 : Tině Tku.
Table 2: Probabilities of outdoor-indoor temperature pairs falling into set DToutrměTj “
t`Trm out, Tin
˘
P R2 : Trm
outě Tju or set DTiněTk“ t`Toutrm , Tin
˘
P R2 : Tině Tku. Toutrm is the
outdoor running mean temperature and Tinis the daily indoor air temperature.
Tjr0Cs 10 12 14 15 16 18 20 P ´ DTrm outěTj ¯ r%s 100 84 52 46 37 21 10 Tkr0Cs 15 17 19 20 21 23 25 P ´ DTiněTk ¯ r%s 100 92 63 48 41 22 7 310
From Table 2 it is concluded that daily indoor air temperatures lower than 190C occurred for
37% of the academic year, a result derived from the probability P ´
DTině190C
¯
. As expected, this result is similar to the 39.5% associated with the probability that a classroom is thermally uncom-fortable, and reminds that thermal discomfort in the classrooms is significant. However, if this result is compared with the percentage of the academic year with cold weather conditions—outdoor
run-315
ning mean temperature lower than 160C—, than it is concluded that the classroom envelope actually
managed to filter the low outdoor temperatures. Indeed, from Table 2 it is concluded that outdoor running mean temperatures lower than 160C occurred for 63% of the academic year, a probability
much larger than that for thermal discomfort in the classrooms.
Figure 5 also shows that in the region DToutrmă160Cindoor-outdoor temperature differences can
320
be significant, i.e., as high as 8 K. Such differences between indoor and outdoor temperatures oc-cur when classrooms are used by classes with large size and/or for sunny winter days; but only if ventilation rates are kept at a minimum.
Results from Figure 5 suggest, therefore, that for cold weather conditions classroom windows remain closed, in an attempt to preserve comfortable indoor environments and avoid draughts. This
325
behaviour was expected and agrees with previous results by Wargocki and Wyon (2007b).
But, if windows are kept closed and ventilation rates are at a minimum, indoor CO2
concentra-tions should increase. Indeed, returning to the analysis of the CO2box-whisker plots in Figure 4,
it is concluded that CO2 concentrations exceed the 1500 ppm daily limit of Building Bulletin 101
(Education Funding Agency, 2014) and, since 3rdquartiles are as high as 1600 ppm, this occurs for a
330
considerable number of school days. Such high CO2concentrations occur when ventilation rates are
lower than 4 l/s per person (EN ISO 15251, 2007) and are a sign that indoor air quality in classrooms is poor.
6 Classroom ventilation
To determine daily mean ventilation rates in classrooms, records of class size and grade and of
335
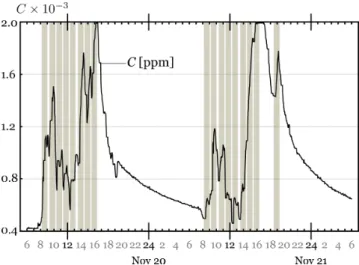
instantaneous indoor CO2 concentration were used. Figure 6 presents a sample of instantaneous
CO2concentrations, C, for classroom b between 6 AM November 19 and 6 AM November 21 of
Fig. 6: Instantaneous indoor CO2 concentration (C) in classroom b between 6 AM November 19
and 6 AM November 21 of 2012 (Monday through Wednesday). Highlighting represents lessons that took place in the studied classroom.
Inspecting the CO2concentrations two distinct patterns emerge, one for daytime, showing sharp
340
changes in CO2concentrations, and another for night-time, showing an exponential decrease in CO2
concentration. In regard to the sharp changes in CO2concentration, these are caused by the
inter-mittent use of the classroom, with changes in class and teachers present, therefore, with changes in the amount of CO2released and in the pattern of use of classroom windows and door. As regards the
slow night-time exponential decay in CO2concentration—revealing the classroom’s air tightness—,
345
this is justified because the classroom was unoccupied between 6.30 PM and 8 AM the following day3, and during this period windows and door were closed.
For CO2concentration curves that decay exponentially EN ISO 12569 (2000) and ASTM
E741-00 (2E741-006) provide methods to determine ventilation rates based exclusively on the shape of the exponential curve. However, with sharp changes in CO2 concentration a method that considers
350
these changes is required to determine the ventilation rate.
6.1 Method to determine daily mean ventilation rate
To determine classroom daily mean ventilation rate (with data from 8.10 AM to 6.30 PM, start and finish of the teaching activities, respectively), the following solution of the decay equation was used
(Jones, 1994, p.462), 355 c “ n 9M acr ¨ V ` ˜ c0´ n 9M acr ¨ V ¸ expp´acr ¨ tq . (3)
This equation is derived for a single zone of volume V and assumes constant air density, equal supply and extract flow rates and well-mixed conditions. It provides the relative concentration of CO2, c “ C ´ Cout, at instant t, for a class of size n, a rate of CO2production per person of 9M and
an air change rate acr. It also considers the initial classroom relative CO2concentration defined as
360
c0“ C0´ Cout(Coutis the outdoor CO2concentration).
When Equation (3) is used to describe the concentration of CO2 during a specific lesson, c0,
n, 9M and V are known constants, however, air change rate acr varies. To use Equation (3) it is assumed that this variability in acr is the result of random deviations from a lesson mean value acr. Thus, a lesson mean relative CO2concentration, c, can be determined from
365 c “ ştf t0c dt tf´ t0 , (4)
with t0and tfthe initial and final instants of the lesson.
Because tfis far greater than t0, Equation (4) becomes
c “ n 9M { pacr ¨ V q . (5)
Defining Q “ acr¨V {n as the lesson ventilation rate, with units of m3/s per person, Equation (5)
370
can be written as,
Q “ 9M {c , (6)
indoor mean relative CO2concentration.
A result identical to Equation (6) is presented in EN ISO 16814 (2008) and BS PD CR 1752
375
(1998) when the ventilation efficiency is set to 1.
To use Equation (6), mean relative CO2concentrations per lesson, c, can be obtained from the
monitoring data. Values of 9M for each lesson can be determined from expressions provided in Coley and Beisteiner (2002), using information about the grade and size of the class attending the lesson.
To determine daily mean ventilation rates (per lesson and per person), Q, values of Q for lessons
380
taking place between 8.10 AM and 6.30 PM were averaged.
6.2 Results and preliminary discussion
Using the method described in the previous section and data gathered between mid-September 2012 and mid-June 2014, Figure 7 presents box-whisker plots for daily mean ventilation rate in classrooms a, b, c and d4.
385
Fig. 7: Box-whisker plots for daily mean ventilation rate (Q) in classrooms a, b, c and d.
Figure 7 shows that medians vary between 6 and 8 l/s per person. The interquartile range typically varies between 3 and 12 l/s per person, with a significant number of occurrences below 4 l/s per person, especially in classrooms b and d. These results agree with the large CO2concentrations
in Figure 4.
390
4Actually, Figure 7 provides a detail of the box-whisker plots, because upper whiskers are truncated at 16 l/s per person to allow a clearer analysis of the region of interest between 4 and 10 l/s per person.
Using results of daily mean ventilation rate together with the corresponding daily mean outdoor and indoor air temperatures, it is possible to determine the conditional probability P:that ventilation
in classrooms is higher than a certain value Qi, given specific combinations pTj, Tkq of outdoor
running mean temperature and daily indoor air temperature, i.e.,
P:“ P`Q ě Q
i| Toutrm “ Tj, Tin“ Tk˘ . (7)
395
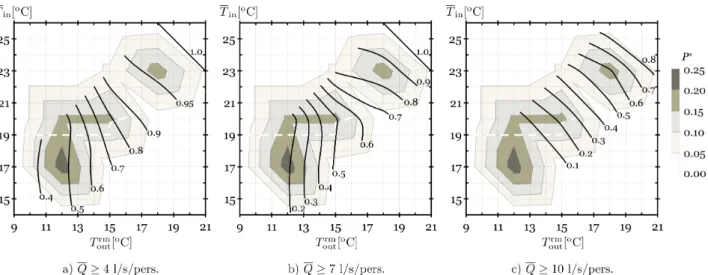
Figure 8 uses contour lines—black lines labelled from 0.1 to 1.0—to present results of con-ditional probabilities for different values of ventilation rate Qi, considering different combinations
pTj, Tkq. Three cases were considered for Qi: 4, 7 and 10 l/s per person, depicted in graphs a), b)
and c), respectively. As explained previously in Section 5.2, 25 combinations pTj, Tkq were used for
each one of these three cases.
400
To better understand the link between ventilation rates and the probability of finding specific outdoor-indoor temperature pairs in the studied classrooms, ventilation contour lines—black lines labelled from 0.1 to 1.0—overlay the contour areas shown in Figure 5, representing the joint like-lihood P˚for different temperature pairs. Moreover, EN ISO 15251 (2007) threshold for thermal
comfort (category III)—dashed white line—is also represented, allowing an easier inspection of the
405
link between ventilation rates and indoor thermal comfort.
To help interpret Figure 8, consider outdoor-indoor temperature pairs (180C, 220C) and (120C,
180C), typical of warm and cold weather conditions, respectively. For the pair (180C, 220C)—
180C outdoor running mean temperature and 220C daily indoor air temperature—, using graph a)
410
it is concluded there is approximately 95% probability that Q ě 4 l/s/person. From graph b) the probability that Q ě 7 l/s/person is 80% and from graph c) the probability that Q ě 10 l/s/person is approximately 55%. This means that for this temperature pair the conditional probabilities of daily mean ventilation rates Q falling into different intervals IQ are as shown below, in Table 3. Reproducing the analysis for the outdoor-indoor temperature pair (120C, 180C) leads to conditional
Fig. 8: Contour lines for conditional probabilities P:between 0.1 and 1.0, that the daily ventilation
rate Q is larger or equal to 4, 7 or 10 l/s per person—graphs a), b) or c), respectively—, given different combinations of outdoor running mean temperature (Toutrm) and daily indoor air temperature (Tin). Contour lines overlay contour areas of joint probability P˚ shown in Figure 5. The lower
limit thermal comfort line of EN ISO 15251 (2007), cathegory III, is also represented (dashed white line).
probabilities also presented in Table 3.
Table 3: Conditional probability that daily ventilation rates Q fall into interval IQ, given that `Trm
out, Tin
˘
is equal to p180C, 220Cq and to p120C, 180Cq. Trm
outis the outdoor running mean
temper-ature and Tinis the daily indoor air temperature.
P`Q P IQ| T rm out“ Tj, Tin“ Tk ˘ r%s pTj, Tkq z IQ r 0, 4 r r 4, 7 r r 7, 10 r r 10, 8 r (18,22) 5 15 25 55 (12,18) 53 31 12 4
Table 3 shows that for warm weather the probability of having ventilation rates lower than 4 l/s/person is only 5%, whereas the probability of having ventilation rates larger than 10 l/s/person
420
is 55%. In contrast, for cold weather the probability of ventilation rates lower than 4 l/s/person increases to 53% and ventilation rates larger than 10 l/s/person decrease to 4%. These results provide a way to quantify the effect of manual window-airing of classrooms, confirming its effectiveness with warm weather, but making clear there is a problem with manual opening of windows during cold
weather.
425
Contour lines in Figure 8 express yet another interesting feature. The fact that contour lines be-come vertical as outdoor temperatures drop means that ventilation rates are a function of outdoor and indoor temperatures for warm weather, but depend on outdoor temperature only for cold weather. Because students and teaching staff were free to open/ close classroom windows and since corri-dor/ stairwell windows were typically closed, this result supports that with cold weather students
430
and teaching staff progressively refrain from opening windows (a suggestion already made in Sec-tion 5.2), and this behaviour is independent of warm or cold indoor environments. In SecSec-tion 7.2.3 a justification is provided for this behaviour.
Moving to the simultaneous analysis of “ventilation” contour lines and contour areas for P˚in
Figure 8, differences in contour areas to the right of the ventilation contour lines convey important
435
information about the likelihood of ventilation rates. Let Dcl`,pgq be the set of outdoor-indoor
temperature pairs falling to the right of contour line cl in graph gq, with cl P t0.1, . . . , 1.0u and gq one of the three graphs a), b) or c) in Figure 8.
For example, the set to the right of the straight contour line 1.0 in graph a) is,
D1.0`,paq“ t`Trm out, Tin
˘
P R2 : Toutrm ě 18 ^ Tině max p44 ´ Toutrm , 23qu . (8)
440
Using a linear approximation it is also possible to define the set of outdoor-indoor temperature pairs to the right of contour line 0.95 in graph a):
D0.95`,paq« t`Trm out, Tin
˘
P R2 : Toutrm ě 16 ^ Tině max p37.083 ´ 0.833Toutrm, 21qu . (9)
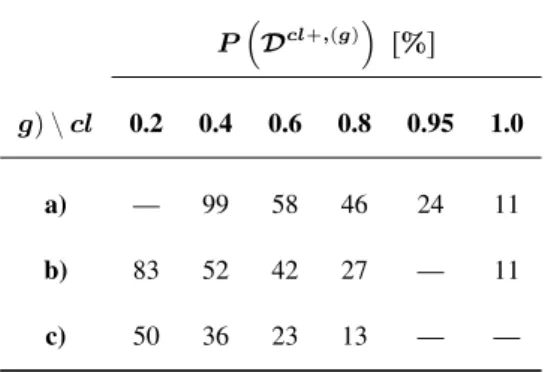
Joint probabilities P`Dcl`,pgq˘can be evaluated with the data used to build Figure 5. These probabilities are presented in Table 4 for the contour lines cl in the graphs gq of Figure 8.
Table 4: Probabilities P`Dcl`,pgq˘that temperature pairs`Toutrm , Tin
˘
fall in the region Dcl`,pgq defined to the right of contour line cl in graph gq—graph a), b) or c) in Figure 8. Toutrmis the outdoor
running mean temperature and Tinis the daily indoor air temperature.
P ´ Dcl`,pgq¯ r%s gq z cl 0.2 0.4 0.6 0.8 0.95 1.0 a) — 99 58 46 24 11 b) 83 52 42 27 — 11 c) 50 36 23 13 — —
Table 4 shows outdoor-indoor temperature pairs fall to the right of contour line 1.0, in graph a), with probability P`D1.0`,paq˘“11%. Because contour lines in graph a) of Figure 8 are drawn for daily ventilation rates Q ě 4 l/s/person, using data for two full academic years, it is concluded
450
that, from the total number of school days in the academic year, ventilation rates exceed 4 l/s/person (with 100% probability) 11% of the time.
The probability that daily ventilation rates exceed 4 l/s/person 95% of the time is associated with the region to the right of contour line 0.95 in graph a), and is expressed as P`D0.95`,paq˘. For the studied classrooms, Table 4 shows this probability is 24%; this means that, from the total number
455
of school days in the academic year, ventilation rates exceed 4 l/s/person (with 95% probability) 24% of the time.
Because contour line 0.95 in graph a) is somewhat similar to contour line 0.8 in graph b) and to contour line 0.6 in graph c), results in Table 4 also show that for the set of outdoor-indoor temperature pairs falling in D0.95`,paq, ventilation rates exceed 10 l/s/person approximately 60% of the time,
460
lay between 7 and 10 l/s/person approximately 20% of the time, lay between 4 and 7 l/s/person approximately 15% of the time and are lower than 4 l/s/person less than 5% of the time.
In the next section, these results are used to discuss when is manual window-airing of class-rooms appropriate.
7 Discussion
465
7.1 When is ventilation with manual opening of windows appropriate?
To achieve the goal of knowing when ventilation with manual opening of windows is appropriate, first it is necessary to define appropriate. From the perspective of students’ performance and health, the larger the fresh air flow rate the better, however, Section 6.2 shows there are outdoor conditions for which natural ventilation with window opening is unable to ensure large ventilation rates. From
470
Figure 8 it is concluded that during the academic year ventilation rates exceeding 10 l/s/person are those less likely to occur and, consequently, the higher the threshold for classrooms ventilation, the harder it is to design with natural ventilation. If this threshold is lowered and ventilation rates of 7 l/s/person or 4 l/s/person are considered appropriate, it becomes much easier to endorse classroom ventilation with opening of windows.
475
According to Santamouris et al. (2008), naturally ventilated schools are associated with lower symptom prevalence, even if ventilation rates are lower than those observed in mechanically ven-tilated schools; moreover, Mumovic et al. (2009) states that classroom ventilation rates as low as 3 l/s/person allow daily mean CO2concentrations lower than 1500 ppm—the limit set in Building
Bulletin 101 (Education Funding Agency, 2014). Mumovic et al. uses this result to justify the use of
480
natural ventilation in classrooms, since window-airing is typically capable of providing ventilation rates of 3 l/s/person.
In this paper, EN ISO 15251 (2007) is used to define appropriate ventilation. Category III of this standard is chosen and, for classrooms, this means a threshold ventilation rate of Q ě 4 l/s/person. According to Annex G of EN ISO 15251, deviations from this threshold are accepted if they occur
485
less than 5% of the time; in other words, if the threshold is met 95% of the time. Using Figure 8, contour line 0.95 in graph a) provides precisely the lower limit to appropriate ventilation, as specified in EN ISO 15251 (2007), and, outdoor-indoor temperature pairs to the right of this contour line fall into region D0.95`,paq, with ventilation rates lower than 4 l/s/person less than 5% of the academic
year.
490
Set D0.95`,paqhas been defined previously in Equation (9), and using this equation it is possible
to specify the conditions for which appropriate manual window-airing of classrooms occur, namely:
– With warm weather, when Trm
outě 190C.
For this case, thermal comfort is also adequate, given that classrooms’ indoor temperatures are hardly ever below the dashed white line in Figure 8.
495
– With intermediate weather, when 16 ď Trm
oută 190C, depending on daily indoor air
tempera-tures.
From Equation (9) it is concluded that the slope of the 0.95 contour line is -0.833 (∆Tin{∆Toutrm“
´0.833), therefore, if a 1 K decrease in running mean temperature is accompanied by (at least) a 0.833 K increase in daily indoor temperature, ventilation with window opening remains
ap-500
propriate. This is true for outdoor running mean temperatures as low as 160C, and for this
case the daily indoor air temperature should be 23.50C or higher. For intermediate weather
conditions, thermal comfort is also most of the time appropriate.
Inappropriate classroom ventilation with manual opening of windows occurs with cold weather, when Trm
oută 160C. For this case, there is also a significant decrease in thermal comfort.
505
As regards the probability of appropriate ventilation in the studied classrooms, Table 4 shows that outdoor-indoor temperature pairs belonging to set D0.95`,paqrepresent approximately a quarter
(24%) of the total possible pairs found along the academic year. This result is evidence of the energy saving potential of natural ventilation.
Figure 8 can be used to investigate alternative definitions of appropriate ventilation, and,
be-510
cause classroom windows were opened and closed in harmony with students’ and teachers’ pref-erences, contour lines in Figure 8 are typical for free-running classroom ventilated with manual opening of windows.
The external validity of the results presented in Table 4 (and in Figure 5) is not as general as the contour lines presented in Figure 8; however, Table 4 should remain useful when studying
free-running classrooms of Southern European schools.
7.2 Review of classrooms’ ventilation strategy
7.2.1 Warm weather conditions
As discussed in the previous section, for warm weather conditions—outdoor running mean temper-atures exceeding 190C—, manual opening of windows allows appropriate ventilation and thermal
520
comfort in classrooms (with no records of overheating).
Several factors contributed to these results: appropriate class size, large building thermal mass, moderately sized exterior windows, appropriate sun shielding and effective classroom ventilation. Table 1 and Figure 1 provide information that broadly explains how these factors were used in the studied classrooms. Turning specifically to the ventilation strategy, as mentioned in Section 2.1,
525
single-sided, cross and stack ventilation are all available at the studied classrooms; however, the fact that corridor and stairwell windows remained mostly closed made single-sided ventilation the main classroom ventilation mode. Considering the results in Section 6.2, it becomes obvious that for warm weather single-sided ventilation allows adequate classroom ventilation. Yet, the question of the benefit of the other two ventilation modes remains; in particular, the benefit of cross ventilation
530
with hot weather.
Indeed, although no overheating was found in this study, this does not mean overheating cannot occur for hot years or for classes with size larger than normal. Moreover, regular lessons finish in mid-June, but classrooms continue to be used in the hot month of July to hold national exams and meetings. To prevent overheating with hot weather, cross ventilation could prove useful, and
535
contribute to the effective night-time ventilation of classrooms.
To use cross ventilation, upper window parts should be left open in classrooms and corridors; however, one meaningful barrier to corridor windows opening is bird ingress. In fact, unlike class-rooms, corridors (facing north) have no roller blinds (fabric) which can be used to prevent bird ingress; therefore, barriers to bird ingress are needed in corridor upper window parts. If these
ers are installed, the following instructions are suggested for the effective night-time ventilation of classrooms:
– Instructions for school janitors (with hot weather):
– Open corridor upper window parts and leave then open during night-time. – At the end of the school day, open classrooms’ upper window parts.
545
The large number of upper window parts in corridors (seven) and classrooms (three per class-room) and the additional use of roller blinds in classrooms should provide the means necessary for the appropriate control of classrooms’ air change rate.
A final comment is made on the design of classroom ventilation systems for warm (and hot) weather conditions. Based on this study, sensible passive design of classrooms and reliance on
550
students and staff use of windows are enough to ensure appropriate ventilation and thermal comfort in classrooms. The studied school implements a redundant ventilation strategy that rests on manual window-airing and uses single-sided, cross and stack ventilation. However, given the stochastic nature of window-airing and the contrasting “deterministic” nature of many standards, designers may wish to specify an alternative to manual window-airing5. In this case, the alternative system
555
should be conceived as an (additional) redundant ventilation system to be kept in standby, needed only if manual window-airing fails.
7.2.2 Intermediate weather conditions
With intermediate weather conditions—outdoor running mean temperatures between 16 and 190C—
the risk of draughts increases and although appropriate ventilation is possible with manual
window-560
airing this depends on the specific combination of outdoor and indoor air temperatures.
A feature of the current study that is relevant to the analysis of intermediate weather conditions is that students and teaching staff received no training on the use of windows or blinds and had no
5In the last section it was concluded that manual window-airing did not ensure appropriate classroom ventilation for cold (and partly for intermediate) weather conditions. It is therefore likely that designers will actually be needing an alternative ventilation system.
specific awareness towards the consequences (to health and productivity) of poor indoor air qual-ity. Geelen et al. (2008) shows that with training and information larger classroom ventilation rates
565
become acceptable. A strategy suggested in Geelen et al., Hellwig et al. (2009) and Wargocki and da-Silva (2015) that should be successful for intermediate weather conditions is promoting ventilation during lesson break time (in this study, every 50 minutes for a 10 minutes period). To support “les-son break time ventilation”, cross ventilation between classroom and corridors windows is helpful, therefore, some corridor upper window parts should remain open. Additionally, with intermediate
570
weather conditions stack ventilation could also be of benefit and this would mean leaving the stair-well window open. Because during night-time outdoor air temperatures drop substantially, corridor and stairwell windows should be closed during the night.
To promote classroom ventilation during lesson break time, and extend the use of manual window-airing, the following instructions are proposed:
575
– Instructions for school janitors:
– During daytime, while lessons take place, open upper corridor windows to allow cross ventilation.
– During daytime, while lessons take place, open upper stairwell windows to promote stack ventilation.
580
– Instructions for teaching staff (who may wish to delegate to students):
– During lesson break time ensure classrooms windows remain open.
Because with intermediate weather conditions manual window-airing is inappropriate for cer-tain combinations of outdoor-indoor temperature pairs, it is important that an alternative ventilation strategy exists. In the studied school, this alternative is the mechanical DCV system and for
inter-585
mediate weather conditions this system should be kept in standby.
As briefly described in Section 2.1, the mechanical DCV system did not work between 2012 and 2014; allegedly, because of the energy cost associated with its use and a chronicle shortage of
school funding; but perhaps more importantly, because insufficient information about the adverse effects of indoor air quality in classrooms was provided.
590
An important lesson for future school refurbishments is, therefore, that refurbishment pro-grammes should be used not only to provide the material means required to ensure appropriate classroom indoor environment, but also as an opportunity to communicate the importance of appro-priate classrooms ventilation to school stakeholders, and, especially, to school administrators.
For the studied school, the control of the mechanical DCV system collects real time information
595
on CO2 concentration and air temperature in each classrooms; an important contribution to better
classroom indoor environment would be achieved if this information was made available to school stakeholders.
7.2.3 Cold weather conditions
In Section 5.2 it was concluded that classrooms could be thermally comfortable despite low outdoor
600
temperatures. Figure 5 presents evidence of this, since the contour area above the dashed line is sig-nificant when outdoor running mean temperatures are lower than 160C. However, when ventilation
contour lines in Figure 8 are examined, it becomes obvious that for cold weather classrooms’ ther-mal comfort is not matched by appropriate classrooms’ ventilation. Below 160C the likelihood of
ventilation rates lower than 4 l/s/person typically exceeds 10%, and for outdoor temperatures below
605
110C this likelihood reaches 60%.
This result was expected because as outdoor temperature drops, students and teaching staff gradually refrain from opening windows. The problem is that with cold weather a closer control of the intake of fresh air is required (Etheridge, 2012, p.395), however, since window opening areas are large, the ability to exert control (the “authority”) over this intake is severely limited. Given that
610
manual window-airing relies on window opening and, with cold weather, windows were kept closed, it is concluded that for cold weather an alternative ventilation strategy is needed.
in-stalled and, during cold weather, this system should replace manual window-airing. The fact that this mechanical system is needed only for cold (and for part of the intermediate) weather conditions,
615
proves the energy savings potential of manual window-airing.
7.3 Limitations
Before presenting the conclusions, it is important to mention that the analysis made in this study is limited by the use of just two drivers of ventilation in classrooms, namely, outdoor and indoor air temperatures. Although literature on window opening patterns (Haldi and Robinson, 2008; Fabi
620
et al., 2012) shows these are among the most important determinants of window opening—therefore, of ventilation—, Figure 3 shows that the analysis of classroom ventilation could have benefited from considering the effect of solar energy, precipitation and relative humidity.
Furthermore, the present study assumes that ventilation is driven by indoor air temperature, not the opposite. This is another limitation because, for naturally ventilated classrooms (and warm
625
or intermediate weather conditions), indoor air temperature and ventilation are closely intertwined and influence one another, not only “passively” but especially as a consequence of students’ and teachers’ interaction with the built environment.
Finally, it is worth emphasising that the results presented are for students and teaching staff with no training on how to use windows or blinds and with no specific awareness of the consequences to
630
productivity and health of poor indoor air quality.
8 Conclusions
Data from a two-year-long experimental study of four free-running classrooms of a Portuguese pub-lic secondary school were gathered. Using this data and a definition of appropriate ventilation based on EN ISO 15251 (2007), outdoor-indoor temperature pairs were found for which classroom
venti-635
lation is appropriate. It is concluded that:
Deviations from this value are allowed if, for each 1 K decrease in outdoor running mean tem-perature there is a 0.833 K increase in daily indoor air temtem-perature. As outdoor running mean temperatures decrease below 190C, the likelihood of ventilation rates lower than 4 l/s/person
640
increases, impairing classroom’s indoor air quality.
– For outdoor running mean temperatures below 160C, ventilation with manual window opening
is inappropriate, regardless of the indoor temperature. For this case, designers should consider alternatives to ventilation with manual opening of windows.
Conclusions specific to the studied classrooms and weather conditions more common in
South-645
ern European countries are:
– Passive design alone can ensure appropriate ventilation and thermal comfort if outdoor running mean temperatures exceed 160C.
– If more information is provided to school stakeholders, classroom ventilation rates with man-ual opening of windows should increase, and for intermediate weather conditions classrooms’
650
indoor air quality should also increase.
– Appropriate ventilation and thermal comfort is achieved for approximately a quarter (24%) of the academic year using manual window-airing. This result confirms the energy saving potential of natural ventilation with opening of windows.
References
655
Alcoforado, M.J., Lopes, A., 2003. Wind field and temperature patterns in Lisbon (Portugal) and their modifi-cation due to city growth, in: Proceedings of the Fifth International Conference on Urban Climate (ICUC-5), 1-5 September, Lodz, Poland.
Almeida, R., Freitas, V., 2014. Indoor environmental quality of classrooms in Southern European climate. Energy and Buildings 81, 127–140.
660
ASTM E741-00, 2006. Standard test method for determining air change in a single zone by means of a tracer gas dilution, ASTM International, United States of America .
Bak´o-Bir´o, Z., Clements-Croome, D., Kochhar, N., Awbi, H., Williams, M., 2012. Ventilation rates in schools and pupils’ performance. Building and Environment 48, 215–223.
Bartlett, K., Martinez, M., Bert, J., 2004. Modelling of occupant-generated CO2dynamics in naturally
venti-665
lated classrooms. Journal of Occupational and Environmental Hygiene 1, 139–148.
Bluyssen, P.e.a., 1996. European indoor air quality audit project in 56 office buildings. Indoor Air 6, 221–238. BS PD CR 1752, 1998. Ventilation for buildings - Design criteria for the indoor environment, British Standard
Institution, United Kingdom .
Clements-Croome, D., Awbi, H., Bak´o-Bir´o, Z., Kochhar, N., Williams, M., 2008. Ventilation rates in schools. 670
Building and Environment 43, 362–367.
CO2Meter, 2011. CO2 1% or 30%, Temperature & %RH, Diffusion Data Loggers. Www.co2meter.com
(accessed May 2015).
Coley, D., Beisteiner, A., 2002. Carbon dioxide levels and ventilation rates in schools. International Journal of Ventilation 1, 45–52.
675
Davis, 2010. Precision Weather Instruments, Davies Instruments 2010 Catalog.
de Dear, R., Brager, G., 2002. Thermal comfort in naturally ventilated buildings: revisions to ASHRAE Stan-dard 55. Energy and Buildings 34, 549–561.
Education Funding Agency, 2014. Building Bulletin 101: ventilation for school buildings. https://www.gov.uk/ government/publications/building-bulletin-101-ventilation-for-school-buildings (accessed May 2017). 680
EN ISO 12207, 1999. Windows and doors-Air permeability-Classification, CEN-European Committee for Standardization: Brussels, Belgium .
EN ISO 12569, 2000. Thermal performance of building—determination of air change rate in buildings—tracer gas dilution method, CEN-European Committee for Standardization: Brussels, Belgium .
EN ISO 15251, 2007. Indoor environmental input parameters for design and assessment of energy performance 685
of buildings addressing indoor air quality, thermal environment, lighting and acoustics, CEN-European Com-mittee for Standardization: Brussels, Belgium .
EN ISO 16814, 2008. Building environment design-Indoor air quality-Methods of expressing the quality of indoor air for human occupancy, CEN-European Committee for Standardization: Brussels, Belgium. Etheridge, D., 2012. Natural ventilation of buildings: Theory, measurement and design. Wiley & Sons, Ltd. 690
Fabi, V., Andersen, R., Corgnati, S., Olesen, B., 2012. Occupants’ window opening behaviour: A literature review of factors influencing occupant behaviour and models. Building and Environment 58, 188–198. Fraga, S., Ramos, E., Martins, A., Sam´udio, M., Silva, G., Guedes, J., Oliveira-Fernandes, E., Barros, H., 2008.
Indoor air quality and respiratory symptoms in Porto schools. Revista Portuguesa de Pneumologia XIV, 487. Geelen, L., Huijbregts, M., Ragas, A., Bretveld, R., Jans, H., Doorn, W., Evertz, S., Zjiden, A., 2008. Com-695
parating the effectiveness of interventions to improve ventilation behaviour in primary schools. Indoor Air 18, 416–424.
Gertis, K., Sedlbauer, K., 2010. Schulsanierung. Bauphysik 32, 100–109.
Haldi, F., Robinson, D., 2008. On the behaviour and adaptation of office occupants. Building and Environment 43, 2163–2177.
700
Haverinen-Shaughnessy, U., Moschandreas, D., Shaughnessy, R., 2011. Association between substandard classroom ventilation rates and students’ academic achievement. Indoor Air 21, 121–131.
Hellwig, R., Antretter, F., Holm, A., Sedlbauer, K., 2009. Untersuchungen zum raumklima und zur fen-sterl¨uftung in schulen. Bauphysik 31, 89–98.
Jones, W., 1994. Air Conditioning Engineering. Edward Arnold. 4thedition. 705
Mendell, M., Heath, G., 2005. Do indoor pollutants and thermal conditions in schools influence student perfor-mance? a critical review of the literature. Indoor Air 15, 27–52.
Mendell, M., Smith, A., 1990. Consistent pattern of elevated symptoms in air-conditioned office buildings: A reanalysis of epidemiologic studies. American Journal of Public Health 80, 1193–1199.
Mumovic, D., Palmer, J., Davies, M., Orme, M., Ridley, I., Oreszczyn, T., Judd, C., Critchlow, R., Medina, H., 710
Pilmoor, G., Pearson, C., Way, P., 2009. Winter indoor air quality, thermal comfort and acoustic performance of newly build secondary schools in England. Building and Environment 44, 1466–1477.
Parque Escolar, 2009a. Manual de Projeto: Arquitetura, Vers˜ao 2.1. Http://www.parque-escolar.pt/pt/programa/manual-projeto-arquitetura.aspx (accessed on May 2015).
Parque Escolar, 2009b. Manual de Projeto: Instalac¸˜oes t´ecnicas. Http://www.parque-715
escolar.pt/pt/programa/manual-projeto-arquitetura.aspx (accessed on May 2015).
Parque Escolar, 2010. Liceus Escolas T´ecnicas e Secund´arias. Http://www.parque-escolar.pt/pt/programa/livros-parque-escolar.aspx (accessed on May 2015).
Parque Escolar, 2011a. Parque Escolar 2007-2011: Interventions in 106 schools. Http://www.parque-escolar.pt/pt/programa/livros-parque-escolar.aspx (accessed on May 2015).
720
Parque Escolar, 2011b. Parque Escolar: Seismic strengthening of school buildings. Http://www.parque-escolar.pt/pt/programa/livros-parque-escolar.aspx (accessed on May 2015).
Pegas, P., Alves, C., Evtyugina, M., Nunes, T., Cerqueira, M., Franchi, M., Pio, C., Almeida, S., Cabo Verde, S., Freitas, M., 2011. Seasonal evaluation of outdoor/indoor air quality in primary schools in Lisbon. Journal of Environmental Monitoring 13, 657–667.
725
Pereira, L., Raimondo, D., Corgnati, S., Gameiro-da Silva, M., 2014. Assessment of indoor air quality and thermal comfort in Portuguese secondary classrooms: Methodology and results. Building and Environment 81, 69–80.
Petersen, S., Jensen, K., Pedersen, A., Rasmussen, H., 2015. The effect of increased classroom ventilation rate indicated by reduced CO2 concentration on the performance of schoolwork by children. Indoor Air
730
(doi:10.1111/ina.12210).
Rudnick, S., Milton, D., 2003. Risk of indoor airborne infection transmission estimated from carbon dioxide concentration. Indoor Air 13, 237–245.
Santamouris, M., Synnefa, A., Asssimakopoulos, M., Livada, I., Pavlou, K., Papaglastra, M., Gaitani, N., Kolokotsa, D., Assimakopoulos, V., 2008. Experimental investigation of the air flow and indoor carbon 735
dioxide concentration in classrooms with intermittent natural ventilation. Energy and Buildings 40, 1833– 1843.
Sepp¨anen, O., Fisk, W., 2002. Association of ventilation system type with SBS suymptoms in office workers. Indoor Air 12, 98–112.
740
Shendell, D., Prill, R., Fisk, W., Apte, M., Blake, D., Faulkner, D., 2004. Associations between classroom CO2
concentrations and student attendance in Washington and Idaho. Indoor Air 14, 333–341.
Wargocki, P., da-Silva, N., 2015. Use of visual CO2feedback as a retrofit solution for improving classroom air
quality. Indoor Air 25, 105–114.
Wargocki, P., Wyon, D., 2007a. The effects of moderately raised classroom temperatures and classroom venti-745
lation rate on the performance of schoolwork by children (rp-1257). HVAC&R Research 13, 193–220. Wargocki, P., Wyon, D., 2007b. The effects of outdoor air supply rate and supply air filter condition in