Dissertation submitted in partial fulfillment of requirements for the degree of MSc in Business Administration.
Mergers and Acquisitions
The case of BMW Group and Tesla
Motors
Luís Verdasca Gomes Advisor: Peter Tsvetkov
Dissertation submitted in partial fulfillment of requirements for the degree of MSc in Business Administration.
2
© Luís Verdasca GomesAbstract
This case study provides analysis of a hypothetical M&A deal in the automotive industry. The main purpose is to consider if there is potential value creation when merging two different players, with different market approaches.
The existing level of globalization that illustrates the majority of the markets has shaped the automotive industry into determined, multinational groups of companies. The rationale motivating this work lies in the fact that the merger of two different players in the automobile industry would create new opportunities to both companies: BMW Group would acquire an option to expand in an emerging market and Tesla Motors, a small company, operating in the “niche” and, at the same time, “emerging” market of electric vehicles, would be granted an access to a mass production structure.
This paper concentrates on estimating the value created in this deal by combining an insightful business and company examination with Equity evaluation methodologies. Furthermore, it is employed and reviewed, the Literature on both, valuation and M&A, providing the standalone and merged companies’ valuation. Finally, an optimal price is suggested as well as the financing structure and mode of acquisition.
Key findings yielded primarily two conclusions: the piece of evidence that, by the end of 2012, both BMW Group and Tesla Motors stock is found to be undervalued by the market and synergies are approximately €2,65B, resulting in a premium of 93% over the average Tesla Motors’ market cap.
3
© Luís Verdasca GomesAcknowledgements
I would like to express my sincere gratitude to my thesis adviser, Professor Peter Tsvetkov, for the continuous support throughout the entire process of making this thesis.
I would also like to reveal my personal gratefulness to my Parents, for the ongoing and constant support. Finally, I am grateful to all my colleagues with whom I shared valuable discussions on technical issues, which helped me considerably in undertaking complex topics. To all, thank you for helping me during my thesis.
4
© Luís Verdasca Gomes Table of ContentsAbstract ... 2
Acknowledgements ... 3
Table of Contents ... 4
1.
Introduction ... 8
2.
Literature Review ... 9
2.1. Valuation ... 9
2.1.1. The components of FCF Models ... 10
2.1.2. Future Cash Flow Models ... 11
2.1.3. Growth Rate ... 12
2.1.4. The Cost of Capital ... 12
2.1.5. The Beta... 14
2.1.6. The Risk Free Rate (Rf) ... 14
2.1.7. The Risk Premium ... 15
2.2. The Weighted Average Cost of Capital – WACC ... 15
2.3. Adjusted Present Value ... 16
2.4. Relative Valuation - Multiples ... 18
2.5. Cross – Border Valuation ... 19
2.6. M&A Transactions ... 20
2.6.1. Classifying M&A Transactions ... 21
2.6.2. Synergies ... 22
2.6.3. The Emphasis of the M&A ... 23
2.6.4. Return on M&A ... 24
2.7. Conclusion ... 26
3.
The Automobile Industry and Company Analysis ... 27
3.1. The Industry ... 27
3.1.2. Overview ... 28
3.1.3. Porter’s 5 Forces ... 30
5
© Luís Verdasca Gomes3.1.5. Special Focus –The Market for Premium Vehicles... 34
3.1.6. Seasonality in the Automobile Industry ... 37
3.1.7. Research and Development ... 37
3.1.8. Business Essentials ... 38
3.1.9. Latest Trends in the Global M&A Market ... 39
4. The Companies ... 41
4.1. BMW - Bayerische Motoren Werke (:BMW GR) ... 42
4.2. Tesla Motors (:TSLA US) ... 44
4.3. Performance in the Stock Market ... 47
5. Stand-Alone Valuation: The Acquirer and the Target ... 48
5.1. Tesla Motors, The target firm ... 49
5.1.1. Revenue Forecast ... 49
5.1.2. Expense Forecast ... 52
5.1.3.
Operating Expenses (OPEX) ... 54
5.1.4. Operating Working Capital ... 54
5.1.5. Financial Leverage ... 56
5.1.6. Valuation Methods Assumptions and Results ... 56
5.1.7. Cost of Capital ... 56
5.1.8. APV Method ... 59
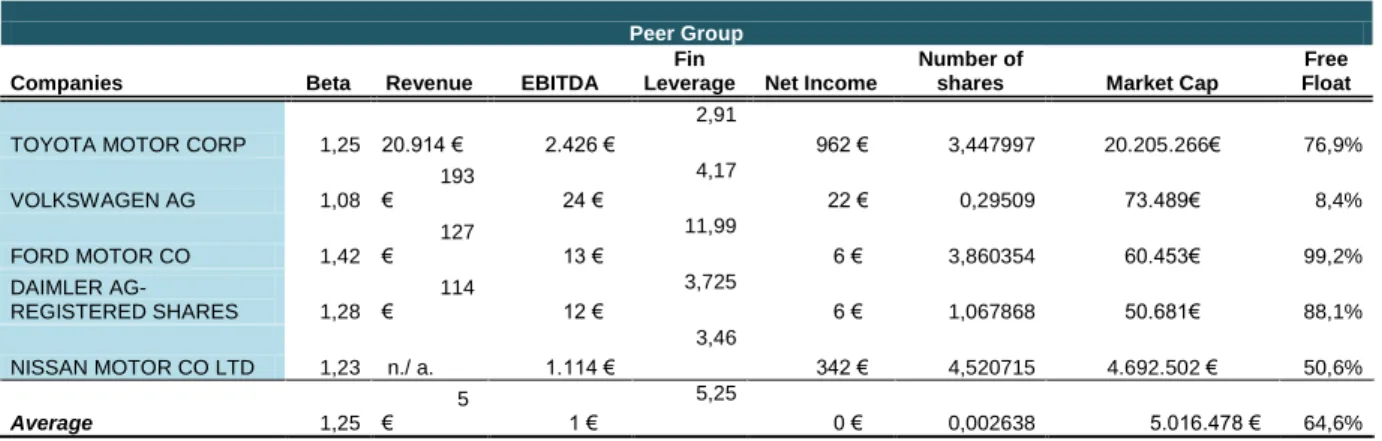
5.1.9. Peer Group and Relative Valuation ... 61
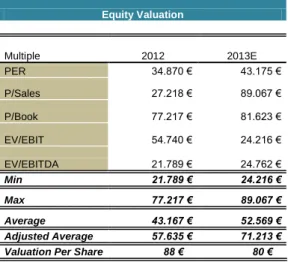
5.1.10. Output of the Valuation ... 63
5.1.11. Sensitivity Analysis ... 63
5.1.12. Comparison with Equity Research Reports ... 65
5.2. BMW Group, the Acquirer Firm ... 65
5.2.1. Revenue Forecast ... 66
5.2.2. Expense Forecast ... 69
5.2.3. Cost of Goods Sold ... 69
5.2.4. Research and Development (R&D) ... 70
6
© Luís Verdasca Gomes5.2.6. Other Operating Income and Expenses ... 71
5.2.7. Depreciation and Amortization (D&A) ... 71
5.2.8. Operating Expenses (OPEX) ... 71
5.2.9. Operating Working Capital ... 72
5.2.10. Financial Leverage ... 73
5.2.11. Valuation Methods Assumptions and Results... 74
5.2.12. Cost of Capital ... 74
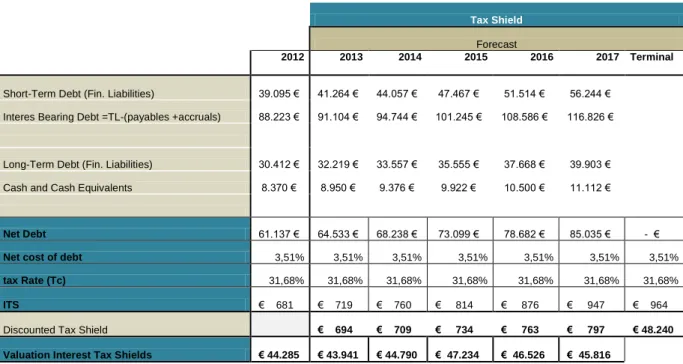
5.2.13. APV Method - Tax Shields and Costs of Financial Distress ... 76
5.2.14. Peer Group and Relative Valuation ... 77
5.2.15. The Output of the Valuation ... 79
5.2.16. Sensitivity Analysis ... 79
5.2.17. Comparison with Equity Research Reports ... 81
6. Valuation of the Merged Entity ... 81
6.1. Valuation of the Merged Entity without Synergies ... 82
6.1.1. Adjustments to the Valuation Model ... 82
6.1.2. Conclusions ... 83
6.2. Analysis of Synergies ... 84
6.2.1. Synergy creation - Strategic View ... 84
6.2.2. Understanding the layers of value creation ... 85
6.2.3. Combinational Synergies ... 86
6.2.4. Transformational Synergies ... 89
6.2.5. Financial Synergy ... 90
6.2.6. Costs associated with Integration ... 91
6.3. Valuation of the Merged Entity with Synergies ... 92
6.3.1. Valuation Considerations ... 92
6.3.2. DCF- WACC Based Results... 92
6.3.3. Distribution of Synergy Benefits ... 94
7. The Acquisition ... 94
7.1. Form of Acquisition ... 95
7
© Luís Verdasca Gomes7.1.2. Distribution of Synergy Benefits ... 96
7.1.3. Premium Offered ... 97
7.1.4. Method of Payment ... 99
7.1.5. The Takeover Offer ... 100
7.1.6. Other Potential Bidders ... 101
7.1.7. Execution Risk ... 102
8. Conclusion ... 103
9. Appendix ... 104
Appendix 1: Company Information and SWOT Analysis ... 104
Appendix 2: Company Valuation ... 107
Tesla Motors ... 107
Statement of Operations ... 107
BMW Group... 109
Statement of Operations ... 109
Appendix 3 : Combined Entity – Financials ... 112
Statement of Operations: ... 113
10. Bibliography ... 115
Academic Material ... 115
8
© Luís Verdasca Gomes1. Introduction
This dissertation will present the case of a proposed M&A transaction between the BMW Group and Tesla Motors. Bayerische Motoren Werke AG, is one of the best-selling luxury automakers in the world while Tesla Motors is a start-up company that designs, manufactures and sells electric cars. The objective of this case is to analyse the strategic and financial reasons that may justify a consolidation process between the two companies mentioned above.
Considering the expectations of high-growth for Tesla Motors, one might take as certain its position as a target company to established premium vehicle manufacturers that bet on acquisitions to enter the emergent, yet unexplored, market for electric vehicles. This could be an option of a strategy to stop thinking on survival and bet on profitable growth of long-term operations.
My personal curiosity about the global automotive industry and M&A, lead me to consider and develop of this case. The literature review, as the first step of this study, will present the various theories on the valuation of companies. In order to understand and discuss those theories, frameworks and suppositions that practitioners and academics apply are methodically explained.
The historical background, of both, companies and respective industries are presented in order to provide the necessary information that would be necessary in the creation of a valuation model reflecting the current and expected performance of companies and their respective environment.
The performance and forecast section provides the prospects for BMW and Tesla’s standalone progression in a value basis. This was achieved through the development of a valuation model that was also used to quantify the output of the merger. Subsequently all expected value improvements were considered for the merged entity in order to provide a sound basis for the structure of the deal.
In the final section, particular transaction details were examined and an opinion formed on how to carry out the acquisition. Furthermore there were proposed a few procedures of how should BMW act in order to assure that the value is created.
9
© Luís Verdasca Gomes2. Literature Review
Corporate mergers and acquisitions are events of big importance, according to Sirower and Sahni (2006), few if any decisions carry as much immediate and ongoing risk to shareholders as a major acquisition. The rationale behind such importance depends on the fact that M&A transactions are opportunities that give two companies the possibility to worth more operating as a united entity than they would be worth, if summed as individual entities. The generation of additional value by combining two firms and creating opportunities that would have not been available to these firms operating independently can be well defined as synergies (Damodaran 2005).
The ability of companies to capture this additional value is still, a theme of general discussion in the finance literature. Even though such transactions are opportunities, some authors defend that firms have not been able to exploit its potential benefits, leading negative effects on shareholder value.
Ultimately it is the comparison between value creation in the acquirer’s shareholders perspective and the final price of this purchase that determines if the investment produces value. Furthermore, it is the reliability of a valuation that provides the sustenance of M&A decisions. Thus corporate valuation and its accuracy have a major role in the success of M&A operation.
2.1. Valuation
Defining the value of a company is a task that can fallow a wide range of approaches. The use and rationale of those valuation methodologies is not always of a consensus. As Kaplan and Ruback (1996) state, professional and academics are associated with the use of distinct methods, additionally, there is little empirical evidence on which one, the discounted cash flow method or the comparable methods, provide the most reliable estimates of market value. In fact, there are models that require more input information or provide more output information, commonly each specific situation leads to a specific valuation method. According to Damodaran (2005), the models differ in its assumptions about pricing, but they do share some common characteristics and can be classified in broader terms. As result, the differences among models can make it easier to understand where a certain model fit into the big picture, but also why those models provide different results if its reasoning is not correct. Moreover it is of general agreement among authors that the stability of the capital structure has a crucial point in choosing a valuation method (Miles & Ezzel, 1980).
As a starting point, it is of common acceptance that the best practice for valuing operating assets is the discounted cash flow methodology (Luehrman, 1997). It is also generally established that valuation models follow the estimation on some form of present value approach, those models were first introduced with Irving Fisher - ”The Theory of
10
© Luís Verdasca GomesInterest” (1930) and John Burr William’s in “The Theory of Investment Value’” introducing the DCF concept. This practice, the Discounted Cash Flow, provides the estimation of the present value and future income streams to the company investors (Young et al. 1999).
Alternatively, a relevant valuation method and the most widely used by professionals, is the method in which companies use trading or transaction multiples. In those methods, a ratio or multiple of value relative to a performance measure is calculated for a set of guideline or comparable firms (Kaplan and Ruback, 1996). Additionally, the main negative side in this valuation method is that they tend to be more difficult to use to value more unique firms, with no obvious comparables, with little or no revenues and negative earnings (Damodaran 2002).Further recommendations suggest one use a scenario-based cash flows with probabilities than to apply the real options approach (Kester & Froot, 1997).
2.1.1. The components of FCF Models
A company’s value lies in its potential to generate a stream of profits in the future. (Frei
& Leleux, 2004). A company’s valuation is based on assumptions as to what a company’s
future may look like.
As confirmed by a few authors (Frei & Leleux, 2004 and Damodaran, 2002) corporate finance theory indicates that the value of any asset is equal to the present value of its cash flows. These cash flow valuations vary from each model to apply. The “base-case” method would be to discount the cash-flows at a risk-adjusted discount rate to arrive at an estimation of value (Damodaran, 2002). Common rule, the Discounted-Cash-Flow models applies the expected cash flows that are expected to yield from the assets in place and the growth assets in the company, discounting them to present date.
The delineation of a discount rate that reflects the riskiness of the cash flows (Luehrman 1997) can prove a complicated task as it complies expectations on return on capital once invested, growth rate as well as growth period. Additionally the subsequent value will be dependent on the previous assumptions.
The most common method is to estimate the cash-flows for a limited period of time and after this time the cash-flows are expected to grow at constant rate allowing us to reach a terminal value.
These estimations are expected to provide an integrated set of forecasts that reflect the company’s expected performance. The forecasting process is developed by defining a specific period for a number of years and then to value the remaining as a perpetuity. As the perpetuity formula assumes a steady-state performance, the specific period should be long
11
© Luís Verdasca Gomesenough to ensure the company earns a constant rate of return on both existing capital and new capital invested.
2.1.2. Future Cash Flow Models
As it is the most preferred model among academics and practitioners (Koller et al. 2010). The main focus of this section will this essential step is to calculate the free cash flow to the firm. According to Damodaran (2005) FCFF is the amount of cash earned by a company after paying all operating expenses, taxes and reinvestment needs but before paying any interest or dividends to debt holders or equity holders.
h Furthermore, this model discounts free cash flow, meaning the cash flow available to all investors (Koller et al. 2010). This includes equity holders, debt holders, and any other non-equity investors, typically estimated in terms of weighted average cost of capital (WACC), meaning the mix of costs arising from all capital.
Considering the mathematical formula of this methodology, one can understand that this model consists of two main components. At first, the expected cash flows are discounted to its present value up to a certain point and added to the terminal value calculation. According to Ohlson & Zhang (1999), the explicit period of forecast is generally less than 15 years and it would be important estimating until a company enters into a stable growth stage.
Even though the rationale to follow, would be to discount all the future cash flows at WACC, Kaplan et. al. (1996) defends this bipartition of the formula arises from the difficulty in the calculation a correct WACC, which can reveal to be difficult and tiresome as it requires that the cost of capital be recalculated for each period so that one can account for the changes in leverage. Since this model does not directly reflects the hypotheses on the operating performance of the firm, in every single year of forecast. It has become commonly acknowledged that one can proceed to use a terminal value in order to determine the remaining value once growth is stabilized.
The second part of the equation stands the terminal value that accounts for the value created after the explicit forecast period. It is pertinent to observe that the later the cash-flow, the higher the discount rate will be as a consequence of the exponent increase. Supplementary information is that the claims on cash flow of debt holders and other
non-12
© Luís Verdasca Gomesequity investors are subtracted from enterprise value to determine equity holders’ value (Koller, et. al. 2010).
2.1.3. Growth Rate
Higher growth rate are frequently associated with small and starting companies, as companies grow larger those values tend to stabilize, an explanation is that most products have natural life cycles, the only way to achieve lasting high growth is to continue introducing new products at an increasing rate (Koller et al., 2010). Mathematically we can define growth rate (g) as the product of return on invested capital (ROIC), after tax and the reinvestment rate (Damodaran 2007).
h There are a few inferences one should take from the previous formulas. A first fact is that the invested capital, the denominator of the formula, should avoid biases and the mark-up that market complements to existing assets being always stated in book value terms. In order to maintain the consistency of the model cash is subtracted. Furthermore the earnings income is our measure of growth, and interest income from cash is not included in the operating income (Damodaran 2007).
As Damodaran (2002) explains, in the long run no firm can grow faster than the level of depreciation. This means that in a long-term perspective it would not make sense to have depreciation that has greater value than the capital expenditures. Furthermore, as Kaplan & Ruback (1996) suggested, capital expenditures (CapEx) should be considered equal to depreciation in a stable stage of the projections. Hitchner (2003) affirms that a thorough evaluation of the subject company’s historical growth can be utilized to assist in growth determinations as well as published estimates of industry growth rates.
Other authors (Damodaran, 2002 and Koller et al 2010) claim that a stable long-term growth rate should not be higher than the economy’s growth rate and that the reinvestment rate and growth rate should be consistent. When reaching stable growth, firms tend to reinvest less than higher growth firms and if the firm is to sustain its stable growth rate we need to make sure that the reinvestment rate is high enough to support this growth level. 2.1.4. The Cost of Capital
Defined as the opportunity cost of investing in a project with similar risk, the cost of capital is a relevant piece of any cash-flow valuation approach (Copeland, T. et al., 2000).
13
© Luís Verdasca GomesQuoting Luherman (1997), the discount rate should reflect the time value of money and a risk premium to compensate the investor for the additional risk. For the case of the Free cash flow to the firm approach, the discount rate utilized in a FCFF valuation is a weighted-average cost of capital (WACC), this is a rate adjusted to risk replicating the overall risk of the capital for the firm.
Concerning the debt holder’s composition in a company in practice, of course, debt differs in several important respects, including maturity, priority, convertibility, call provisions, covenant restrictions, and whether the debt is privately placed or held by public investors (Shivdasani and Zak, 2007). In what considers the estimation of the cost of capital, only the Net Debt, which comprises Long and Short-term Debt subtracted of Cash and Cash Equivalents, should be taken into account. Damodaran (2010) defines the cost of debt simply as a function of the current level of risk free interest rate and a default spread.
With respect to the equity investors of the firm, the required return rate for their residual claim on the firm is the cost of equity. The most commonly accepted among the models is the model presented by Sharpe in 1964 and Lintner in 1965, this is known as CAPM – Capital asset pricing model, the main rationale was that the return on any asset is the risk-free rate ( ) plus a risk-premium depending the fluctuation of the asset’s value with market ( ). A primordial assumption is that investors are well-diversified and their major concern is the non-diversifiable risks of the stock. Accordingly Koller et. al. (2010), the model relies in the fact that every investor holds some combination of the riskless asset and the market portfolio leads to the next conclusion: the expected return on equity of a certain company is linearly related to the beta of the asset, which is the company’s risk profile.
Another important assumption in this model is that diversification enables the investor to escape all risks except for the overall market risk. It is also important to mention that, since debt is prior to equity in receiving returns, a consequence of an increase in the debt ratio would be a reduced probability of shareholders receiving their returns in case of financial distress. On the other hand, it is argued that all other risks, excluding market risk, are diversifiable. This leads to the conclusion that only the company’s rate of return to the level of economic activity is relevant in when considering risk, agreeing with Sharpe (1964).
Consequently, one should distinguish between the cost of unlevered equity ( ) and cost of equity ( ).
14
© Luís Verdasca Gomes(
2.1.5. The Beta
The CAPM implies that the expected return of an asset must be linearly related to the covariance between its return and the return of the market portfolio (Esteban M., 2010). Beta measures the extent to which returns on the stock and the market move together (Bodie, Kane and Marcus. 2008) and the rationale behind this is that if an investor adds a stock that increases the overall risk of the portfolio, this investor will require a higher return. Damodaran (2010) recommends that a beta can be simply computed by regressing equity returns on a market portfolio, usually historical monthly returns for a period of at least three years, being the resulting slope coefficient the company’s beta. In a more practical application, as the market index may be biased, it would add consistency to this approach if one calculate the average beta for the industry, since it would help avoiding miscalculations. Agreeing to Koller et. Al. (2010) even with a robust estimation process, judgment is still required. In the case one find it adequate, one should consider how the industry is likely to move with the economy.
Formula for the Beta:
2.1.6. The Risk Free Rate (Rf)
Agreeing to Damodaran (2008), The risk free rate is the building block for estimating both the cost of equity and capital. A risk-free rate could be defined as the expected return on an investment with no default risk. Theoretically, Risk in finance is viewed in terms of the variance in actual returns around the expected return (Damodaran 2008), this resembles to the return paid on a zero-beta portfolio. Damodaran (2010) suggests that the risk free rate should be the long term government bond rate. If the analysis is shorter term, the short term government security rate can be used as the risk free rate. Additionally, even though there is a general assumption that government bonds were for the most part default free and that the government bond rate was therefore a risk free rate, the market is clearly distinguishing creditworthiness across countries. A very practical rationale is that 10-year Treasury bonds, general rule, matches the duration of the cash-flows, being relatively low sensitive to inflation and providing consistency to the valuation.
15
© Luís Verdasca Gomes2.1.7. The Risk Premium
Risk Premium can be measured as the difference between the expected holding period return associated with a certain level of risk and the risk-free rate, that is, the rate you can earn by leaving money in risk-free assets such as T-bills, money market funds, or the bank (Bodie, Kane, Marcus, 2008). This is a constituent of the CAPM model, and can be simply explained as the difference between , the size of this premium can be determined by a wide range of factors, such as the invertors’ risk aversion, the market liquidity and the macroeconomic volatility.
Damodaran (2011) suggests that the risk free rate chosen in computing the premium has to be consistent with the risk free rate used to compute expected returns. Consequently, if the treasury bill rate is used as the risk free rate, the premium has to be the premium earned by stocks over that rate. For this reason, one shall use the most representative equity market. The use of this tactic for a given mature market may yield historical premiums of higher value than expected premiums. The reason for this is survivor bias which is the case of removing failing companies from the historical databases as they are not operating anymore. It is also argued that looking across multiple markets for very long time periods can mitigate this bias (Damoradaran 2011).
In the particular case of CAPM, the only risk that is relevant for purposes of estimating a cost of equity is the market risk or risk that cannot be diversified away. The question relies whether country risk becomes the additional risk in an emerging market is diversifiable or non-diversifiable risk.
A viable option would be, as Damodaran suggests, would be to multiply the country rating by the average of equity to bond market volatility and then added to the historical risk premium. Authors and practitioners classifies as the appropriate range between 4.5% and 5.5% (Koller et al. 2010) Other approaches include estimating the premium is through surveys, and by using the implied premium. In its studies, Kaplan S. (1996) suggests one
should bear in mind that the use of lower risk premium – recommended by many
practitioners as weld as some academics – would reduce the accuracy of the discounted cash flow estimates of value.
2.2. The Weighted Average Cost of Capital – WACC
As an exemplification of the aggregate risk of a company or business, the weighted average cost of capital (WACC) calls for a balanced capital structure in which debt and equity are utilized at some predetermined percentage (Block, S. 2011). Nevertheless, there can be some errors associated with misunderstand of the formula to calculate WACC, quoting Modigliani & Miller (1958) the authors claimed that in the absence of taxes leverage
16
© Luís Verdasca Gomeshas no impact on firm value, however, in a practical approach tax shields and costs of financial distress suggest this method is questionable. Fama and French concluded that equity returns are inversely related to the size of a company (as measured by market capitalization) and positively related to the ratio of a company’s book value to its market value of equity, being so the use of book values in spite of market values in the calculation of the capital structure may present a modest estimation.
Additionally, Fernández (2011), reminds that calculating the WACC assuming a capital structure that is neither the current one nor the forecast: the debt to equity ratio used to calculate the WACC is different from the debt to equity ratio resulting from the valuation.
There is not a common opinion regarding the use of WACC, while Luehrman (1997) affirms using WACC as the discount rate is now obsolete, Damodaran (2005) defends that it can be a methodology worth using as it is flexible enough to allow the capital structure to smoothly change over time. The hypothesis of computing the value of WACC every year is a feasible option but it requires new assumptions and thus introduces noise to the valuation. One of the most suggested alternatives is a generalized version of the Fama-French three-factor model. In which the Arbitrage Pricing theory states that a security’s actual returns are generated by k factors and random noise (koller et Al. 2010).
2.3. Adjusted Present Value
Adjusted Present Value is designed to value operations and any existing asset that will generate future cash flows. It is a methodology to analyze financial maneuvers separately and add their value to that of the business (Luehrman, 1997). This valuation model follows the teachings of Modigliani and Miller, who proposed that in a market with no taxes, a company’s choice of financial structure will not affect the value of its economic assets (Koller et al 2010). The execution of this model can be appraised based on four or more steps, this depends, not only on the number of different sources of capital there are but also in the way the analyst wants to separate the enterprise value. At an initial phase, the model separates the value of operations into the value of operations as if the company were all-equity financed and the value of tax shields arising from debt financing. Consequently, it is valued the cost of financial distress so that in a final phase one can add the base-case to the other individual components reaching the value of the firm.This methodology can be expressed in the following mathematical formula:
17
© Luís Verdasca GomesLuehrman (1997), defends that this valuation methodology is exceptionally transparent, providing a more complete information about where the value reside and helps understand where value can be improved. The author adds that, the breakdown of the problem into operationale and financial parts clearly add managerial information to the analysis.
h
The equation above works as the main differential factor of the APV, this is, the, a first step is to discount the cash flows at the unlevered cost of equity obtaining the value of the company without debt. With reference to the operationale part, one can say the procedure is exactly the same as the one of FCFF, the difference resides in the discount rate: the FCFF discounts at WACC, while the discount rate on the APV method is the unlevered cost of equity.
The second equation one should take into account is the one postulating the value of future tax shields, in the case that the amount of debt is held constant and considering that tax shields have the same level of certainty as the principal and interest payment on debt. One should consider that the use of this formula in a scenario of a growing firm which is expecting to increase its debt level proportionally to its growth, would not be a reasonable practice. It is also noteworthy that in the long-run, the assumption is that indebtedness grows at the same pace as the company, makingthe perpetual tax shield growth (g) equal to growth (TGR) in operations (Luehrman, 1997).
h
The next rationale step would be to evaluate the outcome of the given leverage on the default risk of the firm and bankruptcy costs. According to Damodaran (2002) if PI is the probability of default after the additional debt and BC is the present value of bankruptcy cost. The estimation of the present value of expected bankruptcy cost could be estimated as:
It is stated by Korteweg (2007) that from a study across 22 industries and 244 firms that the market expects costs of financial distress to be from 0% to 11% of firm value for observed levels of leverage. Additionally, some have endorsed the higher returns that Fama and French (1992) show are earned by firms with low price to book ratios to distress while low price to book stocks, are more likely to be distressed (Damoradaran 2007).
18
© Luís Verdasca GomesRegarding the estimates of indirect cost of bankruptcy as Shapiro and Titman speculate, the indirect costs could be as large as 25-30%, providing no evidence of costs. In opposition, Damodaran (2007) suggests that the probability of bankruptcy can be estimated through the bond rating or to estimate the probability of default, based upon the firm’s observable characteristics, at each level of debt. As final step as Luerhmen (1997) suggests, one should ass the pieces together.
Bearing in mind a company would have no PVTS if there was no operations, this component should be multiplied by the probability of no distress. In opposition, the CFD would only incur in the opposite scenario, bankruptcy.
2.4. Relative Valuation - Multiples
Despite the fact that discounted cash flow analysis is the most accurate and flexible method for valuing projects, divisions, and companies (Koller et al. 2010), Damodaran (2002) defends that earnings multiples remain the most commonly used measures of relative value. Contrasting with the cash flow or return-based methods, relative valuation concentrates on market expectations for a certain company based on its relative situation alongside its similar companies. As Kaplan and Ruback (1996) explains, in relative valuation methods, a ratio or multiple of value relative to a performance measure is calculated for a set of comparable firms. Hence, valuation by multiples requires calculating the average of one or more financial ratios for a group of comparable companies and applying those ratios to a specific company (Lie and Lie, 2002).
The quality of these valuations relies on its assumption. First, comparables are assumed to have expected future cash flows that grow at the same rate and have the same level of risk as those of the firm being valued (Kaplan and Ruback 1996). Second, the selection of the correct set of multiples.
The importance of those assumptions rely in the fact that the comparable method can reveal to be more accurate than any DCF as it incorporates contemporaneous market expectations of future cash flows and discount rates in the multiple. It is also noteworthy that one should use a set of multiples since it would provide a more rigorous valuation and add a broader perspective on what drives the value. Regarding the choice of which multiples to apply, while Goedhart et al. (2005) defends that a good multiple must describe a company’s ability to generate profit but also be difficult to manipulate through accounting or leverage. A study from Mînjina D. (2010) defends that the most accurate selection method is ROE, as in the case of Price-Earnings method, and the least accurate is TA, price-total assets multiples. A third authors, Lie & Lie (2002) affirm that in their analysis of multiples total enterprise
19
© Luís Verdasca Gomesmultiples are better estimates of value, being the multiple Enterprise Value/Book Value the most accurate estimator.
Additionally one should add that comparable industry transactions values effectively combined the comparable company and comparable transaction approaches. This comparable industry transaction method uses multiples of firms in the same industry involved in a similar transaction (Kaplan and Ruback 1996).
Finally, this valuation method is the most recurrent among practioners, research on relative valuation corroborates this methodology can provide reliable estimates of value. Koller et. al. (2010) defends that when comparative analysis is careful and well reasoned; it not only provides complementary information for the DCF but also provides critical insights into what drives value in a given industry.
2.5. Cross – Border Valuation
As Kester and Froot (1997) explain, acquisitions of American targets by foreign companies rose about 50% only in the decade 1980-90. This trend of increasing in acquistions at a global scale, rose the question of how should a company evaluate an investment in a firm in another country. The authors made available guidance on how to value cross-border investments. The authors identified a group of main issues that directly impact the valuation of cross-border operations.
The valuation of companies outside the home country rise some issues needing special attention, one should consider international accounting differences, international taxation, translation of foreign-currency financial statements and the estimation of the cost of capital in foreign currency.
International accounting differences are rapidly becoming less of an issue, in Europe and Asia the accounting practices by adopting International Financial Reporting Standards (IFRS whereas the U.S. GAAP was also adopted by a large part of the organizations to facilidate comparisons and transparency for investor and analysts.
Under U.S. GAAP and IFRS, consolidation is determined by effective control: if parent companies effectively control subsidiaries, these must be consolidated.
Another important issue is the taxation of the corporate income. In order to estimate taxes on projected future income, one would need to understand what the relevant tax rate is and what amount of profits is actually taxable. There are cases on which some profit that is taxed in one country may not be taxable in another. In addition, many countries offer the possibility of fiscal grouping that is preparing consolidated tax filings for a group of companies that are owned by the same company. This can be advantageous in the case of
20
© Luís Verdasca Gomesa specific company generating profit and the other incurring in losses. The consequence would be that the amount of taxes that a company would pay on a stand-alone basis could therefore differ from other group companies in different jurisdictions.
As (Kester, Morley & Froot, 1995) suggests, there are two most commonly used tax approaches. The first would be to use of a worldwide tax credit system, Corporations headquartered in countries which use this system owe taxes to the headquarter country on all of their worldwide income, however, foreign income taxes paid must be credited against taxes on foreign-source income in the headquarter country. The use of a territorial tax exemption system, this system suggests taxes are paid and calculated locally. In this case the country’s marginal corporate tax rate should be used in calculating the after-tax free cash flows.
A very important piece is the appropriate currency to choose, either to calculate free cash-flows (FCF) or measuring discount rates. First of all, CFs that are earned on an investment in a foreign country may not be converted into home currency and remitted directly back to the foreign parent ( Kester, Morley & Froot, 1995). According to Kester et al. (1997), foreign-currency cash flows can either be discounted with a discount rate adjusted for foreign-exchange risk, or they can be converted to home currency in order to be discounted with the appropriate home-based discount rate. In the use of both methods the value should be the same. Additionally “the choice of currency in which to denominate valuation should not drive the result”. In sequence, this decision should be based upon available information to compute the appropriate exchange rates: the information on long term interest rates, forward exchange rates of expected inflation rates for, both, home and foreign countries.
One should consider the mathematic formula for converting the discount rate:
2.6. M&A Transactions
Initially, the starting point would be to isolate potential target firms then estimate how would it adequate with the company’s strategies. Moreover, one should ensure to be choosing the finest firms to set as target in order to start negotiating with their boards and main stakeholders. Successively, the conclusion of a transaction with one firm does not imply that the process is at its end, it is essential to develop an effective post-merger integration. The explanation of the main types of M&A and its source of financing as well as the functioning of how synergies are explored and shared will be the main subject of this section.
21
© Luís Verdasca GomesOverall, it is the economic, regulatory or technological the main factors causing industry merger waves. Additionally, sufficient capital liquidity must be present to accommodate the necessary transactions (Harford, 2004).
2.6.1. Classifying M&A Transactions
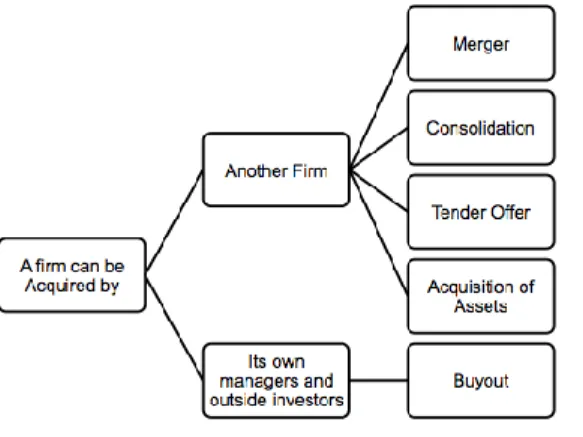
Despite the fact that M&A is mentioned a single class of action, these transactions can range from one firm merging with another firm to create a new firm to managers of a firm acquiring the firm from its stockholders and creating a private firm (Damodaran 2002). The main differentiator factors among these operations are not only who acquires the company, but also how is the company expected to be operating after the deal.
Damodaran (2002) provides us with the following distinctions among transaction types:
Mergers – target firm becomes a part of
acquiring firm
Consolidations – target firm and
acquiring firm becomes a new firm
Tender offers – target firm continues to
exist as long as there are dissident
stockholders holding out (successful tender offers ultimately become mergers)
Purchase of assets – target firm remains
as a shell company, but assets are transferred to the acquiring firm
As common facts, one should add that consolidations and tender offers are the transactions that are fundamentally the same in a long-term consideration. While Tender offers incline to be viewed as mergers, consolidation occurs as a merger of the companies into another entity. Furthermore, tender offers are supervised to the target company stockholders developing as the mode to avoid a firm’s board in hostile takeovers (Loughran and Vijh, 1997). The main purpose of tender offers is to disconnect inefficient managers.
As Bruner (2004) states, the way one access a particular M&A deal depends on our frame of reference, each M&A transaction can present different forms and a different effect.
An acquisition could be classified conferring to the level of connection of the two organizations as horizontal, vertical or conglomerate, as authors argue. Commonly, a horizontal acquisition occurs when both firms compete in the same industry. Although in a
22
© Luís Verdasca Gomesvertical acquisition, the buying and the assimilated firms are counterparts in its value-chain and not opponents. Moreover a conglomerate or diversifying acquisition companies arise in companies that are entirely distinct.
2.6.2. Synergies
Synergy is the additional value that is generated by combining two firms, creating opportunities that would not been available to these firms operating independently (Damodaran, 2005). In addition one must misplace this concept with the definition of control, which is the value of operating the company more efficiently under different control (Damodaran, 2005). Therefore, control and synergy must always be measured independently assuring that double counting is prevented.
Damodaran (2005) suggests the existence of two distinct forms of synergies: Operating and Financial. The first form, Operating Synergies, denote the effect of the operations of the combined firm, including economies of scale, increasing pricing power and higher growth potential.
In opposition, in a Modigliani-Miller (1958) world without taxes, bankruptcy costs, informational asymmetries, or agency costs, there are no purely financial synergies. Nevertheless considering the existence of taxes and default costs, a company’s capital structure becomes relevant (Leland, 2007) and the financial synergies arise from tax benefits, diversification, higher debt capacity and use of excess cash.
Additionally, diversification can be a font of financial synergy even though of ambiguous outcomes as they can differ crosswise countries and industries and a company’s size, ownership structure and corporate governance (Lins and Servaes, 1999) furthermore, financial synergies can be positive if favoring mergers or negative if favoring separation (Leland, 2007).
One should bear in mind that the value returned on synergies can be dubious for some cases, occasionally value improvements are remarked for erroneous explanations. An example is the usage of accretive acquirements of targets that present inferior earnings per share (EPS) with the purpose of an immediate value improvement, which would not increase the value of the firm supplementary than synergies that are captured by investors. Conversely to this line of though, a study on EPS accretion discovered that it actually yields value, although this practice appears to be characteristic of enterprises presenting unsophisticated investors (Andrade, 1998). Alternative example of dubious synergy is the acquisition of forthcoming high growth companies, which are highly priced and may only yield value if the right price is paid.
23
© Luís Verdasca GomesClassically, DCF approaches appear as the recurrent valuation method for all these synergies. It is a multifaceted however consistent method that constantly demands a comparison among the combined firm and the ones deprived of synergy.
2.6.3. The Emphasis of the M&A
Researchers have shown that acquisitions collectively do create value for the shareholders of both the acquirer and the acquired company (Koller et al. 2010). This value creation through synergies is still a theme of discordance among authors, moreover there is an intermittent issue asked in M&A, that is whether to chase a diversified or, in opposition, a related acquisition strategy. Even though a diversified acquisition suggest that managers are determined to invest to make up for modest performance and reduce risk reassuring the survival of the company. Studies report that this type of acquisitions presents a poor performance when compared to comparable acquisitions. It is commonly conveyed that the benefits are stronger and easier to exploit in related acquisitions, leading, as result to higher returns (Bruner, 2004). Nevertheless, the conclusions on the effect of M&A transactions are not consensual.
2.6.3.1. Methods of Payment – The Optimal Structure of the Deal
Developing the finest structure for the M&A is largely dependent on the acquisition itself, but there is still some useful recommendations on method of payment. The M&A financing decision can also have serious corporate control, risk bearing, tax and cash flow implications for the buying and selling firms and shareholders (Faccio, 2004). Additionally the financing methods can be either cash, stock, mixes of both existing the possibility of a contract whose payout depends on the performance of the target. Nevertheless, it is suggested by Bruner (2004) that such use of risk-management strategies can lead to invalidation of the contract invalidating any imbursement previously agreed.
Ultimately, the choice concerning cash or stock relies a set of three factors:
Primarily, an analysis of the accretion or dilution to the earnings that result from the merger is compulsory before any financing decisions.
According to a few authors, Travlos (1987), Wansley, Lane and Yang (1987) and Brown and Ryngaert (1991) it was found a noteworthy negative average returns to acquirers when the method of payment is stock rather than cash. One dominant explanation for this pattern is that stock financing creates an adverse selection effect similar to a seasoned stock offering (Faccio, 2004). Moreover, deciding amongst stock and cash financing depends on whether its stock is overvalued or undervalued, respectively (Myers and Majluf 1984) this consideration finds it support because managers possess private information about the company’s financial position, being able to choose the best method for financing. Following
24
© Luís Verdasca GomesHeron and Lie (2002) and their study about the connection between payment category, they described no significant disparities in operating performance based on payment category, yet, returns on cash-based deals remained higher compared to stock-based deals. As this is not consensual Martin (1996) also classifies the form of M&A payment into cash and stock but it is recommended that it is not a straightforward decision as studies point that mergers tend to be financed specifically with stock whereas tender offers have cash as main source of finance.
Besides, it is also important to consider the weight that capital structure and rating agencies have in financing decisions. There is empirical evidence that the risk is in cash transactions is mostly bared by acquiring shareholders while the risk is shared with the selling shareholders in the case of stock transactions (Damodaran 2005). Nevertheless, there is a risk that the use stock to finance the deals may symbolize a sign of low assurance regarding the deal.
The third factor is related to specific factors, for example, when a target’s home nation offers tax benefits to the target firm or its selling shareholder in a stock merger or stock financed acquisition, we would expect to observe a higher proportion of stock financing (Faccio, 2004). Additionally tax repercussions should also be taken into account since cash is directly taxed whereas stock could be tax-deferred. As Damodaran (2005) defends, a profitable firm that acquires a money-losing firm may be able to use the net operating losses of the later to reduce its tax burden. Ultimately, when one considers issuing debt to fund a cash acquisition, one must consider that debt should reside attached to its funding assets, consequently, it is rationale that the borrower is the target company.
2.6.4. Return on M&A
An important factor when considering synergies and the structure of the deal is the acquisition price, its importance resides in the fact that if the price paid for the growth exceeds the fair market value, the stock price of the acquiring firm will decline even though the expected future growth in its cash flows may increase as a consequence of the takeover (Damodaran, 2005). The value created for acquiring shareholders is directly dependent of the price paid for the target. Moreover, in the case that the premium paid for the target exceeds the value of the potential synergies that can be achieved, the transaction would return a value loss for shareholders ( Damodaran, 2005).
From a theoretical perspective, the share of synergy’s benefits amongst the acquirer and the target firm will depend on the benefits added by each party for its existence. Essentially, Damodaran (2005) provides us with some examples of different distribution of benefits. If there is the case of a transaction where the acquiring firm pretends to explore a
25
© Luís Verdasca Gomestax benefit through an acquisition, the distribution of benefits would depend on whether there were several firms able to explore that tax benefit against whether there were target firms considering to assess that synergy.
Sirower and Sahni (2006), introduce the notion of target shareholders as the winners in a short-run period, presenting a Relative Total Shareholder Return (RTSR) averaging 20%. Corroborating the previous statement, Damodaran (2005) suggests that this higher return for target shareholders could be the fact that target companies are in the position of bargaining and create competition among bidders in tender offers.
Considering the position of the acquirers, there is typically a very diminutive, if any, set of benefits arising from synergies and on average they underperform their industry peers (Jensen and Ruback, 1983). The returns are not uniform, its variable conferring to the form of payment and mode of acquisition, even though there is empirical evidence supporting the hypothesis that cash financed acquisitions and tender offers would provide superior results. The overall idea is that the inefficacy in M&A transactions arise from the failure of managers in planning for the synergies leading to the payment of an excessive premium paid for the target firms. The generation of a negative shareholder result and an increase in the shareholders’ value at risk (SVAR) is the result ascending in the case that synergies are not realized in the post-acquisition period (Sirower and Sahni, 2006).
One can reach the value created for acquirer through the following formula (Koller et al. 2010):
The SVAR was introduced by Sirower and Sahni (2006) and can be calculated following the formula, additionally it shows how much of company’s value is at risk if no post-acquisition synergies are realized. The main rationale behind this concept is: The greater the premium percentage paid to sellers, the higher the SVAR
h h h
h
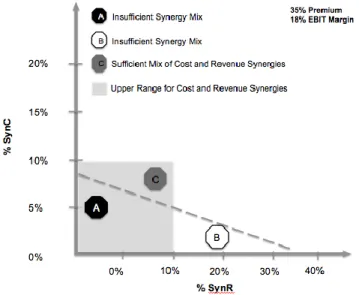
Bearing in mind the importance of the value of the potential synergies as the critical piece to crucial the premium (Sirower and Sahni, 2006), the model Meet the Premium (MTP) line delineates the premium paid for the target in relation to cost and operating synergies. This model provides a soundness check for evaluating a sensible price range in the transaction, given diverse mixtures of synergies.
26
© Luís Verdasca GomesIn the model, defends that a reasonable premium should be beyond the MTP line – which is combinations of revenue and cost synergies that compensate the premium one offers, respecting for the same time the plausibility box restrictions - which are the specifications for the upper ranges for revenue and cost synergies that can be achieved. Furthermore, contrasting each company’s market access and competences in some tactical or functional areas permits the determination of the type of synergies one can assume and whether they make operating sense.
Figure 2 Meet the Premium Line – The Senergy-Premium Model
2.7. Conclusion
The question remains unclear, are M&A transactions adding value to shareholders or not?! For that, there is no clear answer. It is accepted that discoveries in M&A transactions are found to be a failure plus investigation is inconsistent in specifying clear conclusions on M&A efficacy. According to Bruner (2004) investigation has been guided founded on outcomes previously and afterward M&A although the appropriate practice is to compare the current situation with a hypothetical one if M&A had not occurred. On the other hand, research indicates that most M&A succeed to increase value to the economy in total. All in all the already current literature on the topic has indisputably added some appreciated understandings for currents managers and academics.
Generally speaking, M&A transactions add value for the economy in total since one part captivates a large percentage of gains, the sellers, offsetting the minor percentage losses of the acquirers. In addition, Huyghebaert and Luypaert (2013), defend that industry conditions bear an important influence on M&A value creation, but also that M&A transactions are critical creating value in scenarios of high-growth or very low sales and growth.
27
© Luís Verdasca GomesUnderstandably, a more expanded research on the different types of transactions that actually yield value for both parts in the transaction could bring additional understandings in the opportunities that managers have to enhance value for shareholders and for the economy as a whole.
Finally, even though M&A transactions are complex and difficult to value, there are cases at which M&A yield reasonable options to increase value for the companies and for the overall economy.
3. The Automobile Industry and Company Analysis 3.1. The Industry
As a starting point one must understand that on a more purely economic plane, the automobile industry itself s a primary factor in the operation of the industrial system. The demands which makes upon raw materials, fabricated products, and corollary goods and services speak of its critical importance in the industrial structure.
The presentation of a full industry background study is an essential module when one considers an eventual deal. Such information provides the understanding of the specific characteristics of one industry in particular and contributes with several macroeconomic data that might have a particular impact in studying the industry.
The automobile industry, is a sector relatively sensitive to economic comings and goings, especially the European and American car market which have been historically correlated to consumer confidence. The analysis of developments in the industry could grant an additional in-depth analysis of the impact of macroeconomic events in the sector. At present date, the market have been presenting a strong performance over the past 12 months but one must consider that the sector continues to trade at ten-year relative lows to the market and remains the lowest rated cyclical sector.
Considering this specific case, it is relevant to mention that both companies operate in the automotive industry, more particularly in the passenger cars market sector. This industry is experiencing a process of change, with the major impact of the past four years of global economy recession having as a consequence major quality and production standards improvements, an example is the clear tendency to improve safety and fuel-efficiency characteristics, without correspondent increase in prices.
28
© Luís Verdasca Gomes3.1.2. Overview
Global automotive industry is now at a healthier state, having recovered from the crisis
and exhibiting a strong performance in Europe by the SXAP
1
in 2012. This industry handleda rough environment, after a solid growth from 2004 to 2007, the period of 2008 and 2009 was challenging, the profitability and margins for suppliers declined below the break-even point, resulting in an unprecedented breakdown faced by the markets. There was even the necessity for a few administrations to assist their automobile industry. Production utilization in North America, Western Europe, and Japan dropped dramatically leading to lay-offs, plant closures to widespread job losses.
Helping reversing the expected collapse in global car sales and contributing to a major recovery of over 3% in the passenger cars market, against the initially expected breakdown of 17% and with a global breakdown of 14%, some states developed car purchase incentives. These systems were established and detained by states to assist the car sales expansion and oppose the negative analysts’ perspectives.
As further consequence, in the past few years, many major auto manufacturers and suppliers have undertaken significant efforts to clean balance sheets, remove excess capacity, and restructure costs.
After this turbulent period, the estimated growth for 2010 was achieved for both, passenger cars and commercial vehicles, with a particularly fast recovery for the U.S. and emerging markets. The U.S. auto recovery demonstrated that with stronger balance sheets, legacy liabilities shed, debt reduction, and product/capital investment, this industry can return to consistent levels of profitability at lower annual sales volumes.
For 2012 the automobile sector was the top among the best performing segments in 2012, in Europe, it went up 35% compared with a rise of 15% in the Euro Stoxx
2
. This performance is assumed to be the product of a positive relative earnings momentum and a re-rating as the equity risk premium started to decline.It is also noteworthy that the auto industry is expected to outperform in an environment of improving consumer confidence.
1
SXAP- Is the STOXX 600 Automobiles & Parts (Price) Index Capitalization-Weighted index which includes European companies involved in the
automobiles & parts sector
2
29
© Luís Verdasca GomesConsidering growth expectations, in the U.S. the forecasts show a slow growth for most of 2013 as tax increases and government spending cuts offset private sector improvement, followed by a substantial acceleration in 2014 as fiscal policy turns more neutral. They general belief is that that the effect on employment is likely to be slightly less than the impact on growth as some federal agencies will reduce personnel costs through furloughs rather than layoffs, which would reduce the effect on employment. The U.S. remains the most profitable automotive market in the world, and the place where all global manufacturers need to succeed. But over the long term, emerging markets have much stronger growth prospects. This shift requires auto makers to preserve their competitive position in developed, mature markets, while also funding the investment necessary for longer- term growth elsewhere.
A higher preference to develop and produce electric vehicles, finding is support in both, customer demand and government incentives, noticeably makes environmental concerns emerge as a substantial factor in the industry. According Deloitte
3
the production of vehicles that are not propelled by an internal combustion engine, will progress up to a third of all cars purchased in developed countries in 2020.In addition, there is a major industry player, with the influence to invest using incentive packages or providing emergency loans governments have a permanent control on the industry’s trend. The continuous support to national corporations along with the approval of energy and environmental policies, will require modifications on the automotive sector over the next years, designing the expectation that suppliers and automakers will be experiencing intense changes.
3 Deloitte Report – “A new era, accelerating toward 2020 – An Automotive industry transformed”, 2009
63 59,9 58,5 48 52,7 52,2 2012 2011 2010 2009 2008 2007 21 20,2 19,4 13,8 17,8 20 2012 2011 2010 2009 2008 2007
Chart 1- Worldwide passenger car registrations (y-o-y variation) Source: Bloomberg data
Chart 2 – Worldwide commercial vehicle registrations (y-o-y variation) Source: Bloomberg data
30
© Luís Verdasca GomesAn important characteristic of the Automobile industry is its dependence on an efficient supply chain, as it is as four sub-sectors that could be divided into, the Original Equipment Manufacturers (OEMs) - auto manufacturers do produce some of their own parts, but there are companies in this industry responsible for manufacturing everything from door handles to seats; Suppliers - hold a influential role in this industry, Dealers that make the product available to the customers and the after-market service providers that are responsible for the maintenance of the vehicles sold: air filters, oil filters and replacement lights are examples of products from this area of the sector.
Considered to be highly capital and labour intensive, the auto manufacturing industry has as major costs: the labour – there are substantial labour costs in designing and
engineering automobiles; as well as the materials – depending on steel, aluminium, leader,
tires which are repurchased from suppliers; and advertising - the auto industry has substantial advertising cost as well as high costs on market research to anticipate consumer trends and preferences.
3.1.3. Porter’s 5 Forces
In order to understand the strategy behind the functioning of the automobile industry, the use of a Porter’s Five Forces Analysis would provide further insight about the competitiveness, intensity and consequently attractiveness of a market.
Potential Entrants
High entry Costs – It requires a high investment to start manufacturing automobiles making it very difficult for the appearance of new companies. Large players can easily enter new markets - The emergence of foreign competitors with the capital, required technologies and management skills began to undermine the market share of more local companies.
Substitutes
High number of Players in the industry – There are many brands with a vast range of different vehicles.
Different Means of Transportation – Depending on the geographic location and access to means of transportation, there are buses and trains among many other options
Industry Rivalry
Oligopoly Industry – Automakers understand that price-based competition could affect
returns and do not straightforwardly increase dimension in the market. Lately Price Competition occurred - Rebates, preferred financing and long-term warranties were strategies that helped collecting customers, although those strategies affect the profit margins for vehicle sales.
31
© Luís Verdasca GomesBuyers
Highly price sensitive – Even though customers are vulnerable to prices they have low bargaining power as they never purchase huge volumes of cars. Customers have low price determining power- If the products offered by certain automakers are not as interesting, customers began looking for alternatives.
Suppliers
Highly Fragmented Business - The automobile supply comprises many suppliers relying on one or two automakers to buy a majority of their products. Highly reliant on demand - Suppliers are extremely susceptible to the demands and requirements of the automobile manufacturer and hold very little power.
3.1.4. Global Supply, Demand and Production
Divided into two segments, the automotive industry is composed by two types of vehicles, passenger cars and commercial vehicles. One can have further insight about the top-ranking countries in new passenger and commercial vehicle registrations. Having a 4-year period (2004-2007) with strong and stable growth in the global automobile sales followed by an sudden decrease in sales and followed by a subsequent upturn came to provide evidence that there is a directly association between the automotive industry and the economic cycles.
3.1.4.1. Supply
On the global production side, passenger cars are mostly produced in EU, China, Japan and NAFTA those four regions account for a total concentration of over 70%. On the other hand, the production of commercial vehicles occurs mostly in China and NAFTA accounting for almost 60% of total production, followed by the European Union with 9,9%.
9,4% 11,9% 24,2% 26,2% 7,0% 5,1% 4,3% 4,2% 3,5% 2,9% 1,3% NAFTA Japan China EU S. Korea India Others Brazil Asia-Others Russia 6,2% 9,9% 19,5% 39,0% 4,6% 4,4% 4,3% 4,0% 2,7% 2,2% 2,0% 1,3% Japan EU China NAFTA Thailand India Brazil Others Turkey South Korea Asia-Others Europe- Others
Chart 3 New Passenger Car Production Worldwide (%Share) – Year (2011) Source: Economic Report ACEA - 2011
Chart 4 New Commercial Car Production worldwide (% share) – Year 2011. Source: ACEA Economic Report 2011