ABSTRACT
Title: The Impact of Different Packaging Elements on the Purchase Intent for Olive Oil Author: Rita Avelar Morgado Mourinho Dias
To strive and survive in today’s competitive, fast-paced and increasingly challenging environment, manufacturers are being forced to find new ways to attract consumers to buy their own products - instead of competing ones. This is especially true in the fast-moving consumer goods industry.
This dissertation aims at exploring the impact of several packaging elements, both on consumers’ purchase intent, as well as on the perceived quality they consider the products to have. Moreover, it looks at the possible relationship between perceived quality and purchase intent and how the first influences the latter.
This was tested for olive oil, a product category with a singular importance in the Portuguese market. Quantitative data was collected among Portuguese consumers through an online questionnaire.
Results have shown that all the elements studied have an impact on both purchase intent and perceived quality. In some situations, the impact was in accordance with what was suggested in the literature and, in other situations, the opposite impact was verified. Furthermore, the findings suggest that there is a positive linear regression between perceived quality and purchase intent; as the first increases, the latter also increases for that same product.
SUMÁRIO
Título: The Impact of Different Packaging Elements on the Purchase Intent for Olive Oil Autor: Rita Avelar Morgado Mourinho Dias
Para sobreviver e prosperar num ambiente cada vez mais competitivo e de constante mudança, os fabricantes procuram novas formas de atrair consumidores para comprar os seus produtos, em detrimento dos produtos concorrentes.
Esta dissertação procura perceber qual o impacto de diversos elementos das embalagens dos produtos na intenção de compra dos consumidores, bem como na sua perceção de qualidade relativamente a esses produtos. Para além disto, explora uma possível relação entre a perceção de qualidade e a intenção de compra, tentando perceber como é que a primeira influencia a segunda.
Este estudo foi aplicado à categoria alimentar do azeite, um produto com uma importância singular no mercado português. Os dados quantitativos foram recolhidos junto de consumidores portugueses, através de um inquérito online.
Os resultados mostram que os elementos estudados têm um impacto tanto na intenção de compra como na perceção de qualidade dos consumidores. Em certas situações, este impacto correspondeu às conclusões de estudos anteriores e, noutras situações, verificou-se um impacto inverso ao sugerido. Adicionalmente, as conclusões sugerem que há uma relação linear positiva entre a perceção de qualidade e a intenção de compra; à medida que a primeira aumenta, o mesmo acontece com a segunda.
ACKNOWLEDGEMENTS
First I would like to show my never-ending gratitude to my parents and my brother. Without them, without their support, love and understanding none of this would have been possible. Thank you for always being my safe harbour.
To my supervisor, Professor Paulo Romeiro, thank you for your advice and help throughout this entire process. Thank you for helping me find the right direction for my dissertation.
To all my family and friends, thank you for being there through this stressful and doubtful, yet crucial part of my academic path. Thank you for your help and support at all times.
Lastly, I would like to show my appreciation for everyone who took some of their personal time to answer my questionnaire. Thank you for making the analysis of this dissertation possible.
TABLE OF CONTENTS ABSTRACT ... II SUMÁRIO ... III ACKNOWLEDGEMENTS ... IV TABLE OF CONTENTS ... V TABLE OF FIGURES ... VII TABLE OF TABLES ... VIII GLOSSARY ... IX CHAPTER 1: INTRODUCTION ... 1 1.1BACKGROUND ... 1 1.2PROBLEM STATEMENT ... 2 1.3RELEVANCE ... 3 1.4RESEARCH METHODS ... 4 1.5DISSERTATION OUTLINE ... 4
CHAPTER 2: LITERATURE REVIEW ... 5
2.1.PACKAGING AND PURCHASE INTENTION ... 5
2.1.1. Label Claims ... 6 2.1.2. Design ... 8 2.1.3. Brand ... 11 2.2.PERCEIVED QUALITY ... 12 2.3.OLIVE OIL IN PORTUGAL ... 13 CHAPTER 3: METHODOLOGY ... 15 3.1RESEARCH APPROACH ... 15 3.2SECONDARY DATA ... 15 3.3PRIMARY DATA ... 16 3.3.1 Data Collection ... 16 3.3.2 Indicators ... 18 3.3.3 Data Analysis ... 19
CHAPTER 4: RESULTS AND DISCUSSION ... 21
4.1SAMPLE CHARACTERIZATION ... 21
4.2RELIABILITY ANALYSIS ... 21
4.3DESCRIPTIVE STATISTICS ... 22
4.4IN-DEPTH ANALYSIS ... 23
4.4.1 The Impact of Packaging Elements on Purchase Intent ... 23
4.4.2 The Impact of Packaging Elements on Perceived Quality ... 26
4.4.3 The Relation between Purchase Intent and Perceived Quality ... 30
CHAPTER 5: CONCLUSIONS AND LIMITATIONS ... 32
5.1MAIN FINDINGS &CONCLUSIONS ... 32
5.3LIMITATIONS AND FURTHER RESEARCH ... 35
REFERENCE LIST ... I
APPENDICES ... X
APPENDIX 1:QUESTIONNAIRE (PORTUGUESE, ORIGINAL VERSION) ... X
APPENDIX 2:QUESTIONNAIRE (ENGLISH VERSION) ... XVI
APPENDIX 3:SAMPLE CHARACTERIZATION ... XXII
APPENDIX 4:LINEAR REGRESSION (SPSSOUTPUT) ... XXIII
TABLE OF FIGURES
FIGURE 1: SURVEY IMAGES FOR LABEL ELEMENTS; A1 TO A5 (LEFT TO RIGHT) ... 17
TABLE OF TABLES
TABLE 1:HYPOTHESES AND THEIR IMPACT ON PURCHASE INTENT AND PERCEIVED QUALITY ... 16
TABLE 2:SURVEY CONSTRUCTS ... 19
TABLE 3: RELIABILITY MEASUREMENTS OF PERCEIVED QUALITY PER PACKAGING ELEMENT ... 22
TABLE 4: DESCRIPTIVE STATISTICS FOR PURCHASE INTENT AND PERCEIVED QUALITY ... 23
TABLE 5: PAIRED SAMPLES STATISTICS FOR A1 AND A2 (PURCHASE INTENT) ... 23
TABLE 6:PAIRED SAMPLES TEST FOR A1 AND A2 (PURCHASE INTENT) ... 24
TABLE 7:PAIRED SAMPLES STATISTICS FOR A3 AND A4 (PURCHASE INTENT) ... 24
TABLE 8: PAIRED SAMPLES TEST FOR A3 AND A4 (PURCHASE INTENT) ... 24
TABLE 9:PAIRED SAMPLES STATISTICS FOR A1 AND A5 (PURCHASE INTENT) ... 25
TABLE 10:PAIRED SAMPLES TEST FOR A1 AND A5 (PURCHASE INTENT) ... 25
TABLE 11: PAIRED SAMPLES STATISTICS FOR B1 AND B2 (PURCHASE INTENT) ... 25
TABLE 12: PAIRED SAMPLES TEST FOR B1 AND B2 (PURCHASE INTENT) ... 25
TABLE 13: PAIRED SAMPLES STATISTICS FOR B1 AND B3 (PURCHASE INTENT) ... 26
TABLE 14:PAIRED SAMPLES TEST FOR B1 AND B3 (PURCHASE INTENT) ... 26
TABLE 15: PAIRED SAMPLES STATISTICS FOR A1 AND A2 (PERCEIVED QUALITY) ... 27
TABLE 16:PAIRED SAMPLES TEST FOR A1 AND A2 (PERCEIVED QUALITY) ... 27
TABLE 17:PAIRED SAMPLES STATISTICS FOR A3 AND A4 (PERCEIVED QUALITY) ... 27
TABLE 18:PAIRED SAMPLES TEST FOR A3 AND A4 (PERCEIVED QUALITY) ... 27
TABLE 19:PAIRED SAMPLES STATISTICS FOR A1 AND A5 (PERCEIVED QUALITY) ... 28
TABLE 20:PAIRED SAMPLES TEST FOR A1 AND A5 (PERCEIVED QUALITY) ... 28
TABLE 21:PAIRED SAMPLES STATISTICS FOR B1 AND B2 (PERCEIVED QUALITY) ... 28
TABLE 22: PAIRED SAMPLES TEST FOR B1 AND B2 (PERCEIVED QUALITY) ... 29
TABLE 23:PAIRED SAMPLES STATISTICS FOR B1 AND B3 (PERCEIVED QUALITY) ... 29
TABLE 24:PAIRED SAMPLES TEST FOR B1 AND B3 (PERCEIVED QUALITY) ... 29
TABLE 25:COEFFICIENTS FOR LINEAR REGRESSION (H5) ... 30
GLOSSARY
Purchase Intent (PI)
Perceived Quality (PQ)
Extra Virgin Olive Oil (EVOO)
Transgenic: Containing genetic material artificially transferred from another species
Vegetable Fats: Category of food products that includes olive oil, cooking/vegetable oils and margarine
CHAPTER 1: INTRODUCTION
1.1 Background
Globalization, along with so many other developments and events, has impacted and keeps impacting the world in a monumental way, altering people’s way of living, relating, thinking and consequently, their consumption patterns. Consumers’ preferences and the way they make decisions has suffered dramatic changes, creating a new challenge for retailers. Consumers search for high quality products but at lower prices. On the one hand, there are more product alternatives than ever before, however consumers seem to be constantly searching for more alternatives. On the other hand, from a retailers’ standpoint, they are repeatedly struggling to differentiate from the competition despite constant investment in their product portfolio (Prahalad and Ramaswamy 2004). Understanding how consumers perceive the subjective entity of products, as presented through communication elements in the package, is fundamental to influence choice, which is the key to success for many food products marketing strategies (Silayoi and Speece 2007).
Previous studies have demonstrated that attributes related to product package, label information and other extrinsic factors, such as price, play an important role in the choice process for food products and can influence purchase and consumption (Delgado, Gómez-Rico, and Guinard 2013; Guerrero et al. 2000; Plessis and Rand 2012; Silayoi and Speece 2007).
Packaging represents one of the first contacts between consumers and the product, becoming a critical factor in the consumer decision-making process, as it communicates to consumers at the moment of purchase (Carneiro et al. 2005; Kobayashi and Benassi 2015). Consumers are constantly confronted with a wide variety of product information, supplied through packaging, branding, advertising and other channels (Kobayashi and Benassi 2015). Each of these elements would require an in-depth study to fully understand them, but, for the purpose of this dissertation, only elements related to label claims and design, as well as container design will be considered. This assessment was conducted on the olive oil product category, one deeply connected with Portugal and the Portuguese roots. It is also a mass consumption product among Portuguese consumers with a large variety of alternatives being offered in the market. Previous studies in the same field have been conducted on coffee and olive oil packages, supporting the decision of choosing olive oil as the focus product for this study.
From ancient times, olive oil has been used not only for cooking, but also as a medicine, perfume, balsam, gas and for lighting. It represents one of the biggest identity symbols of the
Mediterranean countries, including Portugal. Moreover, the olive tree has a very strong symbolism, representing peace, wisdom and glory (Sobral 2016).
It was disregarded for several years, both due to the emergence of different oils, and because of a cultural shift in which there was a rejection of everything that was traditional, including the previously mentioned multitude of uses for olive oil in the household; recently, however, Portuguese consumers have recovered the pleasure given by olive oil (Sobral 2016).
This is a market that has been growing significantly (17% increase in value in 2015 when compared to the previous year, accounting for over 145 million €) (Nielsen 2015) and its importance has been undergoing some critical changes as well. During the last few years, more and higher quality olive oil has been produced and consumers’ taste has become more exquisite regarding this product (Sobral 2016). It has gone from a commodity product to a gourmet one, with new varieties within the product category appearing in the market at a voracious rhythm, making this a category worth studying.
People are spending more money than before but buying even less olive oil than they did in the previous years (Nielsen 2015). Is this only because it has become more expensive or are people really shifting their choices towards better quality and less quantity?
1.2 Problem Statement
The goal of this research is to understand how different packaging elements and characteristics related to the label and the container of olive oil products affect the purchase intent of Portuguese consumers for this product. Understanding what is the direct impact of these elements on purchase intent and, besides this, what is their effect on perceived quality and, consequently, on purchase intent as well, define the main objectives of this study. Essentially, the problem statement of this research can be summarized as:
Understanding the impact of different packaging elements on the purchase intentions of Portuguese consumers for olive oil products.
The following research questions substantiate this problem statement.
RQ1: What packaging elements influence the purchase intent for olive oil?
The primary goal of this research is to answer this question, understanding if and what packaging elements affect the purchase intent for olive oil. However, as previously mentioned, it is not possible to study every element that could possibly have an impact on purchase intent.
Only some categories of elements will be taken into consideration and, as such, this research question can be divided into the following sub-questions:
RQ1a: What label claims influence the purchase intent for olive oil?
RQ1b: What label design elements influence the purchase intent for olive oil?
RQ1c: What container design elements influence the purchase intent for olive oil?
Besides understanding the impact of the packaging elements in the purchase intent for olive oil, this research also aims to understand if those elements have an effect on the perceived quality of the products and, consequently, if this perceived quality affects the purchase intent for these products.
RQ2: Do these packaging elements influence the perceived quality of olive oil?
Just as in the previous research question, this one can be divided into the following set of sub-questions:
RQ2a: What label claims influence the perceived quality for olive oil?
RQ2b: What label design elements influence the perceived quality for olive oil?
RQ2c: What container design elements influence the perceived quality for olive oil?
1.3 Relevance
Even though some similar studies have already been conducted in the past, there is no study for the impact of packaging elements on the purchase intents of consumers for the category of olive oil in the Portuguese market.
It is estimated that 73% of the purchase decisions are made at the point of sale (Connolly and Davison 1996), which makes package a critical factor in the consumer decision-making process, as it communicates to the consumers at the moment of purchase (Carneiro et al. 2005) Thus, the fundamental purpose of this research is to understand which packaging elements the retailers and manufacturers should focus on when designing a package for an olive oil product. From the conclusions of this study, it will be possible to understand what are some of the most influential dimensions and elements that consumers pay attention to in a product’s package, thus better understanding what matters the most to them and what affects the most their decision-making process.
The fact that these elements can easily be controlled by the retailers and manufacturers, makes this a valuable study, providing the necessary tools and information on how to influence consumers’ purchase decisions.
1.4 Research methods
The research methods used for the present study are based on two different kinds of data: secondary data and primary data. Regarding the secondary data, several previous studies, articles and papers from different fields of study such as marketing, consumer behavior and brand management were taken into account when designing this study, both regarding their methodology and the results and conclusions obtained. Secondary data has the advantages of being easily accessible and relatively inexpensive, helping in the development of an approach to the problem and in the formulation of an appropriate research design by identifying the key variables to measure. It helps to interpret primary data with more insight and to validate qualitative research findings. On the other hand, sometimes secondary data has a limited relevance or accuracy regarding the problem at hand, making it not completely dependable. As for primary data – specific data originated by the researcher to solve the research problem (Malhotra 2010) – it was collected among Portuguese consumers of olive oil through an online survey and then statistically analyzed using IBM SPSS according to the objectives of the study. Using an online survey to collect primary data has the advantages of being a fast and cost efficient way, guaranteeing the respondents’ anonymity and making it easier to reach certain target groups. However, this method of data collection has the disadvantages of lacking control over the data collection environment as well a possibility of occurrence of technical problems.
1.5 Dissertation outline
The next chapter of this dissertation presents a literature review, outlining what has already been done in the past by other authors regarding this topic and outlining the hypothesis that will guide this study. This is followed by a methodology chapter, explaining all the research techniques used to obtain the necessary data as well as the data analysis techniques used to answer the hypotheses. All the relevant information regarding the questionnaire and its constructs will also be presented in this chapter. Following this, there is a chapter where all the results of the questionnaire will be presented and analyzed (both generally and in-depth) and, to conclude, there is a final chapter dedicated to the general conclusions and implications of the present study and its results, as well as some limitations and further research opportunities in this field of study.
CHAPTER 2: LITERATURE REVIEW
This chapter will present the theoretical framework and existing empirical evidence for the key topics of this dissertation, based in numerous studies, from several academic journals and publications. The hypotheses behind this dissertation were extrapolated from these studies and will also be presented in this chapter. The first part of this review focuses on packaging, exploring its different elements, as well as its impact on consumers’ purchase intent. This is followed by a perceived quality topic. Lastly, this chapter ends with a section dedicated to the olive oil category in the Portuguese market.
2.1. Packaging and Purchase Intention
Packaging plays a crucial role in the consumers’ decision-making process regarding the purchase of food products - such as olive oil - and several of its elements can be studied. Previous research shows that, while the selection and initial purchase of olive oil is expected to be influenced mostly by non-sensory factors, such as convenience, price, branding or demographics (Jaeger 2006); the sensory factors tend to play a more significant role after the product has been purchased at least once, affecting mostly the repeated purchase (Delgado and Guinard 2011; Santosa and Guinard 2011). Companies should try to understand consumers’ preferences, as well as their perceptions of sensory and non-sensory characteristics of food, to ensure product success (Moskowitz and Hartmann 2008; Torres-Moreno et al. 2012; Tuorila and Monteleone 2009). In this work, the focus will be put on elements related to the label’s design and its claims, as well as some container design elements, such as transparency and the existence of a secondary packaging.
Purchase intention has been defined by Wu, Yeh, and Hsiao (2011) as the possibility that a consumer will plan to or will be willing to purchase a certain product or service in the future. It is a crucial measurement, both academically and managerially, as it represents a step that precedes a concrete buying behavior (de Magistris and Gracia 2008). Consumers’ intention to purchase depends greatly on the degree to which they expect the product to satisfy their expectations about its use (Kupiec and Revell 2001), besides also depending on price, concept, positioning, promotions, advertising, package information, consumer awareness, nutritional characteristics among other factors (Garber, Hyatt, and Starr 2003; Lawless and Heymann 2010).
2.1.1. Label Claims
Consumers’ food purchase behavior and their perceptions of the products appear to be greatly influenced by the product’s label, which, in turn, is strongly influenced by the consumers’ label knowledge and understanding, namely in terms of the information displayed and of the information obtained through label claims, as well as previous experiences with the product (Rozin, Pelchat, and Fallon 1986). Consequently, these perceptions affect consumers’ purchase intentions and are advantageous to encourage repurchasing intention, as suggested by Cranage, Conklin, and Lambert (2004). It has also been found that the influence of label claims on consumers’ acceptability and purchase intention is product-dependent (Baixauli et al. 2008; Fillion and Arazi 2002; Di Monaco, Ollila, and Tuorila 2005).
The study conducted by Samant and Seo (2016) provides empirical evidence that a higher visual attention paid to labels may translate into a positive purchase behavior (higher purchase intent, higher overall liking and higher trust in the product). A theoretical framework developed by Grunert and Wills (2007) demonstrates that individual interest and background knowledge of label claims motivate consumers to look out for these claims while buying food products. The more consumers are exposed to label claims, the higher the chances of the information actually being “perceived” by them. The perception leads not only to “understanding”, indicating that consumers attach meaning to the information being perceived, but also “liking” the label claims, meaning that they find them useful and easy to comprehend. Subsequently, the understanding and liking of the label claims may be “used” in making choices with respect to product evaluation and purchase behavior. Hence, based on previous findings, there seems to be a possibility of increasing both consumer acceptability and purchase intentions by increasing the understanding of product labels by, for instance, introducing label claims that consumers are more familiarized with (Carneiro et al. 2005; Gifford and Bernard 2011; Grunert and Wills 2007; Lenhart et al. 2008; Van Wezemael et al. 2012).
Labels may include information about brand, descriptive food name, health benefits, origin, production method, nutritional qualities and ethics. These elements are part of the constructs that will be further analyzed in the present study.
There is a specific class of product properties, the “credence attributes”, that include information regarding ethics, trust, health, organic, production method and nutritional value among others (Darby and Karni 1973; Fernqvist and Ekelund 2014). It was found that providing label information in the form of these claims enhanced consumers’ product knowledge, resulting in higher product acceptability and purchase intentions in contrast to situations when no such information was provided (Bower, Saadat, and Whitten 2003; Cranage et al. 2004;
Gifford and Bernard 2011; Grunert 1997). For olive oil, nutritional properties depend mainly on the anti-oxidant content (phenolic compounds and tocopherols) and fatty acid composition (Bendini et al. 2007; Harwood and Aparicio 2000; Servili and Montedoro 2002). In this regard, labeling is important because it may show nutritional content or may suggest a particular benefit to attract consumers (Ares and Deliza 2010; Bialkova and van Trijp 2010). Thus, an hypothesis can be formulated for the effect of credence attributes:
H1a: Consumers have a higher purchase intent for a product with a credence claim than
for one without it.
In Portugal, the inclusion of a nutritional values table in the food products label is required by law and, as such, its influence towards purchase intent does not need to be tested.
Ethical information has been found to vary with personal interests, demographics, and, most importantly, environmental concerns (Cannoosamy, Pugo-Gunsam, and Jeewon 2014; Davies, Titterington, and Cochrane 1995). Consumers who show preference for food products associated with ethic-related claims are those genuinely concerned with environmental sustainability. However, studies have also shown that there is a gap between consumers’ environmental concerns and their actual purchases of sustainable products (Grunert, Hieke, and Wills 2014), meaning that consumers may have environmental concerns, but that may not directly affect their purchase decisions. According to Wandel and Bugge (1997) who evaluated purchase priorities of Norwegian consumers for meat products, price might be a major reason why only a small segment of consumers consider environmental aspects when making purchase decisions. Consumers inability to completely understand the significance or meaning of environment-related label claims might be another reason for this attitude. From all this information, it has been decided that ethic-related claims will not be integrated in this study, as empirical evidence from previous studies shows that there is a gap between consumers’ concerns regarding these issues and their actual purchase behavior.
Lenhart et al. (2008) found that label information regarding production method or technology is not always well accepted by consumers, who see such information as ‘‘too technical”. Their somewhat limited understanding resulted in low purchase intentions for products with such claims. In another study by Carneiro et al. (2005), purchase intentions were found to be lessened for soybean oil labeled with a ‘‘transgenic” claim compared to soybean oil without such a claim, mainly because consumers did not completely understand the significance of the claim. As such, production method information will not be included in the label claims that will be studied in this work.
Regarding the information about product’s origin, consumers have shown a greater preference for locally-manufactured food products rather than for imported food products (Hoffmann 2000), which shows that information regarding the region of origin of a product affects consumers’ acceptability of it (Caporale et al. 2006). In a study conducted among Northern California consumers, region of origin has been identified as a critical factor influencing consumers’ purchase of olive oil (Delgado and Guinard 2011; Santosa and Guinard 2011). In the present study, Italy will be used as the comparison country, as it is another Mediterranean country with a large consumption and production of olive oil. Thus, the following hypothesis can be formulated:
H1b: Consumers have a higher purchase intent for a Portuguese product than for an
Italian product.
Delgado et al. (2013) also included a blind tasting in their study, in which a particular segment of consumers showed a preference for 5 specific oils that shared a similar sensory profile, had a similar level of acidity, and were not very bitter or pungent. The preferences of this segment allowed the researchers to conclude that these were probably relatively ‘new’ consumers of EVOO who had not previously been exposed to these attributes in EVOO and as a consequence, did not like the other oils in the set (which they found too bitter or pungent).
2.1.2. Design
Several studies have sought to determine the relationships among design perceived typicality, aesthetic appreciation, and purchase intent.
The degree of perceived beauty of a product is based on the visual aspects inducing an hedonic response on the consumer (Charters 2006; Crilly, Moultrie, and Clarkson 2004; Holbrook 1980, 1986; Holbrook and Hirschman 1982; Veryzer 1993, 1995). In 1995, Bloch proposed a theoretical model of consumer response to product design and hypothesized that the aesthetic appreciation of a product positively impacts purchase intent. A considerable body of research also suggests that aesthetic appreciation is an important determinant of consumer preference, demonstrating the positive impact on product perceived value, and therefore on purchase intent, satisfaction, and loyalty (Bloch, Brunel, and Arnold 2003; Chitturi, Raghunathan, and Mahajan 2007, 2008; Creusen and Schoormans 2005; Creusen, Veryzer, and Schoormans 2010; Page and Herr 2002; Reimann et al. 2010; Rindova and Petkova 2007).
“Category-based visual codes” are the formal and graphic characteristics most frequently seen in a given category. They work as “category cues” for consumers and define a “dominant
graphic design” for the category in matters of package design (Celhay and Trinquecoste 2014; Dell’Era and Verganti 2007; Goode, Dahl, and Moreau 2013). When launching a new product into the market, companies have two choices for package designs: they can opt for keeping the existing codes for their product category and designing something similar to what is already in the market, or disrupting it and creating something new that breaks with these existing codes. Conforming has the advantage of reassuring consumers by giving them what they are familiar with (Erdem 1998; Heilman, Bowman, and Wright 2000; Milberg, Sinn, and Goodstein 2010; Miyazaki, Grewal, and Goodstein 2005), while breaking with the codes has distinct advantages as well: the brand becomes visually distinguishable from all others in the category, thus communicating - through its package graphic design - a distinct positioning of the product (Karjalainen 2001, 2007; Karjalainen and Snelders 2010; Krippendorff and Butter 1984; McCormack and Cagan 2004; Monö 1997; Orth and Malkewitz 2008; Pantin-Sohier 2009; Person et al. 2008). This stimulates consumer interest and curiosity, and ultimately the product gains in retail visibility (Garber, Hyatt, and Boya 2008; Schoormans and Robben 1997). Consumer expertise in the product category also has a moderating effect in the relationships between perceived typicality, aesthetic appreciation and purchase intent. The higher the consumer expertise, the weaker the positive impact of perceived typicality on aesthetic appreciation and purchase intent.
Previous literature on consumer behavior indicates that category-based visual codes are linked to concepts of family resemblance, perceived typicality, and cognitive category. Consumers with a need for reassurance tend to look for familiarity; while novelty seeking suggests a need for stimulation (Celhay and Trinquecoste 2014). Previous studies also state that some consumers’ tendency to prefer atypical designs can be explained by the importance they give to the appearance of products (Hekkert, Snelders, and van Wieringen 2003). For these authors, the more important product appearance is for the consumer, the more this consumer will have the tendency to place value on the originality of the design. Conversely, when the appearance of the product is not important, the consumer will tend to prefer a packaging that is familiar. Moreover, the level of perceived risk at the time of purchase also plays an essential role. Consumers are more apt to accept atypical packaging when the perceived risk for that product category is low (Celhay and Trinquecoste 2014).
Delgado et al. (2013), developed a study in Northern California to understand consumer liking, purchase intent and sensory and nutritional expectations for EVOO based on the products’ packaging and labeling. Elements such as the shape and material of the bottle, as well as the label design, including its colors and the pictures on it were found to be correlated to the overall
liking of the product. All of these elements are of high relevance in the study of olive oil packaging and their impact must be analyzed and correlated to further understand what consumers value in olive oil packages.
Label Design
Delgado et al. (2013) in their study about evaluation of olive oil bottles and labels concluded that liking the label design was significantly correlated to liking the pictures and the color of the label.
The study about coffee packages conducted by Kobayashi and Benassi (2015) revealed that, in general, the inclusion of photos depicting coffee cups foam, steam and coffee beans on the front panel were desirable characteristics of instant coffee packaging. This can be translated into the following hypothesis for olive oil:
H2: Consumers have a higher purchase intent for a product with a background picture
on the label than for a product without it.
Container Design
Besides the marketing perspective, the packaging of olive oil also influences the retention of product properties and quality and it is also a way to expand markets. The study from Kobayashi and Benassi (2015) regarding the impact of packaging characteristics on purchase intent for coffee packages showed that consumers’ criteria for purchase depended, among other factors, on the material of the package. For glass packaging, purchase intention depended more on price and increased with the use of what was determined in the study to be ‘modern shapes’, the ones allowing for better visualization, emphasizing the fact that transparency is an important criteria, as consumers want to be able to see the product inside the package (Kobayashi and Benassi 2015). As such, focusing on the transparency characteristic rather than on the material one, the following can be hypothesized for olive oil containers:
H3a: Consumers have a higher purchase intent for a product with a transparent
container than for one with an opaque container.
The material of the container and the conditions and length of storage are critical factors determining the shelf life of packaged olive oil (Kanavouras, Hernandez-Munoz, and Coutelieris 2006). In the study conducted by Delgado et al. (2013) about evaluation of bottles and labels of EVOO, the researchers concluded that liking the shape of the bottle was significantly correlated to liking the material of the bottle.
In the same study, Delgado et al. (2013) also found that liking the size of the bottle was not correlated to the overall liking of the bottle, which may be associated with the fact that consumers are using different types of olive oil for different purposes, such as cooking and seasoning, and are selecting the sizes accordingly (Santosa and Guinard 2011). Since it was found not to be correlated to the overall liking of the product, this aspect will not be tested in this analysis.
In the same study, when consumers were exposed to the olive oil by itself – without any packaging - they were only willing to pay less than $101 a bottle, but once they were exposed to the whole product in its package, they were willing to pay more. Previous research shows that packaging attractiveness is a critical factor when selecting olive oil (Krystallis and Ness 2003). Besides the container packaging, there is a possibility of incorporating a secondary packaging, producing a more sophisticated look. There are already products in the Portuguese market with a secondary package but the evidence does not immediately suggest if consumers have a higher purchase intention for these products and, therefore, are willing to pay a premium for them, or if they see the secondary packaging as something unnecessary. Thus, another question rises as an hypothesis:
H3b: Consumers have a higher purchase intent for a product with a secondary
packaging than for a product without it.
2.1.3. Brand
Previous research by Chaniotakis, Lymperopoulos, and Soureli (2010) shows that brand is considered a determining factor for olive oil preference. However, it is important to observe that brand itself does not define purchase intention. Conclusions from the study conducted by Kobayashi and Benassi (2015) about coffee packages showed that even a well-known brand was not appreciated by the focus group participants if they did not like the product’s shape, color, illustration, price and label information. Thus, it can be concluded that brand loyalty exists as long as the product package does not contain a set of undesired characteristics. Furthermore, the same study showed that, even though being a well-known brand was highlighted by the participants on the qualitative research, it was not considered a factor of greatest importance on purchase intention for most consumers.
1
Please note that this study was conducted in Northern California; this price is not applicable in the Portuguese market.
The study conducted by Delgado et al. (2013) also suggested that the relatively ‘new’ consumers of EVOO would most frequently choose among products based on the familiarity that they had with the brands.
In addition, it has been showed that consumers tend to give higher liking scores when the brand is shown and they are familiar with it than in blind conditions for the same product (Caporale et al. 2006; Guinard et al. 2000).
In this regard, and taking into consideration the conclusions mentioned above, the effect of branding on purchase intent and perceived quality will not be analyzed in this study.
2.2. Perceived Quality
Perceived quality is one of the key criteria for a product’s evaluation and it can be defined as a global assessment of the consumer’s judgement about a product’s overall excellence or superiority (Aaker and Jacobson 1994; Zeithaml 1988). The way consumers perceive brands and products is a key determinant of long-term business-consumer relationships (Fournier 1998). Thus, building strong perceptions is a top priority for many firms today.
Product packaging represents an important factor contributing to product differentiation and competitive advantage (Rundh 2009). It is presented at the crucial moment when consumers are making the buying decision (Ampuero and Vila 2006), calling attention to the product and influencing the consumer purchase process (Löfgren, Witell, and Gustafsson 2008; Vazquez, Bruce, and Studd 2003). As such, if we take into account the previous assumptions, the following can be hypothesized for perceived quality:
H4: Packaging elements will have an impact on consumers’ perceived quality regarding
the product.
H4a: Perceived quality is higher for a product with a credence claim on the label
than for a product without it.
H4b: Perceived quality is higher for a Portuguese product than for an Italian
product.
H4c: Perceived quality is higher for a product with a background picture on the
label than for a product without it.
H4d: Perceived quality is higher for a product with a transparent container than for
one with an opaque container.
H4e: Perceived quality is higher for a product with a secondary packaging than for
The perceived quality of products and services is central to the theory that strong brands add value to consumers’ purchase evaluation (Low and Lamb 2000), increasing the company’s power to capture consumer preference and loyalty. Previous research shows that quality endorses many of the product’s features and attributes that are responsible for satisfying the user’s needs (Méndez, Oubiña, and Rubio 2008). Quality has such a strong effect on consumers that it influences their buying decisions and behavior and, consequently, their purchase intentions (Cronin, Brady, and Hult 2000). Monroe and Krishnan (1985), using Monroe's (1979) conceptualization of perceived value, provided a model relating price, perceived quality, perceived sacrifice, perceived value and willingness to buy. In this model, they suggested that higher prices lead to a higher perceived quality and consequently to a greater willingness to buy. Sethuraman and Cole (1997) also found out that perceived quality explains a considerable portion of the variance in the price premium consumers are willing to pay.
Prior literature has examined product quality as an antecedent of customer behavioral intention (Tsiotsou 2006) and product quality strongly influences consumer decision-making (Klein, Ettenson, and Morris 1998; Knight 1999). Research also shows that consumers make purchase decisions based on the quality signals that they experience (Iyer and Kuksov 2010), and consumer-perceived product quality influences attitude and purchase intent (Lin, Marshall, and Dawson 2009). Thus, it can be hypothesized that:
H5: The higher (lower) the perceived quality of the product, the higher (lower) the
purchase intent for that same product.
If a product meets or exceeds the consumer’s quality expectations, it will strongly motivate repurchase behavior and inhibit switching behavior (Deng et al. 2010).
2.3. Olive Oil in Portugal
According to the results presented by Nielsen for the year 2015, Portuguese consumers went grocery shopping more times than in 2014 (+1,7%) and spent more money in these shopping sprees (3% increase, with a total average of 2.519€ per household).
Among all food product categories, vegetable fats increased 4% in 2015 when compared to the previous year, with a total value of 293 million €. However, olive oil was the only product with a positive growth in value, cooking oils and margarine both registered negative variations. The olive oil product category was the 11th biggest one in value in the Portuguese market in 2015 (145 million €), representing a growth of 17% compared to the previous year. This growth was the 3rd biggest one across all food categories.
However, in volume, this market registered a decrease of 3%, selling a total of 37 million kilograms in 2015. These values suggest that consumers are buying less olive oil in terms of quantity but the value of these products is increasing, making them spend more money buying less quantity than before.
For the olive oil products, specifically, the virgin olive oil segment is growing while the extra virgin olive oil and the other olive oil categories are decreasing in importance.
The top 3 brands, both in value and volume, are Oliveira da Serra, Gallo and Serrata, representing 46% in value and 42% in volume, all together. Private labels, the ones owned by the retailers, competing directly with national brands, account for 32% in value and 35% in volume, representing an important category of products to be considered both in the development of this study and when analyzing the olive oil category in the Portuguese market. These private labels have impacted the retail environment in a crucial way, specially concerning the competition between the suppliers of national brands, who saw the entrance of new players in the market, offering a cheaper alternative to their products.
CHAPTER 3: METHODOLOGY
This chapter summarizes the methodology used in this study. It showcases the research strategy, the techniques used to collect the necessary data and the statistical tests that will be employed to test the hypotheses.
3.1 Research Approach
In order to achieve the goal of this study and answer the research questions formulated in chapter 1, different research design approaches were implemented throughout the entire process. Firstly, an exploratory design was conducted as it is a flexible and versatile approach, enabling the discovery of ideas and insights. This approach was used to determine the research topic and all the research questions and hypotheses associated with it, through the support and guidance of different sources of information such as academic publications and journals. After that, the research followed a descriptive design approach, commonly used to describe market characteristics and functions, after the formulation of specific hypotheses; here, this was done through a survey, as a way to better understand and describe the characteristics of the relevant consumers as well as determining their perceptions and assessments of the different product characteristics and attributes being tested.
3.2 Secondary Data
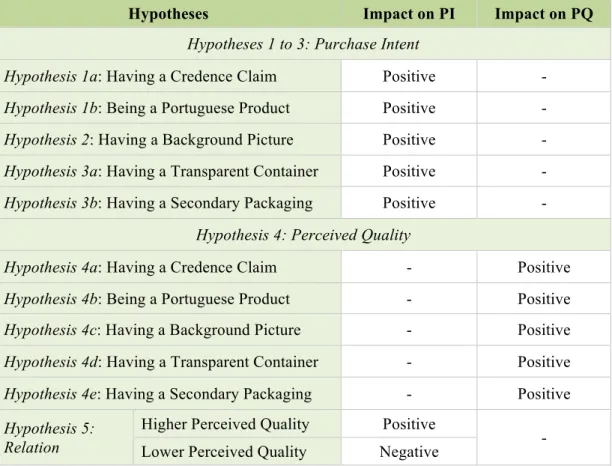
Numerous literature sources were considered while designing the present study to support it and guide the necessary data collection. This allowed for the formulation of several hypotheses (see chapter 2) which are summarized in the following table, for a more convenient reading. Their impact on either purchase intent or perceived quality is also presented in a simplified way for a better comprehension.
Hypotheses Impact on PI Impact on PQ Hypotheses 1 to 3: Purchase Intent
Hypothesis 1a: Having a Credence Claim Positive -
Hypothesis 1b: Being a Portuguese Product Positive -
Hypothesis 2: Having a Background Picture Positive -
Hypothesis 3a: Having a Transparent Container Positive -
Hypothesis 3b: Having a Secondary Packaging Positive -
Hypothesis 4: Perceived Quality
Hypothesis 4a: Having a Credence Claim - Positive
Hypothesis 4b: Being a Portuguese Product - Positive
Hypothesis 4c: Having a Background Picture - Positive
Hypothesis 4d: Having a Transparent Container - Positive
Hypothesis 4e: Having a Secondary Packaging - Positive
Hypothesis 5: Relation
Higher Perceived Quality Positive
- Lower Perceived Quality Negative
Table 1: Hypotheses and their Impact on Purchase Intent and Perceived Quality
3.3 Primary Data
3.3.1 Data Collection
An online questionnaire (appendices 1 and 2) was developed using Qualtrics and administered by email and social media to reach a large sample and to assure that randomization worked as effectively and efficiently as possible. The data collection through an online survey allows an efficient distribution to a large audience with small costs and in a short period of time. It gives the respondents higher convenience and flexibility, as there are no special or temporal restrictions to answer the survey. Additionally, Qualtrics tools have extensive features to customize the survey to the needs and objectives of the research, alongside with simple data entry and analysis (Evans and Mathur 2005). The questionnaire was available for 9 days, from the 22nd to the 30th of May, 2017. The screening questions ensured that the questionnaire was distributed exclusively to Portuguese consumers of olive oil, currently living in Portugal. A convenience sampling technique was used, as it is the most inexpensive and fastest method of sampling, efficiently reaching a large number of respondents, with a diverse demographic profile, who are relatively easy to find on the internet but are not only people known to the researcher (Malhotra 2010; Taylor 2017) The survey was conducted in Portuguese, the native language of the population being studied, in order to increase the respondents’ familiarity with
Variable Questions Authors
Purchase Intent 1 Dodds, Monroe, and Grewal (1991) Perceived Quality 4 Dodds, Monroe, and Grewal (1991)
Packaging Elements
Credence Claim 1 Gifford and Bernard (2011) Fernqvist and Ekelund (2014)
Product’s Origin 1 Hoffmann (2000)
Background Picture 1 Kobayashi and Benassi (2015)
Bottle Transparency 1 Delgado, Gómez-Rico, and Guinard (2013) Secondary Packaging 1 Delgado, Gómez-Rico, and Guinard (2013) Table 2: Survey Constructs
All constructs were measured through a seven-point Likert scale, to maintain the consistency across the study and to make the interpretation and analysis of the results comparable among all dimensions.
3.3.3 Data Analysis
The data collected through the Qualtrics survey was then exported to SPSS to be analyzed. The items were relabeled consistently and, when necessary, some variables were aggregated and new variables were created.
In order to statistically analyze the findings on this study, a set of statistical techniques were used.
Frequencies and descriptives were used to characterize the sample demographically and to contextualize the main variables of the study. The Cronbach’s Alpha measurement was used for the reliability analysis of the perceived quality construct.
For hypotheses1 through to 4, a set of paired-samples t-tests was conducted. As the objective was to study if there was a significant difference in the purchase intent and perceived quality for different pairs of packaging elements, this test was the appropriate one as it compares the means between two related groups on the same dependent variable.
The number of observations varied from hypothesis to hypothesis, as this test only takes into account the common observations between the two elements being compared. However, the total sample was big enough for this split to be done without compromising the reliability of the study and its conclusions.
For hypothesis 5, a linear regression was conducted to study the relation between perceived quality and purchase intent; this test is commonly used to try to predict the value of one
dependent variable (purchase intent) based on the value of another variable(s) (perceived quality). In other words, the objective was to assess whether perceived quality explained or not (part of) the purchase intent behavior.
For all the tests conducted, a confidence interval of 95% was adopted. Therefore, a p-value of 0,05 represented the decision-making point whether to accept or reject hypotheses.
CHAPTER 4: RESULTS AND DISCUSSION
4.1 Sample Characterization
A total of 1617 participants opened the survey and, out of this group, a total of 1094 complete responses were recorded, corresponding to a response rate of 67,66%. From these responses, 132 were eliminated through the screening questions, leaving a total of 962 responses that were considered valid for the analysis, representing a valid response rate of 59,49%.
The exclusion of respondents in the screening questions stage was based on the criteria that if they were either not Portuguese, not living in Portugal or stated that they are not consumers of olive oil, their insights would not be relevant for the present study.
The majority of the respondents were women (73,1%), below the age of 55 (94,2%), with a predominance of young respondents between the ages of 18 and 25 years old (56,3%) and mostly single (67,6%). Most respondents were either students (55,5%) or currently employed (40,1%), having completed or currently completing either a bachelor (49,8%) or a master degree (33%). Most respondents stated that they have a monthly income (after tax) below 2000€ (62,2%) and 20,8% of the respondents preferred not to share their income level information. Households were mostly composed by 3 (28,5%) or 4 people (34,4%) and 69,8% of the respondents are currently living in the big metropolitan areas of Lisbon and Oporto (for the complete results see appendix 3).
Despite the large number of respondents, the sample cannot be considered representative of the Portuguese population, as the quotas for several demographic categories are not balanced; mainly due to the employment of a convenience sampling technique.
4.2 Reliability Analysis
As the perceived quality construct had four items, its level of reliability needed to be checked. The Cronbach’s Alpha measurement was used to assess the internal validity and consistency of the construct. This measurement is commonly used when there are multiple Likert scale questions, as a way to determine if the scale is reliable.
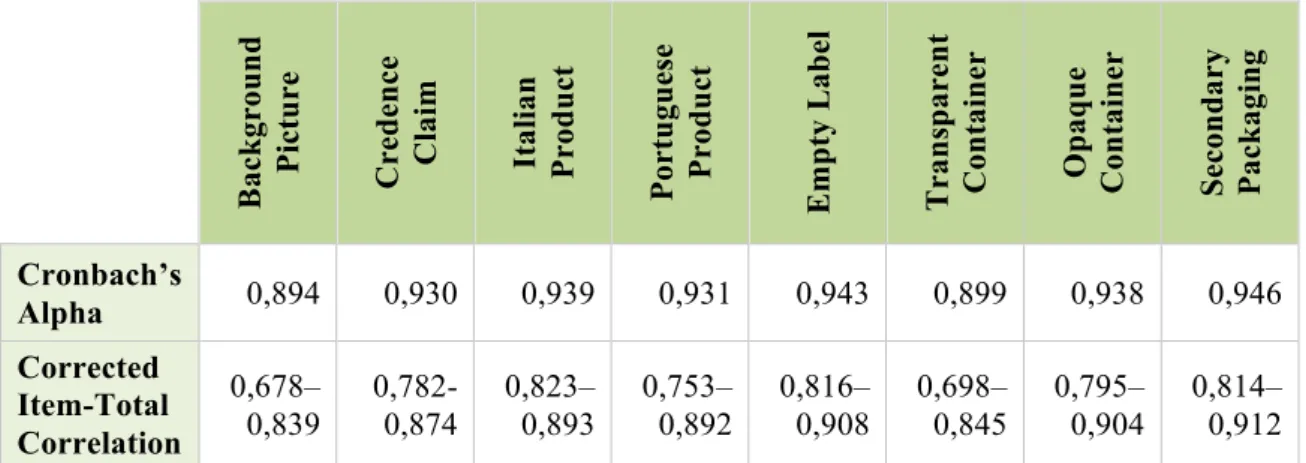
The following table presents the values for the Cronbach’s Alpha and for the corrected item-total correlation for the perceived quality construct per packaging element being tested. As respondents only answered questions regarding some of the elements, it was impossible to determine a unique Cronbach’s Alpha value for the perceived quality construct as a whole.
Ba c k g r o u n d Pi c tu r e Cr e d e n c e Cl a im It a li a n Pr o d u c t Po r tu g u e se Pr o d u c t Em p ty La b e l Tr a n sp a r e n t Co n ta in e r Op a q u e Co n ta in e r Se c o nda r y Pa c k a g in g Cronbach’s Alpha 0,894 0,930 0,939 0,931 0,943 0,899 0,938 0,946 Corrected Item-Total Correlation 0,678– 0,839 0,782-0,874 0,823– 0,893 0,753– 0,892 0,816– 0,908 0,698– 0,845 0,795– 0,904 0,814– 0,912 Table 3: Reliability Measurements of Perceived Quality per Packaging Element
According to George and Mallery (2003), values for the Cronbach’s Alpha below 0,5 are unacceptable, between 0,5 and 0,6 are poor, between 0,6 and 0,7 are questionable, between 0,7 and 0,8 acceptable, between 0,8 and 0,9 good, and above 0,9 they are excellent. The values obtained in this study are all above 0,890 which attests to a good, if not excellent, reliability of the scale used in the questionnaire for all the elements presented to the respondents, guaranteeing accuracy when analyzing the data. Such a result was expected, given that this scale had already been used in previous studies and, as such, its reliability had already been studied.
Furthermore, the values of the corrected item-total correlation appear to be acceptable for all elements since they are largely above 0,2 (Field 2009; Nunnally and Bernstein 1999).
For some of the packaging elements, the Cronbach’s Alpha value would increase by removing item 4 from the perceived quality construct. However, as this was a very small increase, all the items were kept as originally presented in the questionnaire.
4.3 Descriptive Statistics
As mentioned in the previous chapters, the constructs of purchase intent and perceived quality have been tested for different packaging elements. The following table shows the mean score for these constructs for each of the packaging elements.
N Mean Std. Deviation Purchase Intent Perceived Quality Purchase Intent Perceived Quality
Background Picture (A1) 962 4,54 4,67 1,657 1,158
Credence Claim (A2) 483 4,69 4,94 1,612 1,154
Italian Origin (A3) 809 3,80 4,66 1,741 1,161
Portuguese Origin (A4) 480 5,30 5,32 1,475 1,117
Empty Label (A5) 452 3,76 4,05 1,719 1,384
Transparent Container (B1) 962 2,20 3,04 1,497 1,326
Opaque Container (B2) 962 2,38 3,20 1,630 1,544
Secondary Packaging (B3) 962 2,89 3,71 1,548 1,441 Table 4: Descriptive Statistics for Purchase Intent and Perceived Quality
As the perceived quality construct had several items in it, a new variable was created for each element, composed by the mean results of the four items.
Purchase intent values are lower than perceived quality one for all elements which can be explained by the fact that people tend not to give their most truthful answer when asked about purchase intent or willingness to pay (Jaeger, Lusk, and McLaughlin 2007).
The packaging with the Portuguese origin label registered the highest value for both the purchase intent and the perceived quality, which can indicate that this really is a relevant element for consumers when carrying out a decision-making process regarding olive oil. Values for the container elements are lower than for label elements, which may be related to the images presented in the questionnaire, as these ones did not present any label, leading the respondents to trust them less than the other pictures which seemed more reliable, being closer to real products.
4.4 In-Depth Analysis
4.4.1 The Impact of Packaging Elements on Purchase Intent
H1a: Consumers have a higher purchase intent for a product with a credence claim than for
one without it.
Mean N Std. Deviation Std. Error Mean
A1 4,55 483 1,681 0,076
A2 4,69 483 1,612 0,073
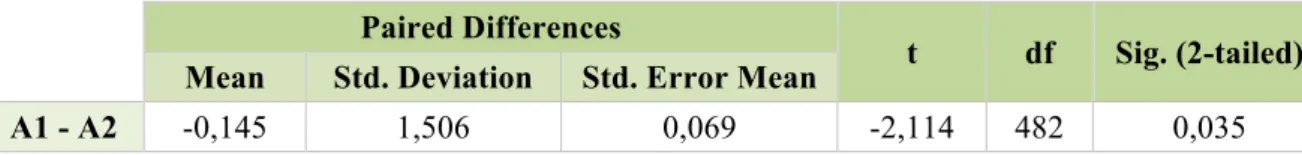
Paired Differences
t df Sig. (2-tailed) Mean Std. Deviation Std. Error Mean
A1 - A2 -0,145 1,506 0,069 -2,114 482 0,035
Table 6: Paired Samples Test for A1 and A2 (purchase intent)
A paired-samples t-test was conducted to compare the purchase intent of the respondents for a label with a credence claim on it (A2) and a label without it (A1). The test showed that there was a significant difference in the scores for the label without a claim (mean=4,55; SD=1,681) and for the label with a credence claim (mean=4,69; SD=1,612); t(482)=-2,114, p=0,035. These results suggest that having a credence claim really does have a positive effect on the consumers’ purchase intent for olive oil, thus validating the hypothesis.
H1b: Consumers have a higher purchase intent for a Portuguese product than for an Italian
product.
Mean N Std. Deviation Std. Error Mean
A3 3,85 172 1,723 0,131
A4 5,35 172 1,429 0,109
Table 7: Paired Samples Statistics for A3 and A4 (purchase intent)
Paired Differences
t df Sig. (2-tailed) Mean Std. Deviation Std. Error Mean
A3 - A4 -1,500 1,862 0,142 -10,564 171 0,000
Table 8: Paired Samples Test for A3 and A4 (purchase intent)
To compare the purchase intent of the respondents for an Italian product (A3) and a Portuguese one (A4), another paired-samples t-test was conducted. The test showed that there was a significant difference in the mean scores for the Italian product (mean=3,85; SD=1,723) and the Portuguese product (mean=5,35; SD=1,429); t(171)=-10,564, p=0,000.
It must be noted that the sample is this test was smaller than in the other ones, due to the design of the questionnaire, which made the sample of respondents who saw both A3 and A4 smaller than in the other cases.
These results suggest that being a Portuguese product really does have a positive effect on the consumers’ purchase intent for olive oil, when compared to an Italian product. However, it is not possible to conclude if this is applicable only for an Italian product specifically or if this conclusion can be extrapolated to products from other origins.
H2: Consumers have a higher purchase intent for a product with a background picture on the
label than for a product without it.
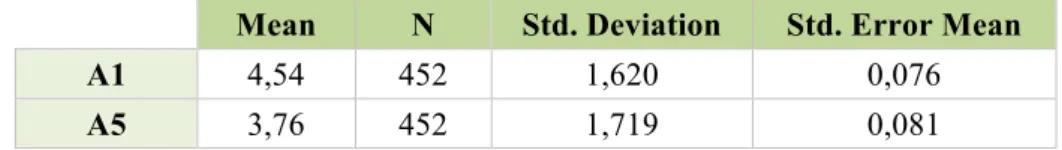
Mean N Std. Deviation Std. Error Mean
A1 4,54 452 1,620 0,076
A5 3,76 452 1,719 0,081
Table 9: Paired Samples Statistics for A1 and A5 (purchase intent)
Paired Differences
t df Sig. (2-tailed) Mean Std. Deviation Std. Error Mean
A1 - A5 0,785 1,507 0,071 11,080 451 0,000
Table 10: Paired Samples Test for A1 and A5 (purchase intent)
In this hypothesis, the comparison is made for the purchase intent of a product with a background picture on the label (A1) and one without any picture (A5). For this, another paired-samples t-test was conducted. The test showed that there was a significant difference in the scores for the label with the background picture (mean=4,54; SD=1,620) and the one without (mean=3,76; SD=1,719); t(451)=11,080, p=0,000.
These results suggest that having a background picture on the label of the product really has a positive effect on the consumers’ purchase intent for olive oil, validating the proposed hypothesis.
H3a: Consumers have a higher purchase intent for a product with a transparent container
than for one with an opaque container.
Mean N Std. Deviation Std. Error Mean
B1 2,20 962 1,497 0,048
B2 2,38 962 1,630 0,053
Table 11: Paired Samples Statistics for B1 and B2 (purchase intent)
Paired Differences
t df Sig. (2-tailed) Mean Std. Deviation Std. Error Mean
B1 - B2 -0,177 1,612 0,052 -3,400 961 0,001
Table 12: Paired Samples Test for B1 and B2 (purchase intent)
In this hypothesis, the objective was to understand the impact of the container’s transparency on purchase intent. A paired-samples t-test was conducted to compare the purchase intent for a
transparent container (B1) and for an opaque one (B2). The test showed that there was a significant difference in the scores for the transparent container (B1) (mean=2,20; SD=1,497) and for the opaque container (B2) (mean=2,38; SD=1,630); t(961)=-3,400, p=0,001.
Even though the results of the test show that there is a significant difference, the hypothesis formulated here is not validated, as the results suggest that the effect on purchase intent appears to be the opposite of what was proposed based on the literature; it is higher for an opaque container and not for a transparent one. As so, it is possible to conclude that the results suggest that having an opaque container has a positive effect on the consumers’ purchase intent for olive oil, when compared to having a transparent container.
H3b: Consumers have a higher purchase intent for a product with a secondary packaging than
for a product without it.
Mean N Std. Deviation Std. Error Mean
B1 2,20 962 1,497 0,048
B3 2,89 962 1,548 0,050
Table 13: Paired Samples Statistics for B1 and B3 (purchase intent)
Paired Differences
t df Sig. (2-tailed) Mean Std. Deviation Std. Error Mean
B1 - B3 -0,691 1,595 0,051 -13,441 961 0,000
Table 14: Paired Samples Test for B1 and B3 (purchase intent)
Lastly, another paired-samples t-test was conducted to compare the purchase intent of the respondents for a single container (B1) and for one with a secondary packaging (B3). The test showed that there was a significant difference in the scores for the single container (mean=2,20; SD=1,497) and for the one with a secondary packaging (mean=2,89; SD=1,548); t(961)=-13,441, p=0,000.
These results suggest that having a secondary packaging has a positive effect on the consumers’ purchase intent for olive oil, validating the hypothesis formulated.
4.4.2 The Impact of Packaging Elements on Perceived Quality
To test for the hypotheses within H4, a set of paired-samples t-tests were conducted for each relevant pair of elements being analyzed.
H4a: Perceived quality is higher for a product with a credence claim on the label than for a
product without it.
Mean N Std. Deviation Std. Error Mean
A1 4,6522 483 1,12087 0,05100
A2 4,9410 483 1,15360 0,05249
Table 15: Paired Samples Statistics for A1 and A2 (perceived quality)
Paired Differences
t df Sig. (2-tailed) Mean Std. Deviation Std. Error Mean
A1 - A2 -0,28882 0,91561 0,04166 -6,932 482 0,000 Table 16: Paired Samples Test for A1 and A2 (perceived quality)
Hypothesis 4a intended to compare the perceived quality for a label with a credence claim (A2) and one without it (A1). The test showed that there was a significant difference in the scores for the label without a credence claim (mean=4,6522; SD=1,12087) and for the label with that claim (mean=4,9410; SD=1,15360); t(482)=-6,932, p=0,000.
These results suggest that having a credence claim really has a positive impact on consumers’ perceived quality of olive oil, thus validating the hypothesis.
H4b: Perceived quality is higher for a Portuguese product than for an Italian product.
Mean N Std. Deviation Std. Error Mean
A3 4,5814 172 1,16976 0,08919
A4 5,3430 172 1,04227 0,07947
Table 17: Paired Samples Statistics for A3 and A4 (perceived quality)
Paired Differences
t df Sig. (2-tailed) Mean Std. Deviation Std. Error Mean
A3 - A4 -0,76163 1,12968 0,08614 -8,842 171 0,000 Table 18: Paired Samples Test for A3 and A4 (perceived quality)
Here the comparison was made between the perceived quality for an Italian product (A3) and a Portuguese one (A4). The test showed that there was a significant difference in the scores both products: Italian product (mean=4,5814; SD=1,16976); Portuguese product (mean=5,3430; SD=1,04227); t(171)=-8,842, p=0,000.
These results suggest that being a Portuguese product really has a positive impact on consumers’ perceived quality of olive oil. As it happened in the purchase intent hypothesis, this is the pair of elements where the difference in the means registered the highest value.
This validates the hypothesis formulated but, as for purchase intent, it is not possible to extrapolate this conclusion to other product origins based solely on this test.
H4c: Perceived quality is higher for a product with a background picture on the label than for
a product without it.
Mean N Std. Deviation Std. Error Mean
A1 4,7118 452 1,16135 0,05463
A5 4,0487 452 1,38435 0,06511
Table 19: Paired Samples Statistics for A1 and A5 (perceived quality)
Paired Differences
t df Sig. (2-tailed) Mean Std. Deviation Std. Error Mean
A1 - A5 0,66316 0,99948 0,04701 14,106 451 0,000 Table 20: Paired Samples Test for A1 and A5 (perceived quality)
In this hypothesis, a paired-samples t-test was conducted to compare the perceived quality for a label with a background picture (A1) and one without (A5). The test showed that there was a significant difference in the scores for the label with the background picture (mean=4,7118; SD=1,16135) and the label without it (mean=4,0487; SD=1,38435); t(451)=14,106, p=0,000. These results suggest that the perceived quality for olive oil is positively influenced by the presence of a background picture in the product’s label, validating the hypothesis formulated based on the literature.
H4d: Perceived quality is higher for a product with a transparent container than for one with
an opaque container.
Mean N Std. Deviation Std. Error Mean
B1 3,0429 962 1,32594 0,04275
B2 3,2048 962 1,54449 0,04980
Paired Differences
t df Sig. (2-tailed) Mean Std. Deviation Std. Error Mean
B1 - B2 -0,16190 1,43021 0,04611 -3,511 961 0,000 Table 22: Paired Samples Test for B1 and B2 (perceived quality)
This hypothesis intended to compare the perceived quality for a product with a transparent container (B1) and one with an opaque container (B2). The test showed that there was a significant difference in the scores for the transparent container (mean=3,0429; SD=1,32594) and the opaque container (mean=3,2048; SD=1,54449); t(961)=-3,511, p=0,000.
Similarly to what happened in the purchase intent hypothesis for this element, these results suggest that the transparency of the container really does have an effect on the perceived quality of olive oil however, this effect is the opposite of what was predicted. Perceived quality is higher for the opaque container than for the transparent one. As so, the hypothesis was not validated.
H4e: Perceived quality is higher for a product with a secondary packaging than for a product
without it.
Mean N Std. Deviation Std. Error Mean
B1 3,0429 962 1,32594 0,04275
B3 3,7082 962 1,44091 0,04646
Table 23: Paired Samples Statistics for B1 and B3 (perceived quality)
Paired Differences
t df Sig. (2-tailed) Mean Std. Deviation Std. Error Mean
B1 - B3 -0,66528 1,42652 0,04599 -14,465 961 0,000 Table 24: Paired Samples Test for B1 and B3 (perceived quality)
The test conducted here compares the perceived quality for a product with a secondary packaging (B3) and one without it (B1). The test showed that there was a significant difference in the scores for the single packaging (mean=3,0429; SD=1,32594) and the one with a secondary packaging (mean=3,7082; SD=1,44091); t(961)=-14,465, p=0,000.
These results suggest that having a secondary packaging really has an impact on consumers’ perceived quality of olive oil, thus validating the hypothesis.