Mestrado em Processos Químicos e Biológicos
SABIC’s Functional Forms Plant Mass Balance,
Production and Waste Analysis, and Sawdust Removal
and Elimination
Relatório de estágio apresentado para a obtenção do grau de Mestre em
Processos Químicos e Biológicos
Autor
Roberto Duarte Mota
Orientadores
Luís Miguel Moura Neves de Castro
Professor do Departamento de Engenharia Química e Biológica
Instituto Superior de Engenharia de Coimbra
Maria Nazaré Coelho Marques Pinheiro
Professor do Departamento de Engenharia Química e Biológica
Instituto Superior de Engenharia de Coimbra
Supervisores
Anco Fase
Senior Manager, Asset Operations Functional Forms Plant, SABIC
Gertjan de Beus
Global Specialist, Manufacturing Technology, SABIC
Lorena Cardador Pedraza
Quality Assurance Engineer Functional Forms, SABIC
Coimbra, abril, 2018
iii
ACKNOWLEDGMENTS
I am sincerely indebted to my supervisors Anco Fase, Gertjan de Beus, Lorena Cardador Pedraza for their invaluable guidance and constant support during the internship.
I am gratefully thankful to my teachers Dr. Luís Miguel Moura Neves de Castro and Dr. Maria Nazaré Coelho Marques Pinheiro for their supervision and patience during this internship report.
Also, some special thanks to all the staff of Functional Forms plant in Bergen op Zoom, for being always willing to help not only in my project but also in my integration in the professional environment and in the Dutch culture.
To the Erasmus coordinator of ISEC - Coimbra Institute of Engineering, Dr. Dália Pires, for her motivation and for addressing the necessary paperwork.
To all my friends I’ve met during my stay in The Netherlands, for all the support and friendship, introducing me and sharing the culture of their home country.
To all my friends who accompanied me through my academic life, for the valuable discussions, advices and their friendship.
To Cristiano Ronaldo and LeBron James for their inspiration to always be professional and seek to improve myself.
And last, but not least, to my family, specially my parents and brother, for their constant support, always investing in me and in my education, giving me the chance to pursue my academic and life goals, without them nothing would be possible.
v
RESUMO
No âmbito do Mestrado em Processos Químicos e Biológicos, o aluno tem a oportunidade de realizar um estágio para a obtenção do grau de Mestre. Este estágio foi realizado na Saudi Basic Industries Corp (SABIC) mais especificamente no departamento Functional Forms (Specialty Films & Sheets, SF & S, na época) na SABIC Innovative Plastics BV em Bergen op Zoom, Holanda, que é especializada na produção de folhas e filmes de policarbonato.
Este relatório de estágio teve como objetivo desenvolver uma ferramenta que permitisse calcular o balanço mássico de produção por lote, compatível para todos os produtos e todas as linhas. Foi também desenvolvida uma análise de produção das seis linhas nos anos 2014 e 2015 e posteriormente uma análise com maior incidência nos desperdícios produzidos nesses anos, tendo como objetivo determinar um conjunto de ações com o intuito de reduzir a produção dos mesmos. Outra vertente deste estágio consistiu em estudar o problema de produção de serradura nas estações de corte das linhas 1 e 4. A serradura produzida nas linhas de produção fica aderida às folhas de plástico ficando presa entre a pelicula de proteção (masking) e a folha, bem como à superfície. Esta limitação tem impedido a SABIC de progredir em vários mercados tais como o das aplicações óticas. Com o objetivo de prevenir a produção de serradura e/ou removê-la do produto foi desenvolvida uma investigação tendo como intuito estabelecer um conjunto de ações de minimização do problema e a sua priorização.
Ao longo deste trabalho foram desenvolvidas várias versões da ferramenta, em Microsoft® Excel, que permite realizar o balanço mássico por lote, chegando a uma versão final, a análise de produção dos anos 2014 e 2015, com maior foco nos desperdícios. A ferramenta teria que simular a realidade o máximo possível, teria que ser compatível com todas as linhas de produção, todas as matérias primas e todos os produtos finais, e, no limite, teria que apresentar uma margem de erro de 2%. Foram desenvolvidas duas versões com bases diferentes, uma tendo como base as dimensões do produto final e outra com base no tempo e velocidade da linha de produção. Por ser mais consistente com a operação real da linha, optou-se por se seguir a versão que tem por base o tempo e a velocidade da linha. A versão final obtida cumpre os objetivos propostos, tendo-se verificado quando testada que se manteve dentro do limite de erro máximo admissível.
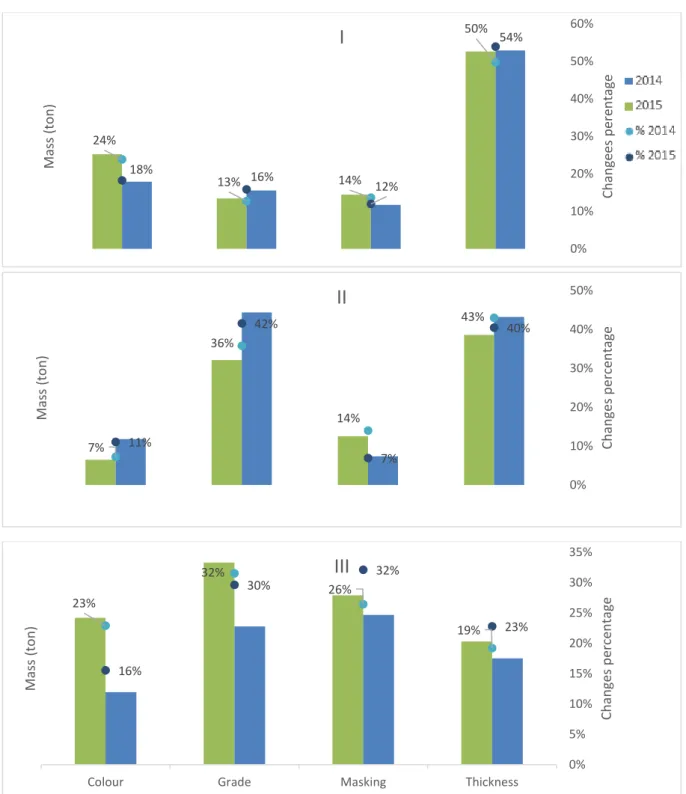
Com base na análise de produção dos anos 2014 e 2015, foi possível constatar que ambos os anos tiveram produções muito semelhantes apesar de no ano 2015 se ter produzido menos, sendo que em 2014 houve um rendimento de 83,6% e em 2015 de 83,2%. As linhas que mais produziram foram as linhas 1 e 4 sendo as que também obtiveram um maior rendimento. Também em 2014 foram produzidos mais desperdícios do que em 2015. Previsivelmente as linhas que mais contribuíram para estes valores foram também as linhas 1 e 4. Para realizar uma análise dos desperdícios estes foram divididos em várias categorias quanto à sua causa de produção: qualidade (defeitos no produto produzido), operacional (manutenção), falha (falhas técnicas), mudanças (mudanças de especificações do produto produzido), início de produção (arranque das linhas de produção) e outros (não aplicáveis nas restantes categorias). Concluiu-se que nas linhas 1, 2 e 4 grande parte dos desperdícios produzidos foram devido à categoria mudanças. Na linha número 3, uma linha de apoio e de testes, as causas de desperdícios estavam
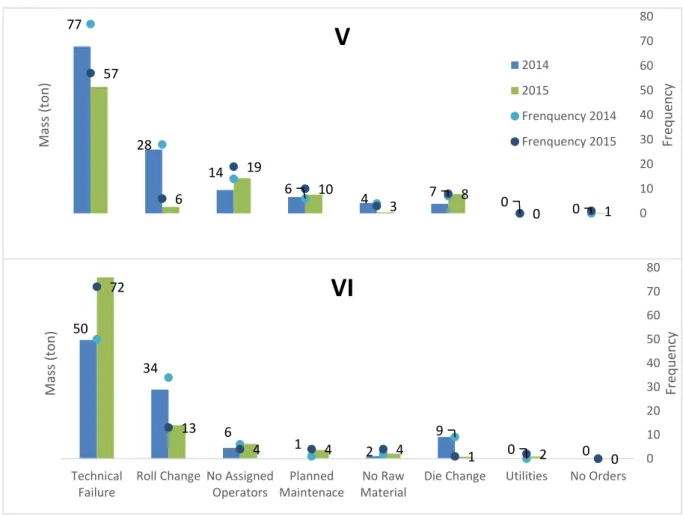
equilibradas. A linha 4 para além dos desperdícios causados por mudanças de produção teve como grande causador de desperdícios a categoria operacional, o que faz sentido, já que sendo a linha de produção de produtos óticos é necessária uma grande quantidade de material desperdiçado para limpar os rolos da mesma. Quanto às linhas de produção de filme, linhas 5 e 6, a categoria que mais se destaca é a linha de início de produção. Após estas conclusões realizou-se uma análise mais pormenorizada à categoria de mudanças nas linhas 1, 2, 3 e 4, sendo a mudança de espessura a que mais se destacou. Nas linhas de produção de filme analisou-se a categoria de começo de produção e a maior causa é devido a falhas técnicas. Durante esta análise foi possível verificar que a produção de corridas longas (long runs) ajuda a aumentar o rendimento e a minimizar o material desperdiçado produzido. Além disso, também foi determinado que pequenas mudanças na espessura da folha produzem menos desperdícios do que grandes diferenças na espessura a ser produzida. Não foi possível estabelecer uma correlação entre a quantidade de desperdícios produzida e algumas especificações, tal como uma cor ou espessura em específico. Por outro lado, maiores rendimentos foram obtidos pelas especificações que foram produzidas em maior quantidade ao longo do ano. Isso mostra que é essencial desenvolver um planeamento de produção sempre com o intuito de minimizar as mudanças entre os lotes. No final, uma pequena equipa, envolvendo departamentos de produção e vendas, foi formada e estabeleceu algumas ações para dar continuação a este projeto: racionalização de certas cores em todas as linhas; otimização do planeamento de blocos na linha 1; racionalização de certas larguras na linha 1 e 2; racionalização da largura de 1250 mm e acima de 5 mm de espessura e coletar informações detalhadas sobre as mudanças de espessura e cor na linha 1, 2, 3 e 4; e implementação de um projeto de limpeza dos rolos da linha 4 (já em curso).
O projeto de separação ou eliminação de serradura teve como início coletar informação do funcionamento da linha, informação de projetos anteriores e recolher feedback de várias partes envolvida na produção e na empresa de coating a jusante do processo produtivo. Organizou-se também duas reuniões de brainstorm, com a participação de várias partes envolvidas no processo de produção. A primeira teve como objetivo identificar quais seriam as causas mais prováveis para a produção de serradura e a segunda para propor possíveis soluções para essas causas e priorizá-las. A partir daí foram desenvolvidas várias ações com o intuito de alcançar as possíveis soluções. Essas ações abrangeram vários campos tanto na eliminação como na tentativa de remoção, nomeadamente a manutenção, design das serras, design da linha, configurações do processo e aplicação da masking. Após várias experiências com o intuito de fazer o despiste das diferentes causas de produção de serradura, concluiu-se que seriam necessários diferentes designs de serras para diferentes espessuras de folha produzida, serras essas que têm que estar em bom estado de conservação e disponíveis para serem armazenadas e instaladas de maneira simples. Para isso, desenvolveu-se uma tabela que designa o tipo de serra a ser usada para as diferentes espessuras produzidas, um protocolo com a empresa externa que fornece e faz a manutenção das serras usadas. Também se desenvolveu um novo método de armazenamento e registo das serras, e desenvolveu-se uma ferramenta que permite tirar amostras da serradura produzida aquando dos cortes durante a produção. Por fim, após a maioria
vii
destas medidas terem sido aplicadas, foi possível ver uma melhoria na qualidade dos cortes, principalmente na produção de serradura entre a folha e a masking. Por outro lado, ainda se verificou a existência de serradura sobre as folhas, apesar de ser em menor quantidade, sendo que a sua total separação requer uma pesquisa mais aprofundada, que poderá passar por um melhoramento do sistema de sucção instalado nas linhas.
Os dois projetos desenvolvidos durante o estágio irão permitir que a Functional Forms otimize a produção, quantificando as diferentes linhas de produção e reduzindo os resíduos. Também irá permitir melhorar a qualidade do produto final, prevenindo e separando a serradura do produto final, reduzindo as queixas de qualidade, permitindo que a SABIC cresça em diferentes mercados, nomeadamente no mercado de produtos com aplicações médicas, visores de aparelhos eletrónicos, visores de meios de transporte, já que estes requerem folhas de policarbonato com qualidade ótica.
Devido a razões de confidencialidade, por parte da SABIC, não foram divulgados valores das quantidades produzias no capítulo 3 (Production and Wastes Analysis). Assim como não foram divulgadas as empresas externas, com quais a SABIC tem parceria, nem as marcas dos materiais usados no capítulo 4 (Sawdust Removal and Elimination), no presente relatório de estágio.
ix
ABSTRACT
In the scope of the Masters in Chemical and Biological Processes, the student has the opportunity to undertake an internship to obtain the Master’s degree. This internship was performed at Saudi Basic Industries Corp (SABIC) more specifically for the Functional Forms plant (Specialty Films & Sheets, SF&S, at the time) in the SABIC Innovative Plastics B. V. in Bergen op Zoom, The Netherlands, which is specialized in the production of solid polycarbonate sheets and films.
This internship report aimed to develop a tool to calculate the mass production balance per batch, compatible for all products and all lines. An analysis of the production lines of Functional Forms plant was also developed, in the years 2014 and 2015, and later an analysis with greater incidence in the wastes produced during those years, aiming to determine a set of actions with the intention of reducing the production of wastes. Another aspect of this stage was the problem of the production of sawdust in the cutting stations on lines 1 and 4. The sawdust produced in the production lines sticks to the plastic sheets getting stuck on the surfaces and between the masking and the sheet. This phenomenon has prevented SABIC from progressing in several markets with optical applications. In order to prevent the production of sawdust and / or to remove it from the product, an investigation was developed aiming at establishing a set of actions and prioritizing them.
Throughout this work several versions of the tool were developed, in Microsoft® Excel, which allows to perform the mass balance by batch, arriving at a final version, and the production analysis of the years 2014 and 2015 and with greater focus on waste. The tool would have to simulate the reality as much as possible, it would have to be compatible with all production lines, all raw materials and all final products, with a margin of 2% error. Two versions were developed with different bases, one based on the dimensions of the final product and another based on the time and speed of the production line. As the objective, as already mentioned, would be to simulate the reality as much as possible, it was chosen to follow the version that was based on the speed of the line. At the end, a version that fulfilled the proposed objectives was achieved, and when tested it remained within the limit of maximum error.
Based on this analysis, it was possible to verify that both years had very similar productions, although in the year 2015 there was fewer production. In 2014 there was an 83.6% yield and 83.2% in 2015. The lines that produced the most were lines 1 and 4 and those are the ones that also obtained a higher yield. Also, in 2014 were produced more wastes than in 2015. Predictably the lines that contributed the most to these values were also lines 1 and 4. In order to carry out an analysis of the waste produced, these were divided into several categories as to their production cause: quality (defects of the product being produced), operational (maintenance), failure (technical failures), changes (changes in specifications of the product being produced), start of production (start of production lines) and others (not applicable in other categories). It was concluded that in lines 1, 2 and 4 a large part of the waste produced was due to changes between batches. Line number 3, being a test line, the causes of waste were balanced. In addition to the wastes caused by changes during production, line 4 had as its main cause of wastes production the operational category. This mainly occurs because line 4 is the production
line of optical products and requires a lot of wasted material to clean the rolls. As for the film production lines, lines 5 and 6, the category that stands out the most is the starting of production. After these conclusions, a more detailed analysis was carried out on the category of changes in lines 1, 2, 3 and 4, being the change of thickness being the most outstanding. In the film production lines, the start of production category was analysed, and the biggest cause is technical failure. During this analysis was possible to verify that producing long runs helps in increase the yield and minimize the production wasted material. Also, although is not presented here, was also determined that small changes in the thickness of the sheet produce less scrap than big jumps in the thickness. It was not possible to perceive a correlation between the quantity of scrap produced and some specification, like a specific colour or thickness. In the other hand, higher yields were achieved by the specifications which were produced in most quantity during the year. This shows that it is essential to develop a production planning always with the intention of minimizing the changes between batches. In the end a small team, involving both manufacturing and sales departments was formed and set some actions to follow up this project: rationalization of certain colours in all lines; optimize block scheduling in line 1; rationalization certain widths in line 1 and 2; rationalization width 1250mm and above 5mm gauge and gather detailed information according to thickness and colour changes in line 1, 2, 3 and 4; project Roll cleaning (already on going).
The separation or elimination of sawdust project had as its starting point to gather information on the operation of the line, information from previous projects and feedback from various parties involved in the production and post production. It was also organized two brainstorms, with the participation of several parties involved in the production process. The first was to designate which would be the most probable causes to produce sawdust and the second to designate possible solutions to these causes and prioritize them. From there, several actions have been designed to reach possible solutions, those actions covered several fields in both elimination and attempted removal, namely maintenance, saw design, line design, process settings and masking application. After several experiments in order to make the different causes of sawdust production known, it was concluded that different saw designs would be necessary for different sheet thicknesses, which need to be in good condition and available to be stored and installed in a simple way. For this, a table was developed that designates the type of saw to be used for the different thicknesses produced, and a protocol with an external company that provides new saws and maintains the used ones. A new method of storing and registering saws has also been developed, and a tool has been developed that allows to take samples of sawdust produced by the cuts during production. Finally, after most of these measures were applied, it was possible to see an improvement in the quality of the cuts, mainly in the production of sawdust between the sheet and the masking. In contrast, there is still sawdust on the sheets, despite being in a smaller quantity, thus its total separation requires a more detailed investigation, which may pass by improving the vacuum system installed on the lines.
Both projects, developed during the internship, will allow the Functional Forms plant to optimize production, by quantifying the different streams of production and reducing wastes. It
xi
will also improve the quality of the product by preventing and separating the sawdust of the final product, dropping the quality complains, allowing SABIC to grow in different markets. Along the present Master thesis due to confidentiality reasons of the company SABIC, in chapter 3 (Production and Wastes Analysis) volume values were not published. As well, in Chapter 4 (Sawdust Removal and Elimination) neither the identity of the external companies, with which SABIC has a partnership, nor the brands of the materials used, were published.
xiii
TABLE OF CONTENTS
ACKNOWLEDGMENTS ... III RESUMO ... V ABSTRACT ... IX TABLE OF CONTENTS ... XIII FIGURES INDEX ... XIV TABLES INDEX ... XVI GLOSSARY ... XVII
1. INTRODUCTION ... 1
1.1. COMPANY PRESENTATION ... 1
1.2. THE PRODUCTION OF SOLID SHEETS: ASPECTS RELATED WITH THE PROCESS, MARKET, AND AMOUNT OF MONEY ... 3
1.3. POLYCARBONATE SOLID SHEET – CHARACTERISTICS AND SPECIFICATIONS ... 7
1.4. COMPONENT MANUFACTURING PROCESS ... 11
1.5. INSPECTION METHODS ... 13
1.6. QUALITY CONTROL METHODS ... 15
1.7. QUALITY ASSURANCE ... 19
2. FUNCTIONAL FORMS PLANT MASS BALANCE ... 21
2.1. MASS BALANCE TOOL ... 21
2.2. MASS BALANCE TOOL MODEL CONCEPT ... 27
3. PRODUCTION AND WASTE ANALYSIS ... 32
3.1. PRODUCTION ANALYSIS ... 32
3.2. WASTES ANALYSIS ... 36
3.3. ANALYSIS FOLLOW UP ... 42
4. SAWDUST REMOVAL AND ELIMINATION OPTIMIZATION ... 44
4.1. FUNCTIONAL FORMS LINE 4 ... 44
4.2. BRAINSTORMS ... 49
4.3. EXPERIMENTS ON LINE 4 ... 54
4.4. SAWING SETTINGS OPTIMIZATION ... 68
4.5. MAINTENANCE OPTIMIZATION ... 69
4.6. RECAP AND PATH FORWARD ... 71
5. CONCLUSIONS ... 74
6. BIBLIOGRAPHY ... 76
FIGURES INDEX
Figure 1 - SABIC's locations around the World. Adapted from: (SABIC, 2016) ... 1
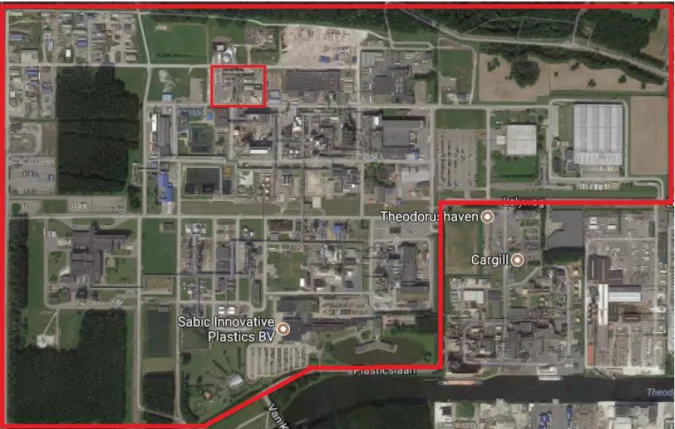
Figure 2 - Satellite image of SABIC innovative Plastics BV site and Functional Forms plant in Bergen op Zoom. Adapted from: (Google Maps, 2017) ... 3
Figure 3 - Worldwide and European Plastics Production 1950-2011. Source: (Association of Plastics Manufacturers, 2012) ... 4
Figure 4 - World consumption of polycarbonate resins in 2015. Adapted from: (IHS Markit, 2016) ... 6
Figure 5 - Polycarbonate examples of modulus retention (%) versus temperature (°C). Adapted from: (Biron, 2007) ... 7
Figure 6 - Polycarbonate examples of elastic modulus retention (%) versus temperatures (°C). Adapted from: (Biron, 2007) ... 8
Figure 7 - Light transmission (%) versus light wavelength (nanometer) of a Lexan sheet. Source: (SABIC, 2009) ... 9
Figure 8 - Impact strength resistance for different materials. Adapted from: (SABIC, 2009) 10 Figure 9 - Diagram of a basic industrial resin extrusion process. Adapted from: (Giles et al., 2005). ... 11
Figure 10 – Illustration of an example of a plastic injection molding machine. Source: (Excelite, 2017) ... 12
Figure 11 - Graphic models of front and sectional views of typical surface defects. Source: (Pinner & Simpson, 2003). ... 16
Figure 12 - Sensing with laser scanning (reflection systems). Source: (Hudson, 1995) ... 17
Figure 13 - Using an ultrasonic sensor (reflection system). Source: (Hudson, 1995) ... 17
Figure 14 - Functional Forms production. ... 21
Figure 15 - Production schedule diagram. ... 21
Figure 16 - Mass balance scope diagram over time. ... 22
Figure 17 - Mass balance calculation tool final concept. ... 31
Figure 18 - Line 1 production in 2014 and 2015. ... 32
Figure 19 - Line 2 production in 2014 and 2015. ... 33
Figure 20 - Line 3 production in 2014 and 2015. ... 33
Figure 21 - Line 4 production in 2014 and 2015. ... 34
Figure 22 -Line 5 production in 2014 and 2015. ... 34
Figure 23 - Line 6 production in 2014 and 2015. ... 35
Figure 24 - Functional Forms plant production in 2014 and 2015. ... 35
Figure 25 – Wastes produced by line 1 (I), Line 2 (II), Line 3 (III) and line 4 (IV) in 2014 and 2015. ... 37
Figure 26 – Wastes produced by line 5 (V) and line 6 (VI) in 2014 and 2015. ... 38
Figure 27 - Functional Forms plant wastes production in 2014 and 2015. ... 39
Figure 28 - Percentage of wastes category production per line in 2015. ... 39
Figure 29 - Wastes produced in changes category in line 1 (I), 2 (II) and 3 (III) in 2014 and 2015. ... 40
Figure 30 - Line 4 wastes production in changes category and in roll cleaning in 2014 and 2015. ... 41
Figure 31 - Line 5 (V) and 6 (VI) wastes production in “changes” category in 2014 and 2015. ... 42
Figure 32 - Sawing station of line 4. ... 44
Figure 33 - Rotational direction of the trim saws. ... 45
Figure 34 - Sawing station sketch. ... 45
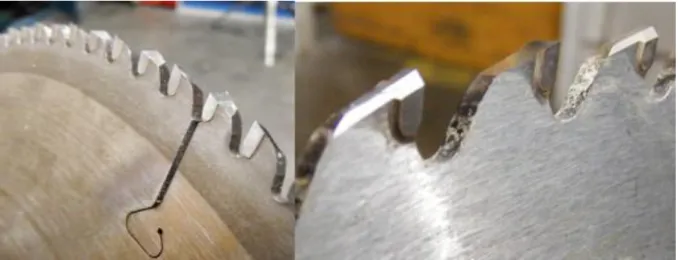
Figure 35 - Saw dust accumulation on Line 4. ... 46
xv
Figure 37 - Different teeth number and shapes for the same role. ... 48
Figure 38 - Bad cut influence on saw dust accumulation. ... 49
Figure 39 - Chart with categories of possible root causes. ... 50
Figure 40 - Flow chart of impact vs probability. ... 50
Figure 41 - Possible solutions prioritized by cost vs ease of implementation. ... 51
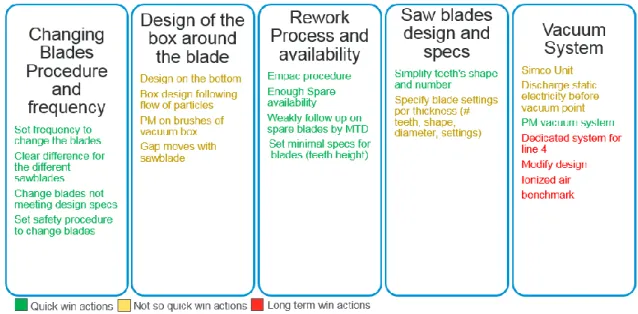
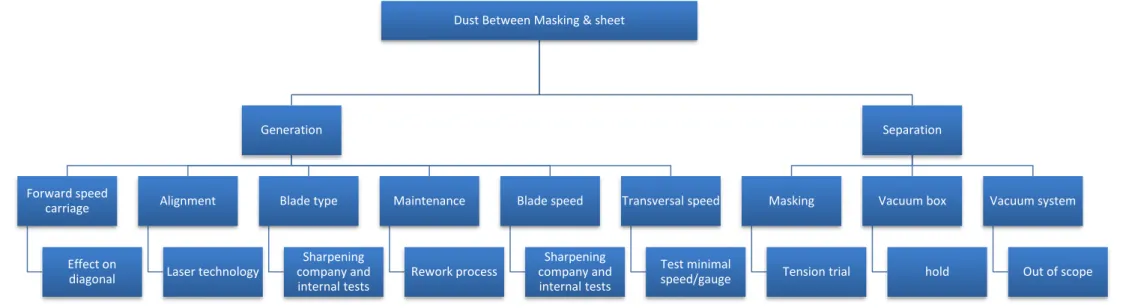
Figure 42 - Dust between masking and sheet: possible solutions from the brainstorms. ... 52
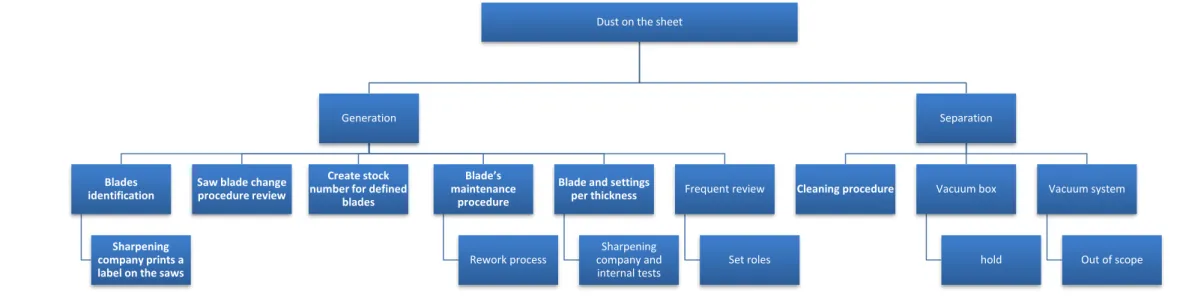
Figure 43 - Dust on the sheet: possible solutions from the brainstorms... 53
Figure 44 - Line 4 minimal trans speed calculations sketch... 54
Figure 45 - Front and back cross cuts with different saws and specs. ... 55
Figure 46 - Cross-saw height influence in the quality of the cut in thick sheets sketch... 56
Figure 47 - Cross cuts with different cross-saw heights. ... 57
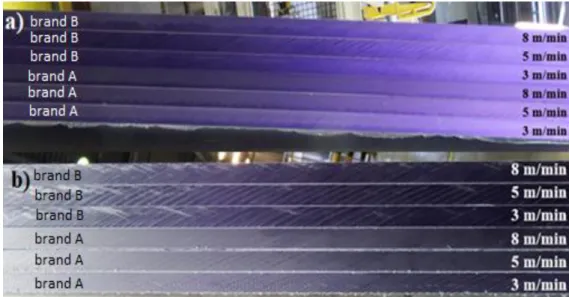
Figure 48 - Side view of cross cuts with 72 teeth Brand A cross saw. ... 62
Figure 49 - Side view of cross cuts with 120 teeth Brand A cross saw. ... 63
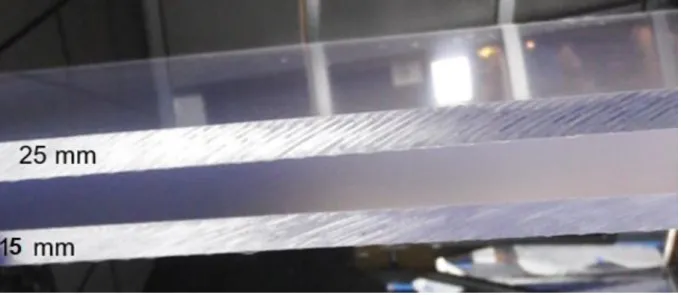
Figure 50 - Cross cuts obtained with different masking tensions. ... 67
Figure 51 – Sketch of the mechanism to take samples of sawdust produced by the saws. ... 69
Figure 52 - Metal tubes installed on line 4, with the sample taker. ... 69
Figure 53 - Saw change registration table. ... 70
Figure 54 - New method to store the saws near the line sketch. ... 70
Figure 55 - Topics investigated to optimize the existence of dust between the masking and sheet problem. ... 71
Figure 56 - Different cuts obtained during production after the optimization. ... 71
Figure 57 - Topics investigated to optimize the existence of dust on the sheet. ... 72
Figure 58 – Presence of sawdust on the sheet on a cut obtained during production after the optimization. ... 72
TABLES INDEX
Table 1 - World consumption of polycarbonate, by sector, for the period 1999-2002. Adapted
from: (Platt, 2003) ... 5
Table 2 - Examples of process variables to control and instrument sensors that could be used to control them. Adapted from: (Rosato, 1998) ... 13
Table 3 - Defect recognition methods comparison. Adapted from: (Pinner & Simpson, 2003). ... 18
Table 4 - Inputs (light red cells) which must to be filled in by the operator. ... 28
Table 5 - Total input calculation section. ... 29
Table 6 - Total Output calculation. ... 30
Table 7 - Mass balance final output. ... 31
Table 8 - List of saws stored in the warehouse. ... 46
Table 9 - Cross saw brand comparison and transversal speed cut experimental conditions. .. 54
Table 10 – Used saws on cross saw brand comparison and transversal speed experiment. .... 55
Table 11 – Specs of the samples taken on cross saw brand comparison and transversal speed experiment. ... 55
Table 12 - Crosscut vertical position influence experimental conditions. ... 56
Table 13 - Used saw on crosscut vertical position influence experiment. ... 56
Table 14 – Specs of the samples on crosscut vertical position influence experiment. ... 57
Table 15 - Cross cut settings optimization for thin gauges experimental conditions. ... 58
Table 16 - Used saw on cross cut settings optimization for thin gauges experiment. ... 58
Table 17 - Specs of the samples taken on cross cut settings optimization for thin gauges experiment. ... 58
Table 18 – Side view of cross cuts with different RPMs and different transversal speed. ... 59
Table 19 - Top view of cross cuts with different RPMs and different transversal speed. ... 60
Table 20 - Number of teeth effect on thin thicknesses experimental conditions. ... 61
Table 21 – Used saws on number of teeth effect on thin thicknesses experiment. ... 61
Table 22 – Specs of the samples taken on number of teeth effect on thin thicknesses experiment. ... 61
Table 23 - Masking tension effect on cuts quality experimental conditions. ... 64
Table 24 - Used saws on masking tension effect on cuts quality experiment. ... 64
Table 25 - Samples specs taken on masking tension effect on cuts quality experiment. ... 64
Table 26 - Different views of the cuts obtained with the masking tension 25. ... 65
Table 27 - Different views of the cuts obtained with the masking tension 20. ... 65
Table 28 - Different views of the cuts obtained with the masking tension 15. ... 66
Table 29 - Different views of the cuts obtained with the masking tension 10. ... 66
Table 30 - Different views of the cuts obtained with the masking tension 6. ... 67
Table 31 - Optimized saw inventory for line 4. ... 68
Table 32 - Optimized sawing specs for different gauges. ... 68
Table 33 - Present situation of the Removal and Elimination Optimization Project, and its path forward. ... 73
xvii
GLOSSARY
BoZ Bergen op Zoom
CAGR Compound Annual Growth Rate
CCD Charge-coupled device
CIS Commonwealth of Independent States
CUT Continuous use temperature under unstressed state
EMEA Europe, Middle East and Africa
EU-27 27 countries of European Union during the period of 2007-2013
FDA Food and Drug Administration
FF Functional Forms
GF Glass Fiber
GP Gas Permeable
ISEC Instituto Superior de Engenharia de Coimbra
SABIC Saudi Basic Industries Corp
SF&S Specialty Films & Sheets
TTFG Final product
UL Underwriters Laboratories
US United States of America
US$ United States dollar
Roberto Duarte Mota 1
1. INTRODUCTION
In the scope of the Masters in Chemical and Biological Processes, the student has the opportunity to undertake an internship or to develop a final course project/dissertation. Having the preference for an internship, and preferably abroad, the student applied to an online internship offer at Saudi Basic Industries Corp (SABIC) more specifically for the Functional Forms plant (Specialty Films & Sheets, SF&S, at the time) in the SABIC Innovative Plastics B. V. in Bergen op Zoom, The Netherlands, having been accepted by the company.
This resulted in a partnership between the Instituto Superior de Engenharia de Coimbra (ISEC) and the company SABIC, with the aim of placing the student in contact with the business environment, performing tasks associated with process and quality optimization. The internship lasted 6 months, starting in October 2015 and ending in March 2016.
The internship had as main objectives the optimization of the processes to separate and/or eliminate the sawdust, the elaboration of a tool allowing the calculation of the mass balance of each line per batch and a global mass balance and wastes analysis of the Functional Forms production lines, one of the site´s plants.
In this chapter there is a short introduction where all topics of interest related to the internship and to the Functional Forms plant products, polycarbonate sheet and film, are mentioned. Follows the presentation of the factory, worldwide and particularly in Bergen op Zoom (BoZ). It is worth noticing, SABIC, is one of the plastic and polycarbonate sheets and films market leaders in the world.
1.1. Company Presentation
SABIC is a Saudi diversified multibillion-dollar manufacturing company, active in chemicals and intermediates, industrial polymers, fertilizers, and metals. SABIC is the largest listed company in the Middle East, with operations in more than 50 countries and over 40000 employees worldwide, those locations can be seen in Figure 1.
Ranked among the world’s largest petrochemicals manufacturers, SABIC is a public company based in Riyadh, Saudi Arabia. Seventy percent of the Company’s shares are owned by the Saudi Arabian government, with the remaining 30% held by private investors in Saudi Arabia and other countries of the Gulf Cooperation Council.
SABIC is currently the second largest global ethylene glycol producer, the third largest polyethylene manufacturer, the fourth largest polyolefins manufacturer, and the fourth largest polypropylene manufacturer. SABIC is also the world’s largest producer of granular urea, polycarbonate, polyphenylene and polyetherimide.
On May 21, 2007, SABIC acquired General Electric's Plastics division, in a US$11,600 million cash deal, including US$8,700 million of its liabilities, and launched SABIC Innovative Plastics (New York Times, 2007). As of 2017 SABIC is the world's 117th largest corporation on the Forbes Global 2000 ranking, with sales revenues of US$50,400 million, profits of US$4,800 million and assets standing at US$84,500 million (Forbes, 2017).
In Europe, SABIC has thirteen world-class petrochemical production sites. Engineering Thermoplastics and Specialties are produced in Bergen Op Zoom, Enkhuizen and Raamsdonksveer (The Netherlands), Thornaby (United Kingdom), Fosses (France), Pontirolo and Olgiate Olona (Italy), Cartagena (Spain) and Wiener Neustadt (Austria). Plastics and chemicals are produced in Geleen (The Netherlands), Genk (Belgium), Teesside (United Kingdom) and Gelsenkirchen (Germany).
The Bergen op Zoom site (Figure 2) hosts eight production plants of Lexan (a resin based on polycarbonate and polyetherimide), Noryl (a resin based on polyphenylene ether and polystyrene), Valox (a blend of polymeric materials of semi crystalline structure based on polyesters, mainly polyethylene terephthalate), Xenoy (a blend of semicrystalline polyester and polycarbonate) and Xylex (a blend of polycarbonate and amorphous polyester). One of the site´s plant is the Functional Forms, which is specialized in the production of solid polycarbonate sheets and films. The plant has six lines, line 1 and 2 produce solid sheets, line 4 produces solid sheets with optical quality, lines 5 and 6 produce films and line 3 has the capability to produce both solid sheets and films.
Roberto Duarte Mota 3
Figure 2 - Satellite image of SABIC innovative Plastics BV site and Functional Forms plant in Bergen op Zoom. Adapted from: (Google Maps, 2017)
As SABIC is changing its informatics system, a tool to calculate the Functional Forms plant line’s production, per batch, was needed. Also, the necessity to prepare part of the mass balance tool elaboration was detected, and in tune with that project, a production and waste analysis was required. The presence of saw dust in the final product prevents SABIC to grow in the markets with optical applications, so there was the necessity to optimize the removal and elimination of sawdust form the final product.
1.2. The Production of Solid Sheets: aspects related with the process, market, and amount of money
1.2.1. Plastic Industry M arket
Worldwide, the 2008 and 2009 global economic crisis affected the plastic industry, however since 2010, it has been recovering consistently. Global plastics production increased by 10 million tons (3.7%), to around 280 million tons in 2011, continuing the growth pattern that the industry has enjoyed since 1950, approximately by 9% per year (Association of Plastics Manufacturers, 2012). Competition in the industry is growing, plastics markets are progressively shifting towards Asia, which is characterized by over-average growth rates and is rising in production capacity. The world’s plastic production since 1950 is characterized in Figure 3 (Association of Plastics Manufacturers, 2012).
Figure 3 - Worldwide and European Plastics Production 1950-2011. Source: (Association of Plastics Manufacturers, 2012)
1.2.2. Plastic Industry M arket in Europe
Such as the rest of the World´s, Europe’s plastic production has been rising, except during the global financial crisis years (2007-2009). In 2011, the EU-27 plastics industry had a 0.3% increase in their turnover to over 89,00 million euros. Converters had a greater growth, they experienced an increase to almost 194,000 million euros (1.9%). Although the global financial crisis, the producing sector workforce remained relatively stable, with 167,000 employees and converters employing 1.23 million European citizens. In total, the industry employs a workforce of 1.45 million, including 53,000 from the plastics machinery industry (Association of Plastics Manufacturers, 2012).
1.2.3. Polycarbonate Sheet Industry M arket
Polycarbonate was introduced in 1957 as a replacement to metals. Although it couldn’t always compete with metal on a raw material cost per pound, the molded polycarbonate parts have the advantage of not requiring a secondary finishing, which is a major labour cost saving (Margolis, 1985).
Polycarbonate was one of the principal plastics produced during the period of 1995-2000 in the engineering plastics sector. During that period, it averaged an annual worldwide consumption growth of 15-20%. Nevertheless in 2001 there was a major contraction in demand for this plastic with world consumption falling 6-7%, this occurred not only due to the downturn in major markets such as automotive, construction and electrical and electronics, but also to relatively high stocks that converters had built up in previous years. The major decline in 2001
Roberto Duarte Mota 5
was registered by the United States (US) market, with 16%, followed by Japanese consumption lower by over 14% and Europe just over 6.5% (Platt, 2003).
Next year, in 2002, the world demanding recovered 5.7%, with the Asia Pacific recording the fastest growth, and Western Europe demand grew by 6.3%, while consumption growth in the US and Japan was much more unassertive (Platt, 2003).
Table 1 shows the major users of polycarbonate during part of the period mentioned above. More than one quarter of total world consumption are the consumer products, such as optical data media appliances. Then it is followed by electrical and electronics, medical applications, and automotive. Other markets, comprising packaging, optical lenses and sports equipment, are about 11 % of total consumption (Platt, 2003).
Table 1 - World consumption of polycarbonate, by sector, for the period 1999-2002. Adapted from: (Platt, 2003) 1999 2000 2001 2002 1000 tons % 1000 tons % 1000 tons % 1000 tons % Automotive 290 19.0 314 18.2 269 16,6 283 16.5 Electrical & Electronics 402 26.3 431 25.0 401 24.7 426 24.9 Consumer products 358 23.5 458 26.5 471 29.1 497 29.0 Medical 308 20.2 323 19.0 302 18.6 323 18.8 Other 168 11.0 195 11.3 178 11.0 185 10.8 TOTAL 1526 100.0 1726 100.0 1621 100.0 1714 100.0
In the middle 2010´s, the largest market for polycarbonate was Asia-Pacific, being about 60% of the global polycarbonate market demand. The Asia-Pacific market development is due to the shift of various end-use industries of polycarbonate from western regions to the Asia-Pacific. The advantages, for those industries, in this developing market, are the low labour cost, easy availability of raw materials, and lack of stringent regulations. Western Europe is the second-largest market for polycarbonate, followed by North America, and at last, Latin America (Markets and markets, 2015; Wiley-VCH, 2016). These markets’ shares are represented in Figure 4.
Figure 4 - World consumption of polycarbonate resins in 2015. Adapted from:(IHS Markit, 2016)
Globally, consumption is not dominated by any single application. The largest market application in the US is the automotive/transportation, it amounts to 24%, in Western Europe is building and construction (sheet and film) with a total of 25%, in China the largest is the electronic/electrical market with 30% of the market, and the electronic/electrical market is also the largest in Japan with 27% of the market (IndustryARC, 2015).
The polycarbonate resin market in 2015 worth more than US$12,000 million and is expected to reach US$16,400 million in 2020. While the European Polycarbonate Market size in terms of value of polycarbonate was estimated to be US$1,900.0 million in 2014 and is projected to grow at a CAGR (Compound Annual Growth Rate) of about 5% from 2014 to 2019 (Business Wire, 2015).
Forecast growth rates for consumption of polycarbonate vary widely by region but the global consumption growth rate will average about 3% during 2015–20. Also, is predicted that Northeast Asia is going to continue to be the largest consumer of polycarbonate resins and will be one of the fastest-growing regions, averaging growth of about 4% per year, driven by 5% per year growth in China. Asia´s growth will be followed by the CIS (Commonwealth of Independent States) and Baltic States and Southeast Asia at around 3.5–4.5%. (IHS Markit, 2016).
The global polycarbonate industry is dominated by two producers whose capacities accounted about for 54% (about 27% each) of world capacity: Bayer (Bayer Material Science) and SABIC Innovative Plastics. They were followed, in 2012, by three other major companies: Mitsubishi (12%) (Mitsubishi Chemical, Mitsubishi Gas Chemical and Mitsubishi Engineering Plastics); Teijin (10%) and Styron (6%) (Wiley-VCH, 2016).
The requirement for large initial investment, access to technological licensing, possible start-up difficulties, and the establishment of efficient and effective marketing, are major obstacles to enter the polycarbonate resin business, making it difficult to compete with the polycarbonate
Roberto Duarte Mota 7
manufacture giants. It is necessary to continue to develop improved polycarbonate resins for the growing medical/ophthalmic applications and growing optical lens markets, including digital camera lenses and other uses requiring a high refractive index and low birefringence (IHS Markit, 2016).
1.3. Polycarbonate Solid Sheet – characteristics and specifications
The versatility of polycarbonate makes it suitable for many engineering applications, as stated in section 1.2.3. Polycarbonates are polyesters resulting from the polycondensation of carbonic anhydride and a bisphenol. Polycarbonates are amorphous and highly transparent thermoplastics with excellent impact strength, and low resistance to ultraviolet (UV) and weathering. When extruded in sheet form, its optical and impact properties render this material as a strong candidate for a wide range of glazing applications (Biron, 2007; General Electric Company, n.d.). High quality polycarbonate sheets are characterized by its dimensional stability at elevated temperatures; inherent “water-clear” transparency; high impact strength; flame resistance; FDA (Food and Drug Administration) compliance; lightweight and formability (SABIC, 2009), properties that will be discussed in the next chapters.
1.3.1. Thermal Behaviour
The continuous temperature in an unstressed state (CUT) is generally estimated from 90°C up to 125°C for gas permeable (GP) grades and up to 140°C for heat-resistant polycarbonates, if the softening or melting temperatures are higher. The ultraviolet temperature indices of specific grades can range from 65°C up to 130°C (Biron, 2007).
Figure 5 displays two examples of modulus retention versus temperature for a neat and a glass fiber (GF) reinforced polycarbonate; the two curves are almost the same, having a rapid fall at about 140-145°C (Biron, 2007).
Figure 5 - Polycarbonate examples of modulus retention (%) versus temperature (°C). Adapted from: (Biron, 2007)
At low temperatures, the behaviour can be reasonably good down to -20°C, or even less, depending on the grades. Rigidity slowly increases when the temperature decreases down to -60°C, as seen in Figure 6.
Figure 6 - Polycarbonate examples of elastic modulus retention (%) versus temperatures (°C). Adapted from: (Biron, 2007)
Glass transition temperatures are high, around 150°C, for some grades and from 160°C to 200°C, for heat-resistance grades (Biron, 2007).
1.3.2. Optical Properties
The use of polycarbonate as a glazing material and both ophthalmic and automotive lenses has occurred because of its transparency, ductility and high heat distortion temperature. Amorphous polycarbonate is transparent with light transmittance ranging from 80% to 91%, a haze of roughly 0.7 to 1.5% and a refractive index about 1.580-1.586 (LeGrand & Bendler, 2000). One of the grades with optical quality is the polycarbonate sheet Lexan Thermoclear, by SABIC. This sheet is almost opaque to radiation in the UV and far infra-red region, although it transmits light very well. This useful shielding property can prevent discoloration of sensitive materials and reduces the heat build-up, as presented in Figure 7 (General Electric Company, n.d.).
Roberto Duarte Mota 9
Figure 7 - Light transmission (%) versus light wavelength (nanometer) of a Lexan sheet. Source: (SABIC, 2009)
1.3.3. M echanical Properties
A hard and tough material such as polycarbonate is characterized by high modulus, high yield stress, high elongation at break and high ultimate strength (Lampman, 2003). So, as expected the mechanical proprieties of polycarbonate sheets are similar, with relatively high elongations at break but much more limited strains at yield. Modulus and hardness are in a medium range and impact strengths are excellent. The abrasion resistance of polycarbonate sheets depends on the roughness, type and morphology of the opposing sliding surface. The coefficients of friction range are from 0.10 to 0.21 (Biron, 2007).
Alterations due to moisture exposure are weak, the shrinkage and coefficient of thermal expansion are rather low and polycarbonate sheets also have a good creep resistance. As stated by Biron (2007), the creep strengths for failure after 10000 h, of some polycarbonate sheets grades, with an engineering tensile strength of 67 MPa, are:
• 15 MPa at 120°C, which is 22% of the engineering tensile strength; • 20 MPa at 100°C, which is 30% of the engineering tensile strength; • 30 MPa at 80°C, which is 45% of the engineering tensile strength; • 38 MPa at 60°C, which is 57% of the engineering tensile strength; • 45 MPa at 23°C, which is 67% of the engineering tensile strength.
For a 2-year outdoor exposure of transparent polycarbonate sheet, the retention of impact strengths can be 4% for a no stabilized grade and 100% for a UV-stabilized grade. The optical properties for the same sheet in the same conditions are for no stabilized grade 82% for transmittance, 20% for the haze and 20 for the yellowing and for a UV-stabilized grade are 87% for transmittance, 15% for the haze and 6 for the yellowing (Biron, 2007).
Polycarbonate sheets have also a better resistance to impact than glass and acrylic. Figure 8 shows the results of an experience to test the impact resistance due to a falling steel dart with 2.3 kg and 25.4 mm diameter (SABIC, 2009).
E n er g y ( ft ⋅lb ) E ner gy ( jo ule)
Figure 8 - Impact strength resistance for different materials. Adapted from: (SABIC, 2009)
1.3.4. Chemical Resistance
Although the polycarbonate sheets they have generally good chemical resistance at room temperature to dilute acids, oils, greases, aliphatic hydrocarbons and some alcohols, they present low resistance to aldehydes, ketones (can cause stress-cracking and severe crystallisation), esters (can cause crystallisation), ethers, aromatic and halogenated hydrocarbons (severe stress-cracking agents), organic and mineral concentrated acids and bases, amines (surface crystallisation and chemical attack) and phenols (Biron, 2007; Astrup, n.d.; The plastic shop, n.d.)
1.3.5. Electrical Properties
Polycarbonate sheets are good insulators even in wet environments with high dielectric resistivity, fair rigidities and low or moderate loss factors. This characteristic led to its application in the electric industry (Biron, 2007).
1.3.6. Water Absorption
Unlike other materials, whose mechanical properties are affected by moisture or water absorption, polycarbonate’s mechanical properties are not affected. This is the main reason why these sheets are used in glazing applications.
Polycarbonates absorb small quantities of water, less than 0.6%. However, when polycarbonates are washed with hot water, after a long period of time, they may begin to decompose reducing the ability of polycarbonate sheets to resist impact or shock.
Polycarbonates offer limited retraction during molding and its inability to absorb moisture/ and humidity makes it to have a good dimensional stability especially in a humid atmosphere. During injection molding, it should be subjected to higher pressures of between 800 bars and 1800 bars (Excelite, 2017).
Roberto Duarte Mota 11
1.4. Component Manufacturing Process
The first step of the polycarbonate manufacturing process is to receive, inspect and store the polymeric raw materials. Before extrusion, the polymer may be blended with additives, colour pigments, flame retardants, reinforcements, etc., depending on the grade which is going to be produced. Due to moisture some resin products must be dried before extrusion to prevent polymer degradation. Once the ingredients are properly prepared, the formulation is fed into the extruder, where it is melted, mixed and delivered to the die. Then, the product is cooled, solidified, shaped and pulled away from the extruder at a constant velocity by the rollers. Next, secondary operations may be performed, like masking application, flame treatment, cutting, etc. Finally, the final product is inspected, packed and shipped. All this process is represented in Figure 9 (Giles et al., 2005).
Figure 9 - Diagram of a basic industrial resin extrusion process. Adapted from: (Giles et al.,
2005).
Usual molding methods for polycarbonate sheet production are injection molding, compression molding, and a fusion of both methods, injection-compression molding.
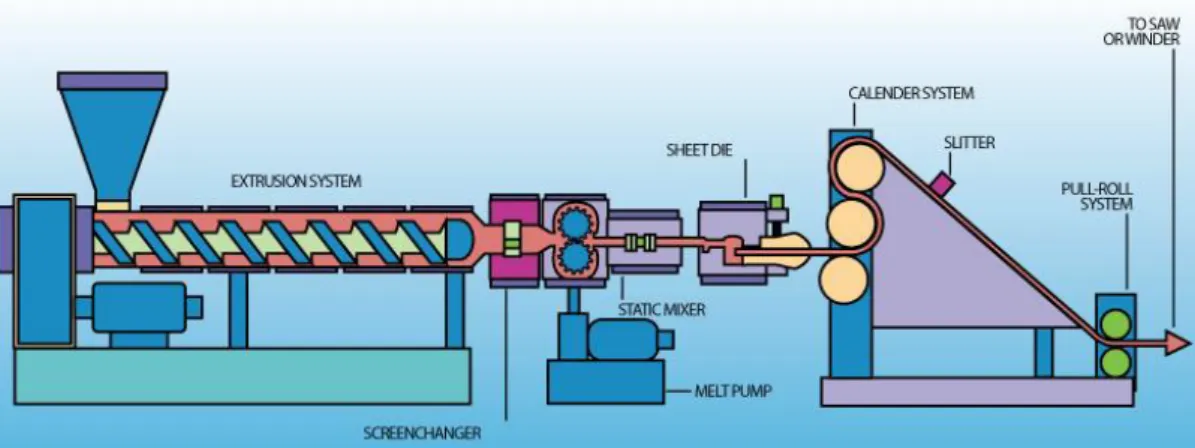
1.4.1. Calendering Process
The term 'calender' means 'to press (plastic) between rollers or plates to make smooth and glossy or glazed or produce thin sheets. This process is used to produce rolled sheets of specific thickness and final appearance in many industries, such as the plastics, rubber, paper and steel industries. In the plastics industry, the calendering of molten polymers is a process to produce continuous sheet or film by squeezing the melt between 3 to 6 heated counter-rotating rolls in a ‘L’ or ‘Z’ arrangement. The forming operation is completed by the calender itself and is
Polymer received, stored and inspected Material blended with additives Polymer
dried Polymer fed to extruder
Extrusion Shapped and drawn Solidification and cooling Puller -dimensional control Secondary operation -decorative
usually followed by additional treatment of the plastic sheet or film produced. Figure 10 shows an example of this industrial process.
Figure 10 – Illustration of an example of a plastic injection molding machine. Source: (Excelite, 2017)
The molten material is fed to the calender rolls from a large extruder. The rolls are internally heated. In the case of a four-roll configuration there are three areas of contact (nip regions) between two rolls, which reduces the polymer melt thickness gradually while making a wider film. The difference in speed between two adjacent rolls is the friction, which combined with temperature gives increased shear mixing, allowing the transfer of the melt from one roll to the next. A polymer accumulation (bank) of material is formed in front of each nip which feeds the nip. For each rotation of the roll, only a small portion of the bank enters the nip, thus the material in the bank is exposed to high temperatures for long times (residence time), while the material that passes through the nip does so for short times but at high shear rates. Also, properties such as adhesion to the rolls and some form of melt strength are important as the material exits the last nip and is drawn down to the final sheet thickness on take-off rolls cooling the film to room temperature. The most important for hydrodynamic analysis for determination of flow variables, such as pressures and forces which affect the final film properties, is the final nip region.
Calender sizes range up to 250 cm in width and 90 cm in diameter, with polymer throughputs up to 4000 kg/h. Roll speeds may be as high as 2 m/s for certain thin flexible films (thickness less than 0.1 mm). In terms of capital investment in machinery, calendering lines are very expensive. Film and sheet extrusion are competitive processes because the capital investment for the extruder itself is only a fraction of the cost of a calender. Nevertheless, the high quality and volume capabilities of calendering lines make them advantageous for many types of products, especially for temperature sensitive materials (Thomas & Yang, 2009).
1.4.2. Extrusion Conditions
For a single screw extruder, the feed section length should be 30-40% of the screw length, the transition 20-40% of the length, and the metering section is the rest. Polycarbonate melt viscosity is more temperature sensitive than shear sensitive, per instance, increasing the melt
Roberto Duarte Mota 13
temperature from 235°C to 265°C decreases the viscosity by 2.6 times, while increasing the shear rate from 100 to 400s-1 over the same temperature range reduces the viscosity 1.5 times.
The optimum melt temperature at the die is between 249°C and 266°C. The die gap is usually set 5-20% greater than the desired final dimension (Giles et al., 2005).
1.5. Inspection Methods
During the production process it is very important to inspect the quality of the manufactured product. This is an important area that should be thoroughly analysed and studied to obtain the desired performance of the complete production line and its parts. First, it is necessary to determine what is required to control and how to approach it; some examples are in Table 2. With proper controls, it is possible to achieve different advantages, such as better economics, improved quality of product, maximized output rate, plastic wastes reduction by minimizing tolerances, reduced setup times, utilities savings and reduced scrap (Rosato, 1998).
Table 2 - Examples of process variables to control and instrument sensors that could be used to control them. Adapted from: (Rosato, 1998)
Process variables Instrumentation
Temperature Thermoelements; Resistance elements, Radiation recorder
Pressure Strain gauges, Resistance elements
Rotational speed A-c/d-c generators, Incremental counters
Weight Strain gauges, Piezo elements
Velocity A-c/d-c generators, Incremental counters, Correlators
Torque Strain gauges, Scales
Time Impulse counters
Logic state (on/off) Switches
Controls demand a high level of expertise from the processor. They provide closed-loop control of temperature, pressure, thickness, etc, and maintain pre-set parameters, monitor and correct equipment operations contributing for a process optimization (Rosato, 1998).
Most processes operate better when most functions occur in a desired time sequence or at prescribed intervals of time. Nowadays electronic logic and timing devices are used based on the programmable logic controllers. Microelectronic controls have eliminated many potential human errors in setting production lines, such as data entry errors and mistakes due to insufficient extrusion knowledge. They represent a major opportunity to improve the reliability
of setting the process while eliminating manual machine adjustments, which can penalize the output rate and quality of final products. They also increase the number of controlled variables and have improved the user interface resulting in a more reliable operating line which results in a process optimization (Rosato, 1998).
1.5.1. Static Process Control
Static process control is increasing in importance as the techniques are adapted to use by the industry. The introduction and integration of computer control allow real time data collection and its benefits are being realized by the industry. The continuous nature of the extrusion process is a barrier to apply statistical process control but can be overcome and its benefits are worth it (Kent, 1998).
1.5.2. Self-Centring and M easurement Systems for Pipes
The linkage of control systems to inspection devices is widely used and such investments have very short payback times. A saving of 3% of material, on a pipe manufacturing rate of 800 kg/h, would save more than £25,000 per year on an extrusion line that costs £250,000. The typical system consists of an ultrasonic wall thickness meter mounted on a circular open frame track enclosing the pipe, that is linked to a computer control system which displays the wall thickness and distribution of the material in the pipe. Data monitoring of the output also provides records proof of conformance to specification. This system is crucial in achieving both process and quality control (Kent, 1998).
1.5.3. M easurement of Profiles and Computer Aided Systems for Rapid Inspection
For general profile production, it is currently possible to perform on-line measurement or detection of parameters such as gloss, colour and gross surface faults. Although machine control can operate for corrective actions, this is difficult, and most systems operate with a set limit alarm only. Measurement optical systems are preferred because the general profiles dimensions are so critical that the application of on-line measurement and control is complex, and non-contact is important. Techniques as laser light interstation and a charge-coupled device (CCD) array camera to measure the topography of profile products can be used to provide a dimensioned surface profile, but application to complex profiles with re-entrant features is difficult and internal features cannot be measured. The usage of new computer based video and image sensing devices can provide measurement data in minutes, that otherwise would take hours of inspection and labour time. This reduces dramatically the inspection load, remove the need for dedicated inspectors and allow process control to be accepted by the operator (Kent, 1998).
Roberto Duarte Mota 15
1.5.4. Gravimetric Feeding for Extrusion
Gravimetric control is the continuous monitoring of the ‘loss in weight’ of material at the feed hopper end of the extruder and the use of this information for inline control of the extruder based on the detected material usage. This allows fine control over the materials usage and the process itself to give improved productivity and competitiveness. The extruder screw remains the metering device, but the 'loss in weight' information is used to set the screw speed to achieve a constant materials usage rate. This enables the close control of the product average thickness or weight per unit length. Each individual ingredient is weighted delivering precise and homogeneous blends, giving high batch accuracy (Kent, 1998).
1.5.5. Fault Finding
Defect rectification and problem solving in the extrusion process are extremely complicated processes. Processing problems are often difficult to solve, and cause and effect are often not simply related. A single fault may be the cause of many observed defects or many faults may the cause of a single defect. True fault finding has traditionally been a specialized field and has depended on the knowledge and presence of experts for success (Kent, 1998).
1.6. Quality Control Methods
As stated by Holister & Salking (1973), quality is a process, not a destination. Therefore, in order to produce composite components, quality control activities must be performed continuously from initiation to completion to ensure reproducible high-quality production. This quality control is even more necessary for composite materials than for homogeneous materials, because the final product is manufactured from various intermediate material components. All parts of the process must be inspected for conformance to material specifications, since the incoming raw material, the production process itself to the final product. As a final check, some combination of destructive, non-destructive, and proof testing of the finished article must be performed (Holister & Salking, 1973).
1.6.1. Types of Surface Defects
Plastics are manufactured with the purpose of being useful to society, the product is required to satisfy not only physical and functional needs laid down, but also should respond to the sensitivity of those who contact with it (Pinner & Simpson, 2003).
In the first stages of assessing plastics surfaces, reliance is placed on human senses, the tendency is to regard the human inspector as the ‘automatic’ system and use it as a standard for comparison. As demands for quality and uniformity become more rigorous, it is vital to limit and localize defects, and to start, is necessary to identify and classify them. A polycarbonate sheet could have different types of defects in many sizes and shapes, which are illustrated in Figure 11. Foreign matter can be present in the sheet which is a result from a contamination of the raw materials used. Pinholes can be observed as a consequence of trapped air. Scratches,
marks made on surfaces by hard objects can exist in the polycarbonate sheets. Segregation, which is a defect in the transparency and unevenness, dents or protuberances at the surface can also be observed. Wrinkles which are faults in flat-lying constitute also a defect in polycarbonate sheets (Pinner & Simpson, 2003).
Figure 11 - Graphic models of front and sectional views of typical surface defects. Source: (Pinner & Simpson, 2003).
1.6.2. Detection and Identification of Surface Defects
Defects, as seen in chapter 1.6.1, must be detected and identified to ensure consistent product quality. Fast development of sophisticated computer systems, have ensured that the area of automatic sheet inspection has become progressively more important. All types of continuous sheet based plastics production processes can be inspected automatically. Detection of the defects can be recognized by many different methods. The selected method(s) depends largely on the purpose and the nature of the production to be employed. Those methods are based on obtaining signals from the surface and from a defect with different sensors. Transmission or reflection of radiation, electromagnetic or ultrasonic waves, are recorded so that comparison is made with data for satisfactory surfaces. One of the methods available is laser sensing, being very sensitive, it can detect defects down to 250-300 microns on a four-metre web (sheet with four-meter-wide), or 100 microns on a one metre web. The laser scans the surface and detection occurs because in a defect the intensity of light transmitted or reflected is different from a normal spot. Variations in reflection can indicate unevenness of surface, and, in a transmission system, differences in the transmission of light may indicate pinholes or foreign matter in sheets (Hudson, 1995). Figure 12 illustrates the laser sensing process for detection of defects in a sheet manufacturing industry.
Roberto Duarte Mota 17
Figure 12 - Sensing with laser scanning (reflection systems). Source: (Hudson, 1995) Another method is the ultrasonic sensing and, as the laser sensing method, it recognizes the variations on the reflected ultrasonic waves. Transmission of ultrasonic waves is difficult in air, one way to overcome this, is to examine the material immersed in water (Hudson, 1995). Figure 13 shows this process.
Figure 13 - Using an ultrasonic sensor (reflection system). Source: (Hudson, 1995)
Image sensing technology is based on sensing by two-dimensional photo systems. The information from the sheet under study is converted into electrical signals and then the resulting image is recognized and judged in a data processing unit. This method is used to automate visual inspection, saving labour and frees employees from necessary periods of intense concentration and prevents human error (Hudson, 1995).
As is mentioned before the choice of which systems to use depends on the application and what is required. Table 3 provides a comparison between the different recognition methods (Pinner & Simpson, 2003).
Table 3 - Defect recognition methods comparison. Adapted from: (Pinner & Simpson, 2003). Methods and assessment
Requirement Photo-sensor Laser Beam scanning Ultrasonic sensor One-dimensional Two-dimensional
Resolution medium Medium to
small large Small*
Flexibility medium large small Small
Size of system Small Small Large large
Speed Medium Low Fast low
Application to
samples medium wide narrow narrow
*Minimum 1mm.
1.6.3. Troubleshooting Approaches
In polycarbonate sheet production, there are many factors that affect not only the productivity of the process but also the final quality of the products. Different grades may have different processing conditions. It is important to focus on the root causes of defects to identify and solve the problem that occurs during processing. Observation is very important to solve any problem. The problems are interconnected between the process and end products. Troubleshooting is an effort that trusts in science and technology to eliminate the problems and improve quality with the goal to increase the process efficiency with quality of the end production (Subramanian, 2011).
The proper approach is important in eliminating process problems. Defects on the final product usually result from problems in one, or more, of three operation’s areas; the premolding (material handling and storage); molding (conditions in the molding cycle) and postmolding (parts handling and finishing operations). Sawdust, contamination or defects involving colour, collection, painting and vacuum metallizing are due to deficiencies in the premolding or postmolding. Solutions for those areas can vary from being obvious or specialized.
Faults in the polycarbonate production process itself are related to the molding cycle, and can be attributed to the machines, molds, operating conditions, material, product design and management. Molding cycle problem analysis is concerned with three major elements in the molding operation: the injection molding machine (per example the injection flow); the mold (if everything is functioning properly) and the material (plastic formulations). The three variables that influence those three operation elements the most, are time, pressure and temperature (Noriega & Rauwendaal, 2001).
Roberto Duarte Mota 19
Before correcting a fault, one must find it, to do so, a good quality control is necessary, as referred in the last section (1.6.2). Also, maintenance of the machinery is very important, all equipment must be ready and available. Most molding problems are solved by varying machine conditions and changing mold conditions. However, if the problem persists, the cause and possible solution may be found by examining plastic variables as flow characteristics, melt viscosity at molding temperature and change in viscosity at different flow rates, thermal properties, heat distortion, specific heat, heat of fusion, thermal conductivity, and crystallites start to form, granulation size and shape and granulation lubrication. According to Rosato et al. (2001) it is important to have: a check list of how to solve a problem, such as narrow down the problem to a particular area, that is, machine, mold, operating conditions, material, product design, or management; a plan; watch molding conditions; change one condition at a time; allow sufficient time at each change; keep an accurate log of each change; check housekeeping (Rosato et al., 2001).
1.7. Quality Assurance
Quality assurance can be achieved by implementing quality management systems, which can assist organizations in enhancing customer satisfaction. Customers require products with characteristics that satisfy their needs and expectations, which are expressed in product specifications and collectively referred to as customer requirements. The company should only produce products to their best capability without variance in quality, and final product’s quality should meet what costumers requires, and not what they will accept. Customer requirements may be specified contractually by the customer or may be determined by the organization itself. In any case, the customer determines the acceptability of the product and because customer needs and expectations change, and also due to competitive pressures and technical advances, organizations are driven to improve continually their products and processes. Costumer quality requirements must not vary within the organization. Every product to be sell to the costumer is important and is manufactured using the same methods as any other product. When quality procedures are written, all jobs should require the same degree of supplier quality with a well-established and managed system place. One of the implications is that some jobs may have tighter specifications and they should be meeting on a daily basis schedule. (International for Standardization Organization, 2002 & Jr., 2010).
The quality assurance is secured by using a quality management system, that usually follows the requirements proposed by the ISO 9001:2015 standard (Strong, 2008; CERCO Working Group on Quality, 2000). A quality management system is based on quality management principles (QMP), which are a set of fundamental beliefs, rules and values that can be used as a foundation to guide an organization’s performance improvement. They were developed and updated by international experts of the Quality Management & Quality Assurance (ISO/TC 176), which is responsible for developing and maintaining International Organization for Standardization’s quality management standards. The seven quality management principles are costumer focus (meet customer requirements and to attempt to exceed customer expectations), leadership (establish unity of purpose and direction and create conditions in which people are