A Work Project, presented as part of the requirements for the Award of a Master Degree in Finance from the NOVA – School of Business and Economics.
DIRECT RESEARCH INTERNSHIP
REAL HOLDINGS INTERNATIONAL LIMITED
INVESTMENT FUND STRATEGIC GROWTH PLAN
MANUEL MARQUES RIBEIRO AFONSO #2304
A Project carried out on the Master in Finance Program, under the supervision of: Professor Paulo Soares de Pinho
Investment Fund Strategic Growth Plan
Abstract
The world is changing faster than at any time in documented history; longstanding strategies must change and new investment approaches must be established. The Investment Fund Strategic Growth Plan is intended to accurately shape the new strategy of Real Holdings International Limited, while accounting for the impact of macroeconomic trends in real assets. The flat growth, low central banks’ interest rates and strong prospects in agriculture industry emerge to support an investment proposal in an olive oil production in Alqueva, Portugal. A buy-to-lease strategy with flexible lease agreements was designed to maximize LPs and GPs’ cash flows, while reducing their exposure to the risk inherent to the project. From the financial analysis, Real Holdings concluded that the Alqueva project delivers attractive returns measured by IRR and NPV.
Keywords: Real Assets, Agriculture, Investment Decision, Financial Strategy
Acknowledgements
Foremost, I would like to express my gratefulness to Mathilda Bosch, Tomás Lucena, Marta Canhão and Ana Miranda for the guidance, wisdom and support acknowledged during my internship at Real Holdings. Likewise, I am highly indebted to Nova School of Business and Economics for the supervision of Professor Paulo Soares de Pinho. The Professor has always shown total disposal for counseling meetings, while conducting me towards the right pathway given the difficulties and challenges that emerged along the internship and work project. Additionally, a special acknowledgement to my mother, Helena Margarida Ribeiro, as, without the support received, the work project granted would not be carried out as it was. My gratitude is also expressed to all my family and friends, who have willingly assisted to overcome the arise of difficulties and contributed to improve the final outcome.
Table of Contents 1. Executive Summary ... 4 2. The Company ... 4 2.1 Portfolio ... 5 2.2 Objective... 5 2.3 Strategy ... 5
3. Real Assets vs. Equities ... 6
4. Opportunity Statement ... 7
4.1 Demographic and Social Change ... 7
4.2 Global Economic Power ... 7
4.3 Urbanization ... 8
4.4 Climate Change and Resource Scarcity ... 8
4.5 Technological Innovations ... 8
4.6 Business Need: Fit with Strategy ... 9
5. Real Assets Industries ... 9
5.1 Agriculture ... 9
5.2 Aquaculture ... 10
5.3 Craft Beer ... 11
5.4 Palm Oil ... 12
5.5 Pulp and Paper ... 13
5.6 Outline ... 14
6. Alqueva Project ... 14
7. Agriculture Value Chain ... 16
7.1 Alqueva Project Value Chain ... 16
7.1.1 Risks ... 18
7.1.2 Lease Agreements ... 18
8. Financial Analysis ... 19
8.1 LP/GP Structure ... 19
8.2 Sources and Uses ... 19
8.3 Weighted Average Cost of Capital ... 20
8.4 Inputs ... 21
8.5 Flexible Lease Agreements ... 21
8.5.1 Share of Gross Revenue ... 22
8.5.2 Fixed Cash Lease ... 22
8.5.3 Fixed Lease plus Bonus ... 22
8.5.4 Fixed Lease Profit Share ... 23
8.5.6 Output ... 23
8.5.7 J-Curve ... 24
8.6 Sensitivity Analysis ... 24
8.6.1 Olive Oil Yield and Olive Oil Season Price ... 24
8.6.2 Management Fee and Performance Fee ... 25
8.6.3 Cost of Debt and Debt Ratio ... 25
9. Conclusion ... 26
10. References ... 27
1. Executive Summary
Real Holdings International Limited is an investment company, which is mainly focused in real assets investments. The Investment Fund Strategic Growth Plan consists on the breaking down of the current real assets’ market and the financial analysis of a specific agriculture project in Alqueva, Portugal. The study covers the historic performance of four real assets indexes, such as Dow Jones U.S. REITs, NCREIF Property Index, NCREIF Farmland Index and NCREIF Timberland Index. Over the four-period breakdown in 2010-2015, 2005-2015, 2000-2015 and 1995-2015, these four real assets indexes have outperformed FTSE 100, FSTE All-Share and S&P 500 indexes, being the CAGR the comparative measure. Despite of the historic outstanding performance of real assets, it is fundamental to comprehend if it will keep the same tendency over the subsequent years. From macro to micro, Real Holdings evaluated the analysis of the impact of global trends. For instance, the growth of global population will increase food, water and energy demand while the fast pace of urbanization and disappearance of arable lands will hinder their supply. Long-lasting investment approaches must be replaced by new strategies that include assets by which demand will continue to grow. Real assets’ investments are already presenting signs of attractiveness, as in a study conducted by The Economist Intelligence Unit11, more than half of 201 organizations claimed to increase their
allocation in one or more real assets categories until the end of 2016. Following the remarkable historic performance and the identification of the future global trends, five different real assets’ industries were considered: agriculture, aquaculture, craft beer, palm oil, and pulp and paper. From the five industries analysed, Real Holdings decided, due to strong prospects in the industry, to pursue with the financial analysis of an agriculture olive oil production located in Alqueva, Portugal. It is a unique opportunity to invest, since the low risk/return project profile outweighs the low interest rates that central banks are currently imposing. The company seeks to pursue a buy-to-lease strategy during a holding period of 15 years by acquiring the land and leasing it to an operational company (OpCo). It will compare four possible flexible lease agreements that allow Real Holdings to mitigate part of business risk described by Huirne et al. (2000)36. The company aims to finance the project with debt and equity by following a LP/GP structure to maximize both LPs and GPs’ cash flows.
2. The Company
Established in 2007, Real Holdings International Limited is an entrepreneurial investment company focused on real assets, which can be defined by tangible properties that carry secure financial value throughout its holding period. Real Holdings is primarily attentive to invest in
different asset classes such as real estate, forestry, agriculture, and their associated processing or servicing industries. The company seeks opportunities in Europe and Latin America that strategically fit to strict pre-determined criteria. As for the management team, John Harald Örneberg, the CEO of the group has more than 20 years of experience in the forestry sector. The CFO, Mathilda L. Bosch, worked as a CFO in a major agricultural commodities trading company. The Investment Associate, Tomás Lucena has recently joined Real Holdings and has strong M&A experience from a Portuguese bank.
2.1 Portfolio
Real Holdings is the parent company of an asset manager and is currently developing a real estate project in partnership with a luxury hospitality brand. At the moment, the holding company is evaluating several opportunities in Brazil, Colombia and the Iberian Peninsula with an aggregate equity requirement of almost USD 500 mm.
Real Holdings started its activities in Latin America through Timber Capital Limited (TCL), the asset manager of The Forest Company (TFC), which is a closed-ended investment company listed on the Channel Island Stock Exchange. TFC is focused on the forestry industry, as it has been taking advantage of investment opportunities such as trees, timberland and timber related assets. The company seeks to invest in sustainable, environmental and socially responsible projects. All TFC projects have received or are being evaluated for Forest Stewardship Council (FSC) certification. TCL is currently managing forestry assets with an Adjusted Net Asset Value of USD 254 million as stated on June 30, 2015. TFC’s portfolio includes six projects, four projects in Brazil (67% of portfolio) and two projects in Colombia (33% of portfolio), which account for 74,356 ha in total. The objective of the company is to provide investors an unlevered total IRR of 15% net of expenses, fees and taxes in nominal USD. Timber Capital Limited is responsible for sourcing, evaluating, negotiating, completing and monitoring TFC’s investments by taking into consideration its investment’s policy.
2.2 Objective
Real Holdings’ objective is to invest in real assets that provide shareholders a low risk and long-term stable returns through dividends distributions and growth in capital appreciation. The group aims to invest in projects that can deliver cash flows with a compounded annual growth rate (CAGR) of at least 20.00% to its shareholders.
2.3 Strategy
The company’s focus is driven by projects to be developed and managed by experienced professionals on a sustainable basis. So as to accomplish its strategy, Real Holdings seeks
partnerships with skilled partners or through the acquisition of existing companies. It is attentive to remain focussed in profitability, rather than in pure revenue growth, since its main objective stems from stable cash flows and long-term growth in capital appreciation. Prior to entering an investment, the company defines a clear exit strategy, holding however, a flexible exit tactic throughout the life of an investment, considering the unpredictable changes in the market.
3. Real Assets vs. Equities
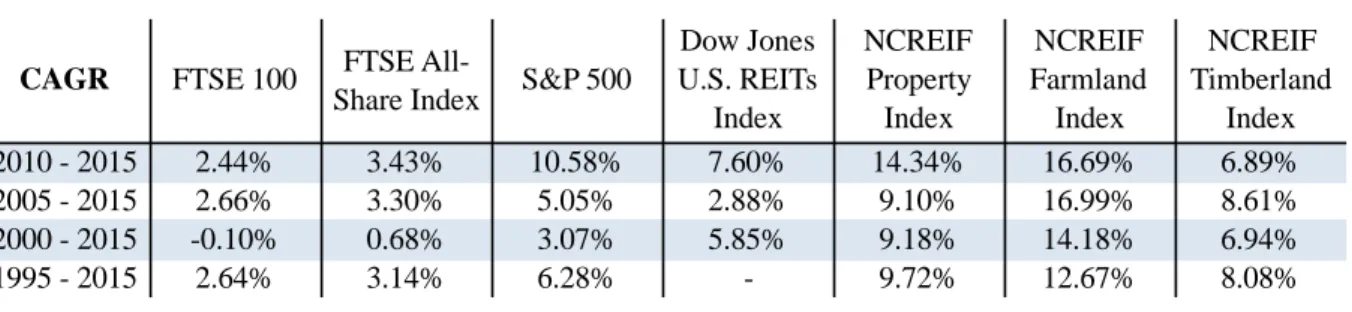
Several investors are reallocating their investment portfolios into real assets within emerging markets to benefit from capital gains driven by macroeconomic trends. Investors are looking for assets able to retain capital value with low, zero or negative correlation with financial markets, as well as to appreciate over long-term with global trends. To compare the performance between real assets and equities, Real Holdings pursued with an investment nominal return analysis, using CAGR as a comparative measure over a four-period breakdown: 2010-2015; 2005-2015; 2000-2015; 1995-2015. The firm exploited seven different indexes: FTSE 100, FTSE All-Share Index, S&P 500, Dow Jones U.S. Real Estate Investment Trusts Total Stock Market Index, NCREIF Property Index, NCREIF Farmland Index and NCREIF Timberland Index.
Table 1 – Real Assets vs. Equities Indexes
Source: Agri Partnership, Why Diversification Matters12
From the results observed on Table 1, real assets have outperformed equities indexes over the four-period breakdown. NCREIF Farmland Index set forth to generate the highest yields, presenting signs of low, zero or even negative correlation with financial markets, as this analysis is taking into consideration the Great Recession of 2007. Nevertheless, real assets share certain drawbacks in terms of liquidity and risk when compared to equities. As for liquidity, the handover of real estate ownership is widely more complex and costly than equities. In terms of risk, real assets carry location, sectorial, operational, asset-specific and third-party risks while equities carry idiosyncratic and systematic risks, even though idiosyncratic risk can be offset with diversification.
CAGR FTSE 100 FTSE
All-Share Index S&P 500
Dow Jones U.S. REITs Index NCREIF Property Index NCREIF Farmland Index NCREIF Timberland Index 2010 - 2015 2.44% 3.43% 10.58% 7.60% 14.34% 16.69% 6.89% 2005 - 2015 2.66% 3.30% 5.05% 2.88% 9.10% 16.99% 8.61% 2000 - 2015 -0.10% 0.68% 3.07% 5.85% 9.18% 14.18% 6.94% 1995 - 2015 2.64% 3.14% 6.28% - 9.72% 12.67% 8.08%
4. Opportunity Statement
In order to better perceive in which real assets, from different industries, Real Holdings should invest in, it becomes crucial to recognize the demographic, economic, urbanization, climate change and technological trends, as well as their respective impacts. These trends suggest an outlook of the way it might impact businesses, societies, economies, cultures and personal lives over the following years. Based on several reports, Real Holdings probed the main trends that will most affect its business in the long-term.
4.1 Demographic and Social Change
According to an EY report1, global population is expected to increase over 8.5 billion until 2030. In order to feed and satisfy the demand from the population disregarding limitations in natural resources and arable lands, food, water and energy must increase by 35%, 40% and 50% respectively, by 2030, accordingly to PwC2. KPMG report3 states that the number of
people aged 65 and over will double to 1 bn by 2030, implying an overall fall in market productivity and an emergence of new technology to replace human force. Also, 60% of the world population will be middle class and 80% of it will reside in developing countries. As a consequence, alongside with the diminishment of income inequality, these trends will result in a vehicle of growth for developing countries. According to Frost & Sullivan’s report4, it is expected that around 30% of the worldwide population is expected to constitute the Millennials generation, by 2020 and, according to a Bentley University’s Survey5, 67% of Millennials reported that their goals comprise of starting their own business. Governments will assist the launch of new businesses and contribute to scale them with regulations, such as funding alternatives, mentoring, tax incentives and entrepreneurial education systems.
4.2 Global Economic Power
PwC predicts6 that the E7 countries (Brazil, China, India, Indonesia, Mexico, Russia and South Korea) will have larger economies than the G7 countries (United States of America, Germany, Canada, France, Italy, Japan and United Kingdom), by 2020. As a result, the gap between developing and developed countries may diminish and there will be an incentive to develop new hubs with lower or zero tariffs. EY forecasts1 that the total annual consumer
spending in developing countries will be USD 63 tr by 2030, comparing to the USD 12 tr in 2014. The rise on populations’ incomes is increasing the demand for food that require high levels of water and energy to be produced, such as vegetable oils, fish, meat, dairy and sugar. Much of this growth will come from developing countries like Brazil, which has the largest area in the world with arable land and one of the biggest fresh water reserves. According to
Frost & Sullivan report7, global online retail sales aim to reach USD 4.3 tr by 2025,
accounting for around 19% of total retail. This trend will impact the timber industry by increasing the demand of paper-based packaging, such as boxes and packaging papers.
4.3 Urbanization
Frost and Sullivan report4 foretells that there will exist more than 40 smart cities by 2025. As the pace of urbanization increases over years, the integration of core city with daughter suburbs is expected to be a consequence. Additionally, this trend implies the need for large-scale infrastructures, which will negatively impact natural resources with the decrease of arable lands. KPMG expects3 that around 80% of all urban growth will take place in Africa and Asia, contributing to the shift in Asia’s economic power. Also, around 66% of the world’s population will live in cities by 2050, out of 54% in 2014. The shift from rural to urban zones will likely decrease the available labour force for agriculture work, reinforcing the need for technology emergence to substitute human work force.
4.4 Climate Change and Resource Scarcity
Real assets are identified throughout the research as increasingly exposed to the risk of physical damage caused by climate change. According to KPMG3, CO
2 emissions are already
14% higher than the estimated emissions levels required to meet the 2020 goal. Besides, cities are currently consuming and being responsible for 60% to 80% of global energy and CO2
emissions. Effects of climate change, such as the upsurge in occurrence of extreme natural events, rise of temperature, changes in rainfall patterns, rise of sea level, droughts and lessening of global resources, will turn green, smart and zero concepts critical. The development of zero emissions technologies will grow exponentially over the years. As the International Energy Agency predicts8, the annual global investment in energy efficiency will increase from USD 130 bn today to more than USD 550 bn by 2035. Over the last century, water usage has been raising more than the double of population growth. The United Nations reported9 that, by 2030, the demand for water may exceed around 40% of future supply, and water absences could affect almost half of the world’s population. Thus, food demand will be even more problematic to satisfy, as natural resources are scarce and agriculture is the major consumer of freshwater, accounting in some regions for 70% of total drawings.
4.5 Technological Innovations
According to an EY report1, by 2018, around 30% of the top 20 firms within the majority of
industries will be disrupted by industry-specific data platforms. Several companies are already acquiring and implementing technologies into their businesses to maximize production,
profitability and to avoid losing market share against their competitors. For instance, precision farming, defined as the real time data gathering and analysing techniques to maximize production, minimize costs and predict accurately environmental changes, will be one of the most influential trends affecting farming practices across 2030. Plus, EY expects that over the next 20 years, 47% of jobs in developed economics are at high risk of becoming automated. The impact from the emergence of new technologies will not be merely negative to the labour market, since new prospects will arise for the future’s development. It will allow automatic production, resulting in cost reductions and higher productivity. McKinsey & Company reported10 that by 2030, 10% to 50% of total cars sold will be electric vehicles and up to 15% will be autonomous. Gas stations and fossil fuels will lose market share, due to the future need to supply demand for electricity.
4.6 Business Need: Strategic Fit
The world is currently changing faster than heretofore. Longstanding investment approaches must change, and new strategies and approaches must be established. Investors who seek to safeguard and grow their capital, the highlighted global trends must be taken into consideration in their investment decision making. According to BlackRock’s survey11 to 201 organizations conducted by The Economist Intelligence Unit (EIU), nearly half have increased their allocations to at least one real asset category from 2011 to 2014. These investors have been driven by the ultra-low interest rates, stagnant growth and ongoing macroeconomic uncertainty. From 2014 until the end of 2016, more than half of the respondents claimed to increase their allocation in one or more real assets categories due to their macroeconomic outlook and their desire to upturn returns. In the present-day of flat growth and low interest rates, should we remain relying on the performance of financial markets to carry growth or should we reallocate investments in the assets for which demand will continue growing?
5. Real Assets Industries
Once the opportunity statement for real assets was successfully identified, Real Holdings investigated five main sectors and industries that seemed to be appealing to invest in. In order to understand which projects from agriculture, aquaculture, craft beer, palm oil and pulp and paper could be the most attractive to invest in, the group analysed their current and future markets trends.
5.1 Agriculture
The current post-crisis atmosphere has been attracting investors to real assets, namely to agriculture. The investors’ desirability stems from maintaining portfolio value throughout
periods of volatility while reducing the reliance on financial markets performance. The Farmland Property Index, managed by NCREIF, covers 548 properties mostly owned by pension funds. From 2005 to 2015, the index outperformed S&P500 with a CAGR of 16.99% versus 5.05%, respectively12. The World Bank estimates13 that the agriculture market value
has been growing at a CAGR of 5.70% from 2007 to 2015, with a global market value of USD 3.19 tr in 2015. Preqin’s database tracks over 170 fund managers in the sector and has recently reported14 that the number of funds reaching a final close with an aggregated capital augmented notably between 2009 and 2015. In 2009, five agriculture/farmland funds raised USD 0.5 bn in aggregate capital, comparing to 2015 when nine agriculture/farmland funds raised USD 3.9 bn in aggregate capital (refer to Appendix 8 for a detailed description of this graph). These funds have committed most capital in North America (37%), followed by multi-regional placement (27%), Asia (11%), Australasia (7%), Latin America (6%), Middle East (6%) and Europe (2%). Presently, there are 36 agriculture/farmland funds targeting to raise a total of USD 7.5 bn in aggregate capital. In order to meet the increase in food demand due to population growth, FAO estimates15 that agriculture needs to increase by 60% until 2050, denoting annual investments of USD 83 bn until 2050. Also, global arable land is expected to expand by 70 mm ha, which is driven by the increase of 120 mm ha in developing countries and the decrease of 50 mm ha in developed countries. Most of the expansion of arable land in developing countries would occur in sub-Saharan Africa and Latin America. Thus, PR Newswire research16 forecasts smart agriculture market to grow at a CAGR of 13.8% from 2016 to 2022, reaching a market value of USD 18.45 bn.
From global trends, agriculture industry will face an upsurge in food demand caused by the population growth. It is important to take into consideration that both arable lands and natural resources are limited and are becoming scarce. To better satisfy the upcoming rise in food demand, the limitations associated to its production and the reduction of the available labour force, technology will need to enter the equation. Technology will play a crucial role to improve the efficient use of resources, replace human labour, accurately predict weather and natural events, improve productivity, as well as to reduce both costs and waste.
5.2 Aquaculture
Fish food is defined as one source composed by high quality proteins with amino acids, healthy fats, vitamins and minerals. According to FAO17, in 2014, aquaculture accounted for closely 45% of the world’s food fish with a global total capture fishery production and aquaculture production of 93.4 mm tonnes and 73.8 mm tonnes, respectively. From 2009 to 2014, fish has been the most highly traded food commodity with production and consumption
growing at a CAGR of 3.47% and 4.26%, respectively. As for fish production from 2009 to 2014, aquaculture has been exhibiting indications of strong prospective by growing at a CAGR of 7.29% compared to traditional capture with a CAGR of 0.88% (refer to Appendix 9 for a detailed description of this table). China exported USD 20,980 mm in 2014, which was the country that exported more fish and fishery products, followed by Norway and Vietnam with USD 10,803 mm and USD 8,029 mm, respectively. Nonetheless, Northwest Pacific presented to be the most productive area for captures fisheries, followed by the Western Central Pacific, the Northeast Atlantic and the Eastern Indian Ocean. FAO forecasted the world fishery production to reach to 196 mm tonnes by 2025, increasing 17% from 2015 to 2025 mostly driven by developing countries. By 2025, Asian countries are expected to represent nearly 90% of total fish production, whereas China will account for 62% of the world output. Overall, Zion Market Research predicts18 the global aquaculture market to produce USD 210 bn in 2020, comparing to USD 156 bn in 2015 (refer to Appendix 10 for a detailed description of this graph). In developed countries, consumption patterns are being affected by sustainability concerns, particularly by animal welfare and food care. Thus, the number of certified farmers is growing exponentially given the opportunities to enter new markets, adopting best industry’s practices with efficient uses and better control of diseases. Similarly to agriculture, the aquaculture industry will face similar impacts and changes triggered by global trends. Furthermore, income inequality is diminishing from the expansion of developing countries, which is slowly contributing to the consumption of enhanced aquaculture products, such as salmon. The transformations caused by climate change, as the rise of temperatures and sea level, will increase water asset value, change fishes’ lifetime patterns and contribute to shift from capture to aquaculture production.
5.3 Craft Beer
According to the Beverage Information Group19, the U.S. retail beer sales by volume decreased 1.4% from 2010 to 2015 and 3.0% from 2014 to 2015 due to lower consumption trends, health awareness and a shift to spirits and wine drinks. Even though, according to the Brewers Association20, the U.S. craft beer market share of the whole beer industry ascending from 5.7% in 2011 to 12.2% in 2015. In the last year, craft brewers produced 24.5 mm barrels; representing a 13% increase in volume and 16% rise in retail market value. Its retail market was valued at USD 22.3 bn in 2015, which characterized 22.1% of total retail beer market. The M&A level of activity in this industry has been high due to strong expectations in market share growth. Over 2015, the number of U.S. operating breweries grew by 15%, totalling 4,269 breweries (refer to Appendix 11 for a detailed description of this graph). According to
Financial Times21, craft beer sector has been growing at an approximately CAGR of 8% over
the last five years, however, the industry has recently showed signs of market maturity as sales growth declined sharply from 15% in 2015 to 7.5% in 2016 (refer to Appendix 12 for a detailed description of this graph).
AAWE22 claims that Latin America represented approximately 16% of the beer world market in 2015. The average market share for small and microbreweries in Latin America, between 2008 and 2013, was 3.1%, wherein Colombia represented only 0.3% on average. Nevertheless,
Google Trends found out that the interest for “craft beer” term in Spanish and Portuguese has
grown 212% from 2010 to 2015. In Brazil, a portion of more than 200 registered microbreweries are growing craft beer sales at 20% to 40% per year, wherein 61% of its consumers are aged between 25 and 44 years old. Yet, based on Euromonitor23, the beer volume and its production decreased approximately 3% and 2%, respectively, exhibiting fragile signs affected by the global economy slowdown.
Concerning the relation between craft beer and global trends, it can be described as a cyclical industry already showing some signs of maturity in specific countries. Nonetheless, due to the rise of the Millennials’ generation in global population, it will be able to capture this tendency, as this generation is the major craft beer age group consumer. A vast percentage of the Millennials’ generation will tend to start their own business with government support, which means that entrepreneurship in craft beer industry may also capture the opportunity and contribute to the rise of market share within the beer industry.
5.4 Palm Oil
Palm oil upsurges as one of the lowest cost and most efficient oils to be produced, since one ha is able to produce up to ten times more than soybean, sunflower or rapeseed oils. Over 2015, it was the most consumed oil in the world with a considerably difference from other oils (refer to Appendix 13 for a detailed description of this graph). According to Grand View Research24, global palm oil market is estimated to grow at a CAGR of 7.5% until 2022, reaching a valuation greater than USD 100 bn. FAO25 estimates exportations in developing countries of oilseeds and vegetable oils to threefold by 2050 due to population growth. It is used in approximately 50% of packaging products in food service, pharmaceutical and industrial productions. Nevertheless, its production is extremely harmful, since it is related to deforestation, climate change, and habitat degradation, among others. As such, reputable brands26 such as Kellogg’s and Johnson & Johnson are currently looking for agreements with sustainable palm oil, due to the growth of detrimental practices in the industry. Globally, the major standard certification for sustainable palm oil production, Roundtable on Sustainable
Palm Oil (RSPO) 27, has certified 2.93 mm ha accounting for 17% of global palm oil
production, 11.45 mm tonnes. RSPO forecasted demand for sustainable palm oil to double over the next 5 years. RSPO has certified around 23,000 ha of palm oil in Colombia, where nearly 30,000 ha are still available for the same purpose. According to the United States Department of Agriculture (USDA) 28, Indonesia and Malaysia account for 54.27% and 31.01% of global palm oil productions in 2016, respectively. Colombia is the largest producer in South America, even though it only accounts for 1.98% of global palm oil production (refer to Appendix 14 for a detailed description of this chart). Despite of, William Granados Perez, Colombia’s Ministry of Agriculture29, affirmed that the government aims to increase palm oil
plantations by 150,000 ha over the next three years.
Palm oil industry is one of the industries that will be more affected by global trends. As aforementioned, palm oil prevails in more than half of packaging products among several industries. The upsurge in food and consumer goods demand that utilize palm oil in its production will not also be affected by the rise of population growth, but also by the rise of populations’ income. Notwithstanding, the intersection between the harmful palm oil production and the changes in government regulations from climate change will certainly impact the industry. As such, sustainable palm oil production will present itself to be a solution, as major companies are already fulfilling its demand.
5.5 Pulp and Paper
Newsprint, printing and writing paper markets are stagnating due to digitalization, however, packaging, tissues and other materials demand are rising driven by the increase in demand for paper-based packaging. According to Statista30, sales in printing papers have been growing at a CAGR of 0.75% from 2009 to 2015, while paper-based packaging grew at a CAGR of 4.65%. In 201431, the world paper and board production was mainly in Asia with a share of 45.9%, followed by Europe, North America and Latin America with 26.2%, 20.7% and 5.2%, respectively. According to FAOSTAT32, the average production of pulp for paper from 2010 to 2015 in U.S. and China was nearly 50 mm tonnes, in each country. It is more than the double produced by their peers as Canada and Brazil, given that these countries produced, on average, 18 mm tonnes and 17 mm tonnes, respectively. Exports of pulp from 2014 to 2015 increased by 6.0% and 2.1% in North America and Latin America, respectively; while in Asia there was a decrease of 4.0%. Nevertheless, pulp imports from 2014 to 2015 decreased by 9.4% in North America, while in Latin America and Asia there was an increase of 5.7% and 120.9%, respectively. Financial Times33 predicts Chinese pulp demand to grow between around 4% to 8% from 2015 to 2018, while demand in North America and Europe will remain
considerably flat. In Latin America, pulp demand is forecasted to grow at a low rate of 0.3% until 2017, even though it is expected to grow 2.3% in 2018 (refer to Appendix 15 for a detailed description of this graph).
Pulp and paper industry will have similar global trends impacts as agriculture in terms of diminishment of available labour force and automation of production process. Also, it is an industry that faces high risk implied by the possible technology disruption in printing sub-sector, as several consumers are already substituting paper by computers, tablets and smartphones. Nevertheless, paper-based packaging sub-sector will increase market share in pulp and paper industry, due to the rise of online retail sales. The opposite tendencies from printing and paper-based packaging sub-sectors will offset each other while making pulp and paper demand grow in specific regions, particularly in Asia and Latin America.
5.6 Outline
From the market analysis of the five industries selected, Real Holdings was able to comprehend that most of them will grow over the subsequent years. Agriculture, aquaculture and palm oil will face an increase in food and consumer goods’ demand due to the rapid population growth over the next years. Craft beer is already presenting signs of maturity in certain countries, although it is an industry that will tend to rise due to the increase Millennials generation in population. Pulp and paper industry will face dissimilar trends on different sub-sectors, yet the whole industry is expected to grow in some regions.
Real Holdings will only pursue the financial analysis of one industry’s project, due to company’s limitations. Taking into consideration each industry, the company decided to evaluate an agriculture project in the south of Portugal, Alqueva, in light of the local presence with an office in Lisbon, extensive know-how and strong prospects in agriculture industry. Furthermore, the low agriculture’s risk/return profile outweighs the current conditions that central banks are offering. Currently, the European Central Bank (ECB)34 and the Federal Reserve System (Fed)34 do not present to be very attractive to invest, since their interest rates are at very low levels. The ECB is currently extending the program of quantitative easing by lowering the interest rates at a rate of 0.00%. As for Fed, besides the fact that interest rates increased from 0.50% to 0.75% in December 14, 2016, it remains to be an extremely low rate.
6. Alqueva Project
Real Holdings is seeking to invest in an agriculture project through its asset manager subsidiary, Timber Capital Limited. The company is looking to invest in olive oil in Alqueva region considering the narrow window of available land and excellent soil growing conditions
for high value agriculture, such as olives, walnuts and almond. According to International Olive Council35, the European Union (EU) is the leading producer and consumer of olive oil.
From 2010/2011 to 2014/2015, the EU produced and consumed 69.6% and 56.6% of the world’s olive oil, respectively. The vast olive oil market in EU, together with the easy transaction between EU countries and excellent growing conditions in Alqueva, make this a unique opportunity to invest in olive oil production.
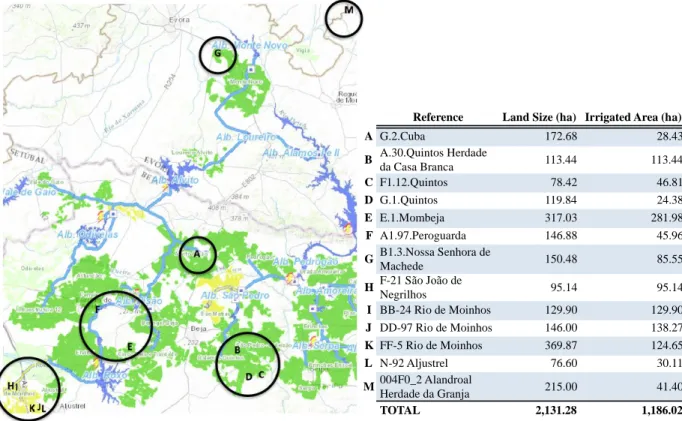
Alqueva Multi-purpose project was built, executed and operated by EDIA (Empresa de Desenvolvimento e Infra-Estruturas do Alqueva, S.A.), having been developed to irrigate 120,000 ha of lands located around the Alqueva dam supplied by Rio Guadiana. The Alqueva Global Irrigation System dam is the largest water reserve in Western Europe and it is in a strategic geographical position, with excellent road infrastructures on the Iberian Lisbon-Madrid, Lisbon-Algarve and central Portugal-Algarve corridors. It has a water storage capacity of 4.15 bn m3, which ensures water availability for four consecutive years even during periods of extreme drought. The Alqueva region enjoys a Mediterranean climate, with an average annual temperature of 17ºC, rainfall of 572 mm per year and an annual average of 3,000 hours of sunshine, which has a remarkable potential to develop a wide range of crops, especially olives. Currently, EDIA has an approved project with expected completion date of 2021 to expand the Alqueva irrigating system by 50,000 ha and between 30,000 to 40,000 ha in other regions throughout Portugal.
Figure 1 – Land Available for Sale in Alqueva Scale (m): 1:577,791
Reference Land Size (ha) I rrigated Area (ha)
A G.2.Cuba 172.68 28.43 B A.30.Quintos Herdade da Casa Branca 113.44 113.44 C F1.12.Quintos 78.42 46.81 D G.1.Quintos 119.84 24.38 E E.1.Mombeja 317.03 281.98 F A1.97.Peroguarda 146.88 45.96 G B1.3.Nossa Senhora de Machede 150.48 85.55 H F-21 São João de Negrilhos 95.14 95.14 I BB-24 Rio de Moinhos 129.90 129.90 J DD-97 Rio de Moinhos 146.00 138.27 K FF-5 Rio de Moinhos 369.87 124.65 L N-92 Aljustrel 76.60 30.11 M 004F0_2 Alandroal Herdade da Granja 215.00 41.40 TOTAL 2,131.28 1,186.02
From the 120,000 ha of Alqueva’s irrigated areas, 2,130 ha of privately owned land were identified for sale by EDIA in Figure 1. To better understand how the group should invest in olive oil production in Alqueva, Real Holdings followed the analysis of each stage throughout the agriculture value chain analysis.
7. Agriculture Value Chain
Michael Porter, economist, author, researcher, and professor at Harvard Business School, coined the value chain term in the “Competitive Advantage” book published in 1985. Porter’s value chain analysis stems from a set of activities that companies conduct to generate value for its customers. It has been used across numerous organizations to understand how to create and increase value, so as to develop competitive advantage. Subsequently, the concept has been shaped for farming development purposes to describe and analyse the range of proceedings that carry farmed products from initial production to the final consumption. Based on farming value chains from FAO, World Bank and A.T. Kearney, Real Holdings developed its own with six main stages:
Farmland: acquisition of arable land and leasing it to an operating company; Farming: cultivate and produce specific or a variety of agricultural products; Technology: investments to improve productivity, efficiency and reduce costs; Processing: acquisition of mills or facilities to process products;
Trading: buy-and-sell seeds or crops to a variety of customers;
Infrastructure: investment in rural roads dedicated to link areas to markets, storage facilities or transport logistics.
Real Holdings will not pursue the analysis of trading since it does not add value and the group invests only in real assets, nor with infrastructure, as it requires high investment and large long-term holding period.
7.1 Alqueva Project Value Chain
Beginning with the first stage of agriculture value chain, the group would follow a buy-to-lease strategy. It would acquire agricultural land and pursue a long-term buy-to-lease contract with an experience operator responsible for managing daily operations. The operational partner, OpCo, should be able to guarantee liquidity for the lease agreement through the successful operation of the plantations, since it would own the plantations, irrigating systems, machinery and manage daily operations. Real Holdings would benefit from a reduced project risk, since it
is owned and managed by two different parties. It is a project with low risk and medium return due to operational risk mitigation and low probability of land value depreciation.
Secondly, the company could cultivate and produce olive oil by hiring an operational team responsible for the whole process of production. In this case, the group would need to support several costs such as land acquisition, plantations, irrigating systems, machinery and hire employees. It is relatively similar to the farmland alternative, however the company would not mitigate the production risk. As such, this alternative presents a medium/high risk with a medium return.
Thirdly, Real Holdings could invest in agriculture technology, more specifically in precision farming. It is a technology that allows farmers to apply data analytics and remote control to farming production to rise yields efficiently. Precision farming tracks and calibrates tractor movements to minimize fuel and fertilizer waste while improving productivity. There are several small technological companies developing precision farming and looking for investments, which would make Real Holdings to act as a Venture Capital investor. Nevertheless, agriculture market is vast but fragmented, meaning that technological companies would not be able to scale the market straightforwardly. It is a project that comprises high risk with a medium return.
Fourthly, Real Holdings could invest in a facility to process and transform olives into olive oil. The project would function in a sustainable basis, since the water used to clean the olives would be filtered and recycled. Similarly, this alternative would allow the company to use the core of olives as fuel source to generate heat, and to sell mulch and biomass for following use and energy production, respectively. Nonetheless, current demand in Iberian Peninsula is already fulfilled by companies, such as Elaia from Sovena Group and De Prado.
After considering the four stages among the agriculture value chain, Real Holdings decided to evaluate financially the farmland option. For this specific project, farming does not fit with Real Holdings’ requirements since the company desires to mitigate the production risk. Investing in technology does not fit either, as the agriculture market is not scalable. As for olive oil processing investment, it is alike technology in terms of company’s requirements, as there is no opportunity available in the market.
Investing in farmland would take 1 to 1.5 years to source and execute, as the company would need to identify existing lands for sale, find the appropriate operational partner, raise capital from traditional agriculture investors, acquire identified lands and establish a lease agreement with an OpCo. The holding period would be 15 years where on year 14, the company would
decide whether to hold or to exit the deal. If exit, the group would need to identify a large agricultural fund or an industrial operator to sell the land.
7.1.1 Risks
Huirne et al. (2000) 36 describes two principal risks in his paper, “Risk and risk management in agriculture: an overview and empirical results”, business and financial risks. Firstly, business
risks include production, market, institutional and personal risk. Production risk covers crops performance, crop diseases and unpredictable weather events. Market risk includes changes in prices, both when acquiring products and selling crops. Institutional risk consists in government law changes regarding the use of chemicals, tax requirements and expenditures. Personal risk involves the likelihood of workers no longer being available to provide management or labour. Secondly, financial risks cover the effect of financing strategies, such as the unavailability of meeting financing debt payments when using leverage, changes in debt interest rates and absence of capital distribution to equity holders. Alqueva project faces all risks described above by Huirne et al. (2000)36, however farmland value chain alternative comprises an additional risk from operational partner that the group must take into consideration. The establishment of an agreement with a precise operational partner able to meet lease obligations is crucial for Real Holdings to pursue the project.
7.1.2 Lease Agreements
Edwards and Chad (2013) 37 explain how to mitigate risk in agriculture using a flexible lease agreement in their paper. From the information assessed, Real Holdings shaped four possible lease agreements between the group and the OpCo for farmland value chain alternative: share of gross revenue; fixed cash lease; fixed lease plus bonus; fixed lease profit share. Share of gross revenue comprises in pre-determining a share of the gross revenue of the annual crop to be paid as a flexible lease agreement. This allows Real Holdings to capture higher returns when crop revenues are strong while maintaining OpCo returns when crop revenues are weak. Fixed cash lease consists in agreeing a fixed annual lease payment during each year of the investment-holding period. In this case, Real Holdings would determine the annual lease as a percentage of the land annual value, being the land annually appreciating at inflation-based rate. Fixed lease plus bonus is an agreement that gathers both previous lease agreements, by determining the lease as a percentage of the land annual value, and as of the annual revenue. For this lease agreement, Real Holdings introduced a bonus, wherein the percentage of annual revenues can decrease if the OpCo’s revenues surpass a stipulated benchmark. Fixed lease profit share works similarly as fixed lease plus bonus, however the OpCo does not have a performance-based bonus and Real Holdings shares a percentage of OpCo’s total operating
costs. This option allows the OpCo to mitigate part of the risk by transferring it to Real Holdings.
8. Financial Analysis
The Alqueva project’s farmland option will follow a financial analysis with a Discounted Cash Flow (DCF). During a holding period of 15 years, Real Holdings will proceed with a buy-to-lease strategy in 2,130 ha by acquiring the land, leasing it to an operating company and exit through the asset sale. For this valuation, the company will analyse the four flexible lease agreements described above to compare and decide which lease should ensue.
Real Holdings will finance the project with debt and equity by following a typical LP/GP strategy to maximize returns. To better grasp and compare the financial value from both alternatives, Real Holdings will analyse the perspective of the OpCo, Real Holdings Project, Limited Partners (LPs) and General Partners (GPs) by using Internal Rate of Return (IRR), Net Present Value (NPV) and Payback year as the main comparative measures. Note that Real Holdings is not taking into consideration how OpCo will finance the project, meaning that OpCo’s NPV will be discounted at an unlevered discount rate. Lastly, the group will proceed with a sensitivity analysis while considering the most important variables from an olive oil production.
8.1 LP/GP Structure
The Alqueva project is following a LP/GP structure; where General Partners (GPs), management board, are responsible for managing the project and Limited Partners (LPs), traditional agriculture investors, invest most of the equity. As such, GPs are paid an annual management fee of 1.25% of the LPs’ initial investment. The management fee equals €73,219 and is annually paid during the holding period of 15 years. Additionally, GPs are entitled to receive a performance fee in respect to the annual IRR. The company predetermined a hurdle rate of 5.00% by which GPs will receive the performance fee if the annual IRR exceeds the hurdle rate. The performance fee equals to 10.00% of LPs’ equity, due to the low complexity of managing the project.
8.2 Sources and Uses
Real Holdings will acquire land using both debt and equity at a cost of €10,000 per ha, totalling €21,300,000 for the investment. The capital structure that Real Holdings typically uses to finance its projects is 70.00% of debt and 30.00% of equity. As such, it will follow the same capital structure to finance this project.
Starting with debt (70.00%), the group is only considering senior debt with the land as collateral to secure the loan. It will follow an amortization schedule and maturity of 15 years. The cost of debt assumed is 4.25% with a grace period of 3 years, which is being used to offset the negative effect in year 1 and year 2 from olive harvest that will be subsequently explained. As for equity (30.00%), 27.50% (91.67% of equity) is financed through LPs and the remaining 2.50% (8.33% of equity) through GPs.
Since the land acquisition accounts for €21,300,000, senior debt will finance €14,910,000 and equity €6,390,000. The equity is financed through LPs and GPs, €5,857,500 and €532,500, respectively. Lastly, both debt and equity will be 100.00% drawdown in year 0, as the group will acquire the land in this same period (refer to Appendix 1 for a detailed description of this model).
8.3 Weighted Average Cost of Capital
In order to calculate discount rates for the OpCo, Real Holdings Project, LPs and GPs, the company extracted data from Aswath Damodaran farming/agriculture sector as the date of November 29, 2016. As for the risk-free rate, Real Holdings is considering the Germany Bund 10 Years Yield (GTDEM10Y:GOV) of 0.22% as the date of November 29, 2016.
The OpCo’s cash flows will be discounted at an unlevered discount rate since Real Holdings is not considering how OpCo will finance the project. To calculate the unlevered discount rate, the company is using the following data from Aswath Damoradan: risk-free rate of 0.22%; country risk premium (Portugal) of 3.41%; market risk premium (Europe) of 7.93%; and unlevered farming/agriculture beta of 0.361529112. The unlevered discount rate calculated equals 6.50%.
Nevertheless, Real Holdings Project will be discounted at the Weighted Average Cost of Capital (WACC) rate since the capital structure must be taken into consideration. The cost of debt assumed is equal to 4.25%. The cost of equity was calculated with the same data used for the unlevered discount rate, however the company had to calculate a levered beta while taking into consideration D/E ratio and income tax. The D/E ratio (70.00%/30.00%) is equal to 233.33% and the income tax assumed is 21.00%. The cost of equity calculated is equal to 11.78%. As such, with a cost of debt of 4.25% and a cost of equity of 11.78%, the WACC is equal to 5.89%.
Lastly, both LPs and GPs’ cash flows will be discounted at the cost of equity previously explained, 11.78%, as they are solely investing in equity (refer to Appendix 2 for a detailed description of this table).
8.4 Inputs
It is fundamental to understand the drivers, inputs and assumptions of an olive oil production. For specific calculations that will be explained later, Real Holdings is considering the Portuguese inflation equal to 1.25% since this rate is the average from 2016 to 2018 forecasted by the European Commission38. Real Holdings contacted Sovena Group, EDIA and AGRO.GES to better analyse the olive oil project in Alqueva, Portugal. The group is evaluating the project in 2,130 ha using a Super-Intensive Irrigation System, which is a system that can carry a maximum of 1,500 olive plants per ha. According to EDIA39, each olive plant has an average cost of €2.50 and, generally, they start to harvest on year 3. Olives reach their full harvesting period after 5 years of plantation, where a Super-Intensive Irrigation System can reach a total of 12,000 olive kg per ha. As such, the company is considering that olives do not fully harvest during their first year (year 3) and considered the following assumptions: 50.00% of full harvest on year 3; 75.00% of full harvest on year 4; and 97.50% of full harvest on year 5 and over. The 2.50% remaining are not being considered to harvest, due to production risks, such as crop performance, crop diseases and unexpected weather events. Regarding the olive to olive oil transformation, Real Holdings is considering an olive oil yield of 17.50%, meaning that 1,000 olive kg can produce 175 olive oil kg. Lastly, the group is considering an olive oil season price40 of €3.00 per kg (refer to Appendix 3 for a detailed
description of this model).
8.5 Flexible Lease Agreements
The OpCo’s DCF will be calculated with an olive oil operating model designed by Real Holdings, as it is fundamental to understand OpCo’s annual operations for the lease agreement (refer to Appendix 16 for a detailed description of calculations). Note that all lease agreements considered will only start to be paid when olives start to harvest, on year 3. Also, accordingly with the Portuguese law for SME, the company is considering tax-loss carryforward by carrying losses for a maximum of 12 years that cannot exceed 70% of taxable profits. It is important to note that Real Holdings is evaluating the project during the holding period, 15 years, without any terminal value. The OpCo’s NPV will be calculated with an unlevered discount rate of 6.50% (refer to Appendix 4 for a detailed description of model).
As for Real Holdings Project’s DCF, it will have revenues from the lease agreement and land sale, and CAPEX from the land acquisition. Since the land is not depreciable, Real Holdings will not have depreciations and amortizations. Real Holdings is assuming the value of the land to rise annually at inflation-based rate by selling it in year 15 at €25,662,861.60. Note that the
land sale will be subject to income tax on capital gains, which is the difference between the land sale and land acquisition. Real Holdings Project’s NPV will be estimated by discounting these cash flows at the WACC of 5.89% aforementioned (refer to Appendix 5 for a detailed description of this model).
Due to seniority of debt, the cash flows will be used to first repay senior debt and then to distribute capital to equity holders. The cash flow available to equity holders will be annually distributed accordingly to LPs and GPs’ share of equity, 91.67% and 8.33%, respectively. Real Holdings is assuming capital distribution net of the Portuguese withholding tax of 28.00%. Notwithstanding, LPs will pay the annual management fee and performance fee to GPs. The NPV of both LPs and GPs will be discounted at the cost of equity of 11.78% aforesaid (refer to Appendix 5 for a detailed description of this model).
8.5.1 Share of Gross Revenue
Real Holdings is considering an annual lease agreement equal to 21.00% of the OpCo’s gross revenue. Despite of being a lease that enables LPs and GPs to benefit from attractive returns, it is considerably risky. Share of gross revenue lease does not mitigate business risk described by Huirne et al. (2000)36 and it is totally dependent from OpCo’s operations performance. Both LPs and GPs are entirely exposed to all risks described in section 7.1.1. On the other hand, it is substantially advantageous for the OpCo, since this lease agreement does not overweight OpCo’s operating lease expenses during weak crop seasons. As a result from the high attractiveness for the OpCo, both LPs and GPs would benefit out of it, as the OpCo would be incentivized to maximize returns.
8.5.2 Fixed Cash Lease
Real Holdings is considering an annual lease agreement equal to 11.50% of the land annual value, being the land annually appreciating at inflation-based rate38 of 1.25%. Fixed cash lease
is undeniably a lease that satisfies part of Real Holdings’ requirements by mitigating the production risk. Yet, it does not permit LPs to take advantage from the GPs’ good management. LPs and GPs’ cash flows will solely vary accordingly with inflation, which is a rate that, in Portugal, does not present signs of high fluctuations. In terms of the OpCo’s perspective, it allows to capture all returns from the excellent OpCo’s performance and GPs’ management, as the OpCo would not mitigate any risk from its production.
8.5.3 Fixed Lease plus Bonus
Real Holdings is considering an annual lease agreement equal to 7.50% of gross revenue and 5.00% of the land annual value. Nevertheless, the company has a bonus discount of 2.50% in share of gross revenue when OpCo’s exceed annual revenues in €12,500,000, which in this
case occurs on year 6. It is deliberated as a very appealing lease agreement, since it takes together both previous leases by offsetting their drawbacks. Fixed lease plus bonus lease agreement mitigates part of business risk described by Huirne et al. (2000)36 with land annual
value and, at the same time, allows LPs to have high returns from the excellent OpCo’s operations performance and GPs’ management. Due to the performance-based bonus, the OpCo will always seek to perform better to reduce the percentage of share of gross revenue. At the same time, it permits the OpCo to underweight operating lease expenses during weak crop seasons.
8.5.4 Fixed Lease Profit Share
Real Holdings is considering an annual lease agreement equal to 17.50% of gross revenue and 5.00% of the land annual value. For this lease agreement, Real Holdings will pay 10.00% of OpCo’s operating expenses to mitigate some of OpCo’s risk. In terms of paybacks for LPs and GPs, fixed lease profit share lease agreement is similar to the lease abovementioned, however it does not have the performance-based bonus and carries a strong drawback. The fact that Real Holdings is sharing a percentage of the operating expenses is offsetting part of the risk mitigation from fixed lease plus bonus. Both LPs and GPs are subject to the OpCo’s costs efficiency. As for the OpCo, it allows to reduce the market, institutional and personal risks described by Huirne et al. (2000)36, by underweighting OpCo’s operating expenses.
8.5.6 Output
Table 2 – Output Results
From the results observed in Table 2, the IRR, NPV and Payback year from the OpCo, Real Holdings Project, LPs and GPs do not differ significantly between each lease agreement considered. As each alternative would almost benefit equally each party, Real Holdings decided to select the lease agreement with their theoretical analysis rather than by their IRR, NPV and Payback year. From the previous analysis, fixed lease plus bonus presented itself to be the most appealing lease agreement. Since this is a lease that gives a performance-based bonus to the OpCo, it will be incentivized to perform in an exceptional way. Likewise, this lease permits Real Holdings to offset part of the loss caused by low olive oil season prices or low olive oil yield from share of gross revenue with fixed cash lease. Additionally, it
Lease agreements OpCo Real Holdings Project LPs GPs
Share of gross revenue 10.85% / € 8,923,118.56 / 9y 8.6% / € 6,757,057.57 / 12y 14.12% / € 1,417,242.83 / 9y 28.1% / € 1,167,413.58 / 5y Fixed cash lease 10.97% / € 9,519,636.35 / 9y 8.38% / € 6,034,780.47 / 13y 13.98% / € 1,246,958.20 / 10y 28.48% / € 1,119,507.31 / 5y Fixed lease plus bonus 10.78% / € 8,984,926.94 / 9y 8.6% / € 6,616,536.30 / 12y 14.41% / € 1,521,426.19 / 9y 28.68% / € 1,157,526.04 / 5y Flexible lease profit share 9.45% / € 6,311,865.52 / 9y 8.69% / € 7,063,909.23 / 12y 14.17% / € 1,494,398.98 / 9y 27.76% / € 1,183,468.09 / 5y
accomplishes Real Holdings’ objective by returning cash flows with a CAGR of 20.40% to its investors, LPs.
8.5.7 J-Curve
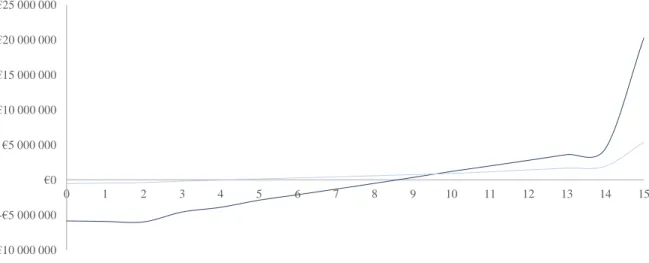
From the results observed in Table 2, Real Holdings perceived that the NPV of both LPs and GPs do not differ on a vast amount. The explanation for this stems from the fact that cash flows from GPs are not considering their operational expenses and overhead costs. However, because of the low GPs’ equity investment, both management fee and performance fee that GPs are entitled to receive have a great impact in their cash flows and contribute to their high NPV. Nonetheless, as it can be observed in the J-Curve from Figure 2, the accumulated cash flows between LPs and GPs differs in huge amounts. Note that both LPs and GPs are net of the Portuguese withholding tax of 28.00%.
Figure 2 – Fixed Lease plus Bonus: J-Curve
8.6 Sensitivity Analysis
The sensitivity analysis is crucial to perceive the impact of fluctuations and changes on the most important drivers of this financial model. Real Holdings will only measure the sensitivity analysis for the fixed lease plus bonus agreement with IRR and NPV as the comparative measures. The company will perform three different analysis for the OpCo, LPs and GPs using the following variables: olive oil yield and olive oil season price; management fee and performance fee; and cost of debt and debt ratio.
8.6.1 Olive Oil Yield and Olive Oil Season Price
Currently, the company is considering an olive oil yield of 17.50% and an olive oil season price of €3.00. This sensitivity analysis will measure changes of 0.25% and €0.20, meaning that olive oil yield and olive oil season price will have a range of [17.00% – 18.00%] and
-€10 000 000 -€5 000 000 €0 €5 000 000 €10 000 000 €15 000 000 €20 000 000 €25 000 000 0 1 2 3 4 5 6 7 8 9 10 11 12 13 14 15
[€2.60 – €3.40], respectively. From the results observed, the OpCo presents to be more sensitive to changes of 0.25% in olive oil yield than LPs and GPs. From 17.00% to 18.00%, the OpCo’s IRR and NPV varies around 2.50% and €4,000,000, respectively, while the IRR of both LPs and GPs’ remains nearly unchanged and their NPV change around €60,000 and €10,000, respectively. Nevertheless, the OpCo presents to be highly sensitive to changes in olive oil season prices. From €2.60 to €3.40, the OpCo’s IRR and NPV varies around 8.50% and €19,000,000, respectively, while the LPs and GPs’ IRR and NPV change around 2.00% and 2.50%, and €1,000,000 and €100,000, respectively. Both LPs and GPs do not present to be that much sensitive to changes in olive oil yield and olive oil season price due to the mitigation of the business risk described by Huirne et al. (2000)36. Additionally, when olive oil season price increase from €2.60 to €2.80 with olive oil yields at 17.00% and 17.25%, their IRR and NPV decreases, which is an effect from the OpCo performance-based bonus (refer to Appendix 6 for a detailed description of this table).
8.6.2 Management Fee and Performance Fee
The management fee and performance fee that Real Holdings is currently considering are 1.25% and 10.00%, respectively. This sensitivity analysis will measure changes of 0.25% and 1.00%, meaning that management fee and performance fee will have a range of [1.00% – 2.00%] and [8.00% – 12.00%], respectively. Note that, with changes in the LP/GP structure, both IRR and NPV of LPs and GPs change in opposite ways. From 1.00% to 2.00%, the IRR and NPV of LPs decrease around 0.70% and €400,000, while GPs increase around 7.50% and €400,000, respectively. As for the performance fee, from 8.00% to 12.00%, the IRR and NPV of LPs decrease around 0.30% and €200,000, while GPs increase around 1.00% and €200,000, respectively. It is important to refer that the performance fee is reallocating part of the LPs’ NPV to the GPs, as LPs are entitled to pay 10.00% of their equity when the hurdle rate of 5.00% exceeds the annual IRR. From the results observed, both LPs and GPs do not present themselves to be highly sensitive to changes tested in this analysis. Nonetheless, the LP/GP structure considered presents itself to be more sensitive to changes in management fee than in performance fee. This can be explained by the fact that the management fee is paid annually and its changes have a major impact in LPs and GPs cash flows. Another rationale to explain this stems from the fact that performance fee is solely paid in the last 5 years, since the stable cash flows are relatively low (refer to Appendix 7 for a detailed description of this table).
8.6.3 Cost of Debt and Debt Ratio
Lastly, Real Holdings analysed different scenarios for the current cost of debt and debt ratio of 4.25% and 70.00%, respectively. This sensitivity analysis will measure changes of 0.25% and
5.00%, meaning that cost of debt and debt ratio will have a range of [4.00% – 5.00%] and [60.00% – 80.00%], respectively. Note that the share of equity that both LPs and GPs own remain the same, 91.67% and 8.33%, respectively. As expected, the increase in the cost of debt will negatively impact both LPs and GPs returns, even though the 0.25% change did not present to have high impact in LPs and GPs cash flows. Regarding changes in debt ratio, it is interesting to notice that, with the increase of debt ratio, LPs are less correlated than GPs and their IRR increases while the NPV decreases. As it was explained in the former sensitivity analysis, changes in management fee have significant impacts in LPs and GPs cash flows, since it is paid annually. When the debt ratio increases, LPs will invest less in equity and will pay a smaller management fee. On the other hand, when the debt ratio decreases, GPs will benefit more as they will receive a higher management fee. Nevertheless, the NPV of both LPs and GPs are negatively correlated with the increase of debt, since it increases their cost of equity due to the financial risk described by Huirne et al. (2000)36 (refer to Appendix 8 for a detailed description of this model).
9. Conclusion
Real Holdings’ current investment strategy presents itself to be accurately shaped due to the outstanding historic and expected real assets performance. The Investment Fund Strategic Growth Plan fulfilled Real Holdings’ objective by delivering growth in capital appreciation and stable cash flows with a CAGR of more than 20.00% to its investors. In LPs’ perspective, the Alqueva project presents to outperform all seven indexes exploited in Real Assets vs. Equities section with the CAGR as the comparative measure. The IRR of both LPs and GPs, 14.41% and 28.68%, respectively, is considerably attractive as it is superior to their cost of capital, resulting in positive and high NPVs. Both traditional agriculture investors (LPs) and management board (GPs) benefit from the Alqueva project as the strategy considered with the fixed lease plus bonus agreement proved to mitigate the majority of an agriculture investment risk. Additionally, it is also a tempting project for the OpCo since there is an performance-based bonus that incentivizes the OpCo to maximize returns. Notwithstanding, this project is a unique opportunity to invest not only for traditional agriculture investors, but also for investors who carry a low risk/return profile. As previously mentioned, this agriculture project carries out a low risk/return profile, which outweighs the current low interest rates established by the ECB and Fed. Despite of the fact that agriculture was the only industry analysed with the Alqueva project, other real assets industries may also emerge to be appropriate investments with a strong potential.