functions, in addition to structural roles ( 1 ); consequently lipidomic studies have become fundamental for under-standing their contribution to health and disease. Mass spectrometry (MS), with its capability of providing struc-tural information, has been the main method of choice in lipidomic studies. Recent technological advances in mass spectrometers, including increased sensitivity, higher mass accuracy, higher scan speeds, and the ability to acquire in both positive and negative mode in one run have resulted in the increased popularity of MS as a detection technique for biomolecules in recent years. This has enabled the mapping of lipids present in fl uids and cells, leading to better understanding of the role of the different lipid classes in the pathophysiology of diseases.
A critical step in lipidomic analysis is lipid extraction with an appropriate organic solvent mixture (solvent sys-tem) prior to MS detection. The solvent system should be capable of effectively extracting lipids representative of the sample under study without bias, inducing or promot-ing the degradation of lipids, or introducpromot-ing contamina-tion by nonlipid components such as sugars, peptides, and amino acids. Therefore, the success in the identifi cation and profi ling of lipids is critically dependent on the effi -ciency of the extraction step. The performance of the lipid extraction for a given sample (tissue, cell, or fl uid) with a particular solvent system depends on the partitioning of the Abstract Lipidome profi le of fl uids and tissues is a growing
fi eld as the role of lipids as signaling molecules is increas-ingly understood, relying on an effective and representative extraction of the lipids present. A number of solvent systems suitable for lipid extraction are commonly in use, though no comprehensive investigation of their effectiveness across multiple lipid classes has been carried out. To address this, human LDL from normolipidemic volunteers was used to eval-uate fi ve different solvent extraction protocols [Folch, Bligh and Dyer, acidifi ed Bligh and Dyer, methanol (MeOH)-tert-butyl methyl ether (TBME), and hexane-isopropanol] and the extracted lipids were analyzed by LC-MS in a high-resolution instrument equipped with polarity switching. Overall, more than 350 different lipid species from 19 lipid subclasses were identifi ed. Solvent composition had a small effect on the extraction of predominant lipid classes (triacyl-glycerides, cholesterol esters, and phosphatidylcholines). In contrast, extraction of less abundant lipids (phosphatidylinosi-tols, lyso-lipids, ceramides, and cholesterol sulfates) was
greatly infl uenced by the solvent system used. Overall, the
Folch method was most effective for the extraction of a broad range of lipid classes in LDL, although the hexane-isopropanol method was best for apolar lipids and the MeOH-TBME
method was suitable for lactosyl ceramides. —Reis, A., A.
Rudnitskaya, G. J. Blackburn, N. M. Fauzi, A. R. Pitt, and C. M. Spickett. A comparison of fi ve lipid extraction solvent
sys-tems for lipidomic studies of human LDL. J. Lipid Res. 2013.
54: 1812–1824.
Supplementary key words lipidomics • orbitrap • dual polarity • polarity switching • ANOVA simultaneous component analysis • liquid-liquid extraction
In recent years it has become clear that lipids and phos-pholipids have a plethora of bioactivities and signaling
This research was supported by a Marie Curie Intra-European Fellowship within the 7th European Community Framework Program (IEF 255076). Work of A. Rudnitskaya was supported by Portuguese Science and Technology Foundation, through the European Social Fund (ESF) and Programa Operacional Potencial Humano (POPH).
Manuscript received 26 November 2012 and in revised form 18 April 2013. Published, JLR Papers in Press, May 13, 2013
DOI 10.1194/jlr.M034330
A comparison of fi ve lipid extraction solvent systems
for lipidomic studies of human LDL
Ana Reis , 1, * Alisa Rudnitskaya , † Gavin J. Blackburn , § Norsyahida Mohd Fauzi , ** Andrew R. Pitt , * and Corinne M. Spickett *
School of Life and Health Sciences,* Aston University , Birmingham, B4 7ET, UK ; CESAM and Department of Chemistry, † Universidade de Aveiro , 3810-193 Aveiro, Portugal ; Strathclyde Institute of Pharmacy and Biomedical Sciences, § Strathclyde University , Glasgow, G4 0RE, Scotland, UK ; and Faculty of Pharmacy,** Universiti Kebangsaan Malaysia Jalan Raja Muda Abdul Aziz , 50300 Kuala Lumpur, Malaysia
Abbreviations: ASCA, ANOVA simultaneous component analysis; AU, arbitrary units; BHT, butylated hydroxytoluene; BMI, body mass index; Cer, ceramides; CE, cholesteryl ester; CS, cholesterol sulfate; DHEA, dehydroepiandrosterone sulfate; FWHM, full width half maxi-mum; HexCer, hexosyl ceramides; HILIC, hydrophilic interaction chromatography; IPA, isopropyl alcohol; LAA, lipoamino acid; LacCer, lactosyl ceramides; lysoPC, phosphatidylcholine; lysoPE, lyso-phosphatidylethanolamine; MeOH, methanol; TBME, tert-butyl methyl ether; PC, phosphatidylcholine; PE, phosphatidylethanolamine; PG, phosphatidylglycerol; PI, phosphatidylinositol; PS, phosphatidylserine; ST, sulfatide; TAG, triacylglyceride .
1
To whom correspondence should be addressed. e-mail: [email protected]
The online version of this article (available at http://www.jlr.org) contains supplementary data in the form of six fi gures and one table .
at UNIVERSIDADE DE AVEIRO, on September 20, 2016
www.jlr.org
Downloaded from
.html
performance of fi ve different solvent systems on the ex-traction of lipids from LDL particles isolated from pooled plasma of healthy volunteers. LC-MS was used to identify the lipids extracted, with statistical analysis to evaluate dif-ferences in the large number of species found.
MATERIALS AND METHODS Chemicals
All chemicals used were analytical grade or the highest purity commercially available. All organic solvents were of HPLC grade or the highest purity commercially available (Fisher Scientifi c, Loughborough, UK). TBME was purchased from Sigma (Poole, UK). Nitrogen was purchased from BOC (Worsley, Manchester, UK). Lipid standards [PC 13:0/13:0 and dehydroepiandrosterone sul-fate (DHEA)] were purchased from Avanti Polar Lipids (Alabas-ter, AL). Synthetic lipid compounds were considered as lipid standards when exhibiting an m/z value that did not match any of the ions present in the unspiked sample with the various solvent systems (endogenously present in the sample or exogenously in-troduced as contaminants by the solvent system).
Blood collection and LDL separation
Blood samples from three healthy normolipidemic female volunteers (age range 26–46 years, BMI <25, plasma cholesterol <250 mg/dl) were collected after overnight (12 h) fasting into EDTA-containing tubes (Vacuette, Greiner Bio-One, Glouces-ter, UK) after voluntary written consent was obtained. The study was approved by the University of Strathclyde ethics committee . Plasma was separated immediately by low speed centrifugation (2,000 g ) at 4°C. Plasma samples were pooled and sterile 60% sucrose (w/v) solution was added as a cryopreservative to a fi nal concentration of 0.6%. Pooled plasma aliquots were stored at ⫺ 80°C in the dark (up to 4 months) until further use. The LDL population was isolated as described previously ( 25 ). LDL was desalted by gel fi ltration with an Econo-Pac 10 DG column (Bio-Rad, Hemel Hempstead, Hertfordshire, UK) using auto-claved phosphate-buffered saline (150 mM NaCl, 10 mM NaH 2 PO 4 , pH 6.0) as eluent.
Protein and cholesterol assay
The LDL protein concentration was determined by a mi-croplate Bradford assay in triplicate as described elsewhere ( 26 ). The absorbance was read in a microplate reader (Sunrise Tecan) set at 595 nm and the protein amount in each sample calculated using the standard curve.
LDL cholesterol content (<180 mg/dl) was determined by the CHOD-PAD method using the cholesterol kit supplied by Boeh-ringer-Mannheim (Mannheim, Germany) according to manufac-turer’s instructions.
SDS-PAGE electrophoresis
The purity of LDL population isolated was confi rmed by so-dium dodecyl sulfate/polyacrylamide gel electrophoresis (SDS-PAGE) resolved in 5% SDS-PAGE according to Laemmli’s method ( 27 ). Samples (10 l) were mixed with Laemmli buffer in 1:1 ratio (v/v) and after heat denaturing loaded into the wells and run at constant voltage. Prestained marker (15 l) of known molecu-lar weights in the range of 30–460 kDa (HiMArk prestained, Invit-rogen, Paisley, UK) was loaded together with the samples. Gels were stained with colloidal Coomassie blue solution followed by destaining with solution containing 40% MeOH and 10% acetic
different lipids into the organic phase used and consequently on the sample lipid composition. In the particular case of biological fl uids, the differences in reported lipid compo-sitions may result from the variety of solvent systems that have been used, though the most commonly used solvent systems for lipid profi ling are undoubtedly the ones de-scribed over 50 years ago by Folch, Lees, and Sloane Stanley ( 2 ) and Bligh and Dyer ( 3 ). These involve the partition of lipids into a binary mixture of chloroform and metha-nol (MeOH) (in different ratios), where MeOH is added to the aqueous phase to disrupt the hydrogen bonding networks or electrostatic forces between lipids and pro-teins followed by the addition of nonpolar solvents such as chloroform to allow the formation of a two-phase system. Even though the methods were initially developed for the extraction of fat from animal tissues ( 3 ), the simplicity and effi ciency of the solvent systems in extracting a broad range of lipid classes soon made them popular. Currently, these solvent systems are routinely applied for a wide range of biological fl uid samples such as blood, tears ( 4, 5 ), urine ( 6, 7 ), saliva ( 8 ), cerebrospinal fl uid ( 9, 10 ), human milk ( 11 ), bronchoalveolar lavage fl uid ( 12, 13 ), and sperm ( 14 ). Over the years some modifi cations to the original solvent system composition have been introduced, tested, and evaluated; although these alterations are not always fully described by the authors, which makes comparison of the lipid content and composition of fl uids in similar path-ological conditions somewhat diffi cult. A comparison of the Folch method and the Bligh and Dyer method has shown similar recoveries in the extraction of the pre-dominant phospholipid classes ( 15 ), and similar conclu-sions were reported in other studies comparing the Folch method with alternative extraction solvent systems ( 16–18 ). Other solvent mixtures that include, for example, hexane ( 19, 20 ), butanol ( 18, 21 ), ethyl acetate ( 21 ), and more recently tert-butyl methyl ether (TBME) ( 17, 22–24 ) are also described in the literature. TBME, which was reported to give comparable results to the Bligh and Dyer method in the profi le of human plasma ( 16 ), has become particularly popular for sphingolipidomic studies and the extraction of lipids in fl uids ( 21, 23 ). Generally, the alternative sol-vent systems were not reported to exhibit signifi cant differ-ences in the extraction of predominant lipid classes when compared with the “traditional” solvent systems ( 15–18 ). Rather, the advantage of these extraction systems lies in the avoidance of chlorinated solvents, which are environ-mentally harmful. Despite these limited pairwise compari-sons, no broader analysis of the effects of solvents in the extraction of lipids in fl uids (blood plasma) has been con-ducted. Moreover, the previous studies tended to focus on major phospholipid classes such as phosphatidylcholines (PCs) and phosphatidylethanolamines (PEs), and have over-looked the infl uence of solvent composition on extractabil-ity of less abundant lipid classes.
LDL is a much studied and important component of plasma, and various solvent systems can be employed for the profi ling of its lipids; but as yet no evaluation of the extractability of the different lipid classes in LDL has been conducted. We have addressed this by studying the
at UNIVERSIDADE DE AVEIRO, on September 20, 2016
www.jlr.org
Downloaded from
.html
column (150 mm × 3 mm × 3 m; HiChrom, Reading, UK) used in hydrophilic interaction chromatography (HILIC) mode ( 30 ). Two solvents were used: solvent A [20% isopropyl alcohol (IPA) in acetonitrile] and solvent B [20% IPA in ammonium formate (20 mM)]. Elution was achieved using the following gradient at 0.3 ml/min: 0–1 min 8% B, 5 min 9% B, 10 min 20% B, 16 min 25% B, 23 min 35% B, and 26–40 min 8% B. Detection of lipids was performed in a Exactive mass spectrometer (Thermo Fisher Scientifi c Inc., Hemel Hempstead, UK) equipped with polarity switching. The instrument was calibrated according to the manu-facturer’s specifi cations to give an rms mass error <1 ppm. The following electrospray ionization settings were used: source volt-age, ±4.50 kV; capillary voltvolt-age, 25 V; capillary temp, 275°C; sheath gas fl ow, 60 arbitrary units (AU); auxiliary gas fl ow, 25 AU; sweep gas fl ow, 0 AU. All LC-MS spectra were recorded in the range 100–1,200 at 50,000 resolution (FWHM at m/z 500). Three microscans were collected per data point with the injection time limited by either an automatic gain control target ion density of 10 6 or a maximum inject time of 250 ms. Tandem mass spectra (LC-MS 2 ) were acquired on an LTQ Orbitrap instrument (Thermo-Electron, Hemel Hempstead, UK) controlled by Xcalibur (version 2.0, Thermo Fisher Corporation) in either positive or negative ion modes as appropriate for the best detection of the parent ion. The source voltage was set at 4.5 kV, capillary temperature at 275°C, with sheath gas and auxiliary gas fl ow rates set at 30 and 10 AU, respectively. Collision energy was set according to the ion of interest, typically between 25 and 35 AU.
Some of the lipid classes were detected in both positive and nega-tive ion mode, namely ceramides (Cer) ([M+H] + /[M+HCOO] ⫺ ), PEs ([M+H] + /[M-H] ⫺ ), choline class ([MH] + /[M+HCOO] ⫺ ), and lipoamino acids (LAAs) ([M+H] + /[M-H] ⫺ ), and other lipid classes were detected in the negative ion mode as different ad-ducts ([M-H] ⫺ )/[M+HCOO] ⫺ ), namely Cer, lactosyl ceramides (LacCer), and sphingomyelins (SMs). All lipid classes were man-ually cross-referenced to prevent overestimation of the number of lipid species identifi ed.
Determination of percent recovery
The percent recoveries of two different standards were deter-mined by spiking 15 l of LDL before extraction with the follow-ing amounts: 307.5 pmol PC (13:0/13:0) and 135.8 pmol DHEA sulfate. The lipids were then extracted using the fi ve different sol-vent systems described above. Lipid extracts of spiked LDL were reconstituted in 100 l CHCl 3 /MeOH (1:1, v/v) and further diluted in MeOH prior to injection and separation by LC-MS (using the same column and elution program as described above) using an Ultimate 3000 system (Dionex, Camberley) controlled by Chromeleon Xpress in conjunction with Analyst software (1.5.1; ABSciex, Warrington, UK) coupled to a 5600 TripleTOF (ABSciex). The detection of lipid standards was achieved with source temper-ature set at 550°C, spray voltage set at ±4.5 kV, and declustering potential set at 50 V. TOF MS survey scans were collected in the mass range of 100–1,200 Da for 250 ms. The extracted ion chro-matograms for each of the ions ( m/z 650.4953 for 13:0/13:0 PC and m/z 367.1595 for DHEA sulfate) were generated using options available in Analyst software (1.5.1; ABSciex) and areas under the curve were used to estimate the mean recoveries (calculated in triplicate) and the matrix effects on the extraction of lipids using the different solvent systems. Limit of detection (LOD) and limit of quantitation (LOQ) were estimated by the blank method. Data processing and statistical analysis
Data processing was carried out using a combination of the open-source tools: Proteowizard , XCMS ( 31, 32 ), and MZMatchR ( 33 ) within the R environment ( 34 ). The MSConvert tool from Proteowizard was used to convert the .raw fi les acquired by the acid. The gel (supplementary Fig. I) shows one main band above
the top marker corresponding to ApoB-100 which is the predomi-nant protein (>95%) in LDL population ( 28 ).
Lipid extraction protocols
Extraction of LDL lipids was performed in triplicate using 25 g of protein (46 l) by the fi ve different solvent systems as described below.
Solvent system 1 [Folch method ( 2 )]: LDL lipids were ex-tracted by addition of 160 l ice-cold MeOH (containing 50 g/ml of BHT) followed by the addition of 320 l of ice-cold CHCl 3 and incubation for 20 min on ice with occasional vortex mixing. High purity water (150 l) was added and the sample kept on ice for an additional 10 min with occasional mixing. The sample was centrifuged for 5 min at 2,000 g and the upper (aqueous) phase was removed and reextracted by addition of 250 l of ice-cold CHCl 3 :MeOH (2:1, v/v) as above. The upper phase was discarded and both organic phases were combined, dried under nitrogen stream, and stored at ⫺ 70°C.
Solvent system 2 [Bligh and Dyer method ( 3 )]: LDL lipids were extracted by addition of 160 l ice-cold chloroform (CHCl 3 ) together with 320 l of ice-cold of MeOH containing BHT (50 g/ml) with occasional vortex mixing for 20 min, followed by 150 l of water, at which point a biphasic mixture was formed. The sample was centrifuged for 5 min at 2,000 g and the upper (aqueous) phase removed and retained. A second extraction step was performed on the upper aqueous phase and both or-ganic phases were combined and washed with 150 l water as above. The organic phase was dried under stream of nitrogen and stored at ⫺ 70°C until MS analysis.
Solvent system 3 [acidifi ed Bligh and Dyer method ( 29 )]: LDL lipids were extracted as described for solvent system 2, except that 2 l of 3M hydrochloric acid was added after the 150 l of ice-cold chloroform at the second extraction step for the aque-ous phase, and the combined organic phases were washed by ad-dition of 200 l of water.
Solvent system 4 [MeOH-TBME method described by Matyash et al. ( 16 )]: LDL lipids were extracted by addition of 400 l ice-cold MeOH containing BHT (50 g/ml) and incubated for 10 min, followed by addition of 500 l of TBME and further incubation on ice for 1 h with occasional vortex mixing. After this, 500 l of water were slowly added to induce phase separation and incubated for 15 min with occasional mixing, followed by centrifugation and collection of the upper organic phase. To the aqueous bottom layer, an additional extraction step was performed with 200 l of ice-cold TBME and 15 min incubation on ice as above, followed by centrifugation at 2,000 g for 5 min. The organic phases were com-bined and washed by the addition of 150 l of water.
Solvent system 5 [hexane:isopropanol method ( 19, 20 )]: LDL lipids were extracted by the addition of 800 l of ice-cold hexane:2-propanol (3:2, v/v) and left to incubate for 20 min on ice with occasional vortex mixing. The hexane contained BHT (50 g/ml). The mixture was centrifuged at 2,000 g for 5 min and the upper organic phase removed and retained. The lower aqueous phase was reextracted with 200 l hexane:MeOH (3:2, v/v) for 15 min as above. After fi nal centrifugation both organic phases were combined in and dried under nitrogen stream.
Analysis of lipid extracts by HPLC-MS
Lipid extracts obtained from each solvent system were solubi-lized in 100 l CHCl 3 :MeOH (1:1, v/v), further diluted in MeOH and the vials placed randomly in the autosampler tray kept at 4°C. Lipids were analyzed in duplicate, totaling six injections per solvent system. Separation of LDL lipid classes was performed using a Dionex Ultimate 3000 HPLC system (Thermo Scientifi c, Hemel Hempstead) by injection of 10 l sample onto a silica gel
at UNIVERSIDADE DE AVEIRO, on September 20, 2016
www.jlr.org
Downloaded from
.html
( 2 ), with detection by both positive and negative ioniza-tion electrospray mass spectrometry. As polarity switching was used, the chromatograms are directly comparable in terms of the species eluted at each time. It can be seen that the majority of lipids eluted in the fi rst 25 min, and some classes of lipid could be detected in both positive and neg-ative ion modes.
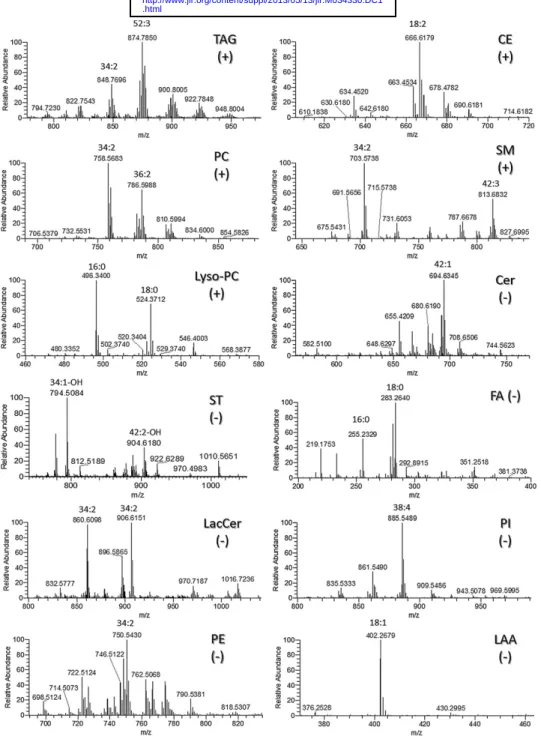
The averaged LC-MS mass spectra from the various time windows of the chromatogram corresponding to the elu-tion of different lipid classes are shown in Fig. 2 , showing LC-MS spectra in positive ion mode for triacylglycer-ides (TAGs), cholesteryl esters (CEs), PCs, SMs, and lyso-phosphatidylcholines (lysoPCs), and the LC-MS spectra in negative ion mode for Cer, sulfatides (STs), free fatty acids (FFAs) and conjugates, LacCer, phosphatidylinositols (PIs), PEs, and LAAs. Cholesterol, cholesterol sulfate (CS), HexCer, lyso-phosphatidylethanolamines (lysoPEs), glycero-phosphatidylglycerols (PGs), and other lipid-like molecules, such as steroid conjugates and prenols, were also identifi ed in negative ion mode (data not shown). Structures of the predominant and other lipid classes are depicted in sup-plementary Fig. II. The mass spectra ( Fig. 2 ) show a large number of individual lipid species present within each lipid class. The nature of lipids and adducts identifi ed in the mass spectra was confi rmed by using specifi c formula search criteria, as summarized in Table 1 , based on match-ing the data from accurate mass analysis to mass prediction for the formulas and retention time data. Table 1 also shows the number of individual lipid species identifi ed in each of the classes, and it can be seen that glycerophospholipids are the class with the largest number of species, closely fol-lowed by sphingolipids, and in total more than 350 distinct molecular species were identifi ed. The full list of lipid iden-tifi cations obtained from accurate mass data and predic-tion software is shown in supplementary Table I.
The TAG and CE classes were detected in the positive ion mode as [M+NH 4 ]
+
adducts, while PC, SM, and lysoPC classes occurred as [MH] + molecular ions. Lipids from the choline class were also detected in the negative ion mode as formate adducts, [M+HCOO] ⫺ , as was the case of SMs, which could additionally be observed as deprotonated mo-lecular ions [M-H] ⫺ . Attention was taken to ensure that species that ionized in several forms were only counted once in terms of the number of lipid species observed. In positive ion mode it was noted that there was a predomi-nance of linoleoyl-containing lipid species in triacylglycer-ols, CEs, and choline class (TAG m/z 876.61, tri-linoleoyl; CE m/z 666.62, linoleoyl; PC m/z 758.56, palmitoyl-lino-leoyl; and 786.56, stearoyl-linoleoyl) in LDL.
Lipid classes profi led in the negative ion mode (Cer, CS, STs, FAs, HexCer, LacCer, PIs, PEs, PGs, and LAAs) ionized either as deprotonated molecules [M-H] ⫺ or as
for-mate adducts [M+HCOO] ⫺ . HexCer and LacCer were
composed of the d16:1 chain and the d18:1 chain (sup-plementary Table I) while the PI class was mostly com-posed of the arachidonoyl-containing PI (18:0/20:4, m/z 885.55). Other anionic phospholipids such as the glycero-phosphatidylserine (PS) class were not found. Sulfur-containing compounds, such as CSs and STs, were detected
mass spectrometer into .mzXML format. Files were then further processed using centWave ( 31, 35 ) from XCMS (https://xcm-sonline.scripps.edu) to detect and extract features in centroid mode from individual spectra followed by analysis using the tools available through MZMatchR (alignment; peak matching; RSD fi lter, 0.5; noise fi ltering, 0.8; gap-fi lling; intensity fi lter, 10 4 ; com-bination of replicates, minimum of three) and conversion to text. The raw mass spectrometric data was also manually interpreted using accurate mass and retention time to identify individual lip-ids, with reference to an in-house database and the Human Meta-bolome project ( 36 ). These identifi ed lipids were cross matched to peaks that appeared in the MZMatch fi ltered data to generate data set 1. While more than 350 lipids could be identifi ed from the raw data coming from 19 lipid or lipid-related subclasses, only 169 of these were represented in the MZMatch fi ltered data-set, representing 12 lipid subclasses. Alternatively, for data set 2 the same .mzXML fi les were analyzed using the full XCMS anal-ysis pipeline (XCMSOnline version 0.0.83, Scripps Center for Metabolomics, https://xcmsonline.scripps.edu/). Data set 2 cor-responds to features extracted in centroid mode by the XCMS processing analysis (peak width between 10 and 60 s; mass toler-ance in consecutive runs, 3 ppm; fold change, 1.5 for P < 0.05) appearing within the retention time windows that represented the different lipid classes, as described in Table 1 , totaling 1,567 features. Some of the retention time windows (shown in Fig. 1 and given in Table 1 ) contain overlapped lipid classes that are not distinguished by direct analysis of chromatogram, for exam-ple FA coeluted with hexosyl ceramides (HexCer). Hence there are only 10 lipid classes formally represented in data set 2, anno-tated by the major species identifi ed in the window.
Processed LC-MS data from MzMatch R was transferred to an excel data sheet and the ion intensities of the identifi ed lipids (data set 1, 169 features) were used to evaluate the comparative effi ciency of extraction (referred to as extractability) of individual lipids and different lipid classes for each of the extraction solvent systems as-sessed. Data from the full XCMS pipeline (data set 2) was also used to evaluate the extractability of the solvent systems by summing to-tal ion intensities in retention time windows representing different lipid classes, as indicated in Table 1 . Statistical analysis on the ex-tractability between the different solvent systems was performed using ANOVA simultaneous component analysis (ASCA); this method merges ANOVA and principal component analysis, and was developed specifi cally for analyzing large instrumental data sets with underlying experimental design measured on a relatively small number of samples ( 37, 38 ). A detailed description of the ASCA model used can be found in the supplementary data online The signifi cance of the effect of the different solvent systems was assessed using a permutation test ( 39–41 ), and ASCA with permu-tation test was run on data sets 1 and 2. The ASCA algorithm and permutation test ( 38 ) were implemented in MATLAB, v5.3. After signifi cance testing of the effect of the solvent systems, post hoc comparison of the pairs of methods was performed using a P value of 0.05. The sum of the peak intensities for the ions in individual lipid classes was used as the criterion for selection of the optimal extraction protocol. The 10 lipid classes included in these analyses are representative of lipids as a whole, as they include lipids with a broad range of structures and physicochemical properties.
RESULTS Lipid profi ling of LDL particles
Figure 1 shows normal phase chromatograms for the elution of lipids extracted from LDL by the Folch method
at UNIVERSIDADE DE AVEIRO, on September 20, 2016
www.jlr.org
Downloaded from
.html
Infl uence of solvent systems on the extraction of LDL lipids
Based on the lipids identifi ed in LDL, we conducted an evaluation of the extractability of each of the classes pres-ent in LDL using 5 differpres-ent solvpres-ent systems. Supplemen-tary Fig. IV depicts the chromatograms corresponding to the replicate injections for one solvent system (acidifi ed Bligh and Dyer) in positive (supplementary Fig. IVA) and negative ion mode (supplementary Fig. IVB) showing re-producibility within the injections. Supplementary Fig. IV also depicts the chromatograms obtained in one injection for each of the fi ve solvent systems tested in positive (sup-plementary Fig. IVC) and negative ion mode (supplemen-tary Fig. IVD). The different colors and line forms in the chromatograms give a pictorial representation of the areas of the chromatograms showing that signifi cant differences could be seen in some peak intensities between the differ-ent extraction methods (supplemdiffer-entary Fig. IV). In order to characterize the effectiveness of different extraction protocols for LDL lipids, LC-MS data were processed using two different approaches, as described in the Materials and Methods section. Data set 1 contains 169 ions from 10 lipid classes that passed the fi lters during processing using MzMatch (peak matching, noise fi ltering, and gap fi lling) and were evaluated for their extractability in the fi ve sol-vent systems. While this is not an exhaustive assessment of all the different lipid species identifi ed, each class of lipids is represented by the predominant ions, as shown in Fig. 2 , and therefore the data is likely to be representative of the in negative mode with the predominant ST species
corre-sponding to the oleoyl hydroxylated chain (d18:1/16:0, m/z 794.51) and nonhydroxylated (d18:1/16:0, m/z 778.51),
though the hydroxylated d24:1/16:0 ( m/z 904.62) was
also observed (supplementary Table I). Other lipid-like molecules were also identifi ed, namely prenols (lipophilic antioxidants), secosteroids (vitamins), and steroid deriva-tives (hormones), and are summarized in supplementary Table I.
While the HILIC separation step coupled to high-reso-lution instrument allowed differentiation of molecular lipid species with very similar molecular mass but differ-ent molecular formulas (isobaric species), it should be noted that it is often not possible to discriminate isomeric species (the same molecular formula) within each of the lipid classes, for example due to variability of carbon chain length between the esterifi ed FAs. Hence the struc-tural variability in lipids isolated from LDL is likely to be even greater than indicated by Table 1 and supplemen-tary Table I. The occurrence of isomeric species is shown in supplementary Fig. III for a 36:3 PC and a 36:4 PE species. Fragmentation of the PC ion at m/z 784.6 in posi-tive ion mode clearly shows the presence of two species (16:0/20:3 and 18:1/18:2) from the four different pairs of fragments corresponding to loss of the fatty acyl chains, whereas the fragmentation of the PE ion at m/z 738.6
shows the presence of different carboxylate ions ( m/z
255.3, 279.3, and 303.3), indicating the contribution of isomeric structures.
Fig. 1. Typical normal-phase LC-MS chromatograms of lipid extract from normolipidemic LDL in positive (+) (top) and negative ( ⫺ ) ion mode (bottom). LDL was extracted using solvent system 3 (acidifi ed Bligh and Dyer method). Dashed boxes represent the elution time windows for lipid classes eluting (in order of ap-pearance): 1, TAGs+CEs; 2, PCs; 3, SMs; 4, lysoPCs; 5, CS; 6, LAAs; 7, Cer+HexCer; 8, FAs+LacCer; 9, PIs; 10, PEs. Inset in the LC-MS chromatogram in negative ion mode depicts zoomed region for the elution of CS, LAAs, Cer and FAs .
at UNIVERSIDADE DE AVEIRO, on September 20, 2016
www.jlr.org
Downloaded from
.html
excluded from data set 1, would be taken into account in the analysis. The disadvantage of this approach is the po-tential inclusion of organic-extractable ions that are not lipid related.
For both data sets, the intensities of all of the individual ions (169 for data set 1 and 1,567 for data set 2) were summed either within the retention time windows relating to indi-vidual lipid classes to obtain data for the indiindi-vidual classes, or for all of the classes summed across the whole chro-matogram, to provide an indication of the extractability of lipids in the different solvent systems . The total lipids in each class and total lipids were used as optimization criteria. behavior for the whole class. Lipid classes and ions not
included corresponded to single ions in the lipid class (LAAs) and identifi ed lipid classes (STs, HexCer, lysoPEs, and glycero-PGs) excluded by the processing fi lters due to low relative abundance.
Data set 2 was generated by a second approach using the features extracted using the full XCMS platform, and in-cluded all ions identifi ed as features in the delimited time windows (as shown in Fig. 1 ) corresponding to the reten-tion times of lipid classes. This approach ensured that compounds with low relative abundance or those not iden-tified as lipids based on their accurate mass, and thus
Fig. 2. Average LC-MS mass spectra of 12 classes of the 19 individual classes identifi ed in LDL population. LC-MS spectra of lipid extracts were acquired in a high-resolution instrument (orbitrap analyzer) equipped with simultaneous detection in both positive (+) and negative ( ⫺ ) ion modes. Lipids classes were extracted using solvent system 3 (acidifi ed Bligh and Dyer) with TAGs, CEs, PCs, SMs, and lysoPC detected in positive ion mode and with Cer, STs, FAs, LacCer, PIs, PEs, and LAAs, detected in the negative ion mode.
at UNIVERSIDADE DE AVEIRO, on September 20, 2016
www.jlr.org
Downloaded from
.html
(hexane-isopropanol method) extracted the lowest overall total amount of lipid.
To ascertain whether the different solvent extraction protocols had any effect on the individual classes, the in-tensities for the identifi ed lipids in individual lipid classes were summed and used to evaluate the various solvent sys-tems ( Fig. 4 ). Small differences in the extractability of the predominant lipid classes in LDL were observed, namely for PCs, CEs, and TAGs, with substantial changes observed in the extractability of minor lipid classes. Methods 1 Ion intensities or relative abundances cannot be used for
the estimation of the absolute molar abundances of the different lipid classes due to the differences in ionization effi ciency between the different lipid classes and between different lipids within the same lipid class ( 42, 43 ). How-ever, comparisons of ion intensities for the same lipid be-tween samples can be employed in this study for comparing different solvent systems, as the same volume of sample was used for all extraction protocols, the same dilution factor was applied before injection, and the same MS de-tection parameters were used, and therefore peak intensi-ties should be comparable and related to amount of lipids extracted using the different solvent systems. The follow-ing two sections discuss the fi ndfollow-ings usfollow-ing each of the data sets.
Evaluation of lipid extractability using data set 1 (data from MzMatch in R platform)
Figure 3 shows the effect of the extraction protocols on the total lipid (across the whole chromatogram) for all identifi ed lipids in data set 1. It can be seen that solvent systems 1 (Folch method) and 3 (acidifi ed Bligh and Dyer method) show higher extractability for total lipid than the alternative extraction protocols. Solvent sys-tems 2 (Bligh and Dyer method) and 4 (MeOH-TBME me-thod) exhibited similar extractability while solvent system 5
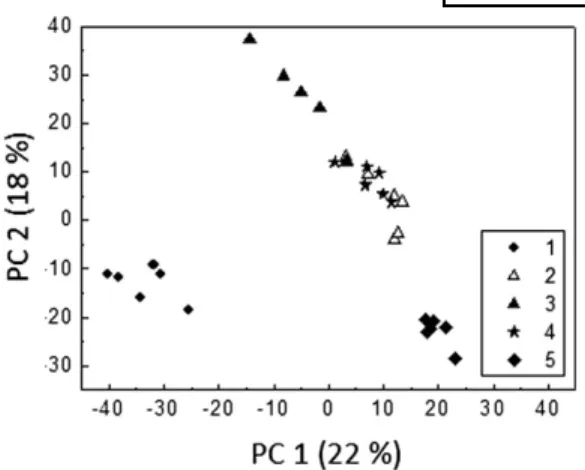
TABLE 1. List of lipid classes and sub-classes identifi ed in LDL population with dual polarity detection in high-resolution mass spectrometer
Lipid Classes
Number of Molecular Ions
Search Criteria (Adducts Searched in the Detection Mode)
Retention Times (min) Glycerolipids 73 — — TAGs 73 C n H m NO 6 ([M+NH 4 ] + ) 2.7–3.4
Sterols and steroids 18 — —
Cholesterol 1 C n H m O ([M+H-H 2 O] + ) 2.9–3.0 CSs 4 C n H m O 4 S ([M-H] ⫺ ) 1.8–1.9 CEs 10 C n H m NO 2 ([M+NH 4 ] + ) 2.7–2.9 Steroid conjugates 3 C n H m O z ([M+H] + )/([M-H] ⫺ ) —
FAs and conjugates 32 — —
FFAs 25 C n H m O 2 ([M-H] ⫺ ) 3.4–3.6 FA conjugates 6 C n H m O 3-5 ([M-H] ⫺ ) — Eicosanoids 1 C n H m O 3 ([M-H] ⫺ ) — Sphingolipids 102 — — SMs 41 C n H m N 2 O 6 P ([MH] + ) 22.2–23.1 Cer 15 C n H m NO 5 ([M+HCOO] ⫺ ) 2.7–3.3 HexCer 11 C n H m NO 8 ([M-H] ⫺ ) 2.9–3.7 LacCer 6 C n H m NO 13 ([M-H] ⫺ ) 3.6–4.0 Acidic glycosphingolipids (STs) 29 C n H m NO 11-13 S ([M-H] ⫺ ) 1.8–1.9 Glycerophospholipids 138 — — PIs 21 C n H m O 13 P ([M-H] ⫺ ) 5.1–6.2 PGs 6 C n H m O 10 P ([M-H] ⫺ ) 14.0–14.10 PSs — C n H m NO 10 P ([M-H] ⫺ ) — PEs 48 — 12.5–13.4 Diacyl-PEs 16 C n H m NO 8 P ([M-H] ⫺ ) — Plasmenyl-PEs 32 C n H m NO 7 P ([M-H] ⫺ ) — LysoPEs 5 C n H m NO 7 P ([M-H] ⫺ ) 14.9–15.2 PCs 54 — 20.3–21.9 Diacyl-PCs 34 C n H m NO 8 P ([MH] + ) — Plasmenyl/plasmanyl-PCs 20 C n H m NO 7 P ([MH] + ) — LysoPCs 4 C n H m NO 7 P ([MH] + ) 23.4–23.9 Lipid-related compounds 10 — — Prenols 3 C n H m O z ([M+H] + )/([M-H] ⫺ ) — LAAs 5 C n H m NO 4 S ([M+H] + )/([M-H] ⫺ ) 2.2–2.3 Total 361 — —
The total number of individual lipid species identifi ed and the time windows in which each of the classes were detected in the chromatogram are also indicated.
Fig. 3. Evaluation of extractability of total lipids in fi ve different solvent systems using data set 1. Data set 1 consists of 169 lipid spe-cies identifi ed in fi ve different solvent systems following processing of LC-MS data through MzMatch R, as described in the Materials and Methods. Graph depicts intensity in counts per second (cps); bars represent standard deviation, ±SD.
at UNIVERSIDADE DE AVEIRO, on September 20, 2016
www.jlr.org
Downloaded from
.html
in this apolar solvent system . However, method 5 was found to be inappropriate for the extraction of more polar lipid classes namely lysoPC, PI, CS, and LAA classes ( Fig. 4 ). The differences observed in the lipid classes caused by the effect of the different solvent extraction systems were found to be signifi cant for all lipid classes according to the per-mutation test ( Table 2 ).
The effi ciency of extraction of two synthetic lipid stan-dards [PC (13:0/13:0) and DHEA sulfate] with the fi ve ex-traction protocols was also tested (supplementary Fig. V). It can be seen that the extraction system had a substan-tial effect on the recovery of the individual standards, which essentially paralleled the profi les observed for ex-traction of the corresponding lipid classes from LDL. The recovery of PCs varied from close to 100% for ex-traction methods 1 and 3 to approximately 50% with method 5, while the highest recoveries were around 80% for DHEA sulfate, and the lowest (for method 5) was less than 20%.
(Folch method) and 2 (Bligh and Dyer method) show similar extractability for PCs, CEs, and TAGs, whereas method 2 shows lower extractability for all other lipid classes compared with the method 1, particularly for FFAs, PIs, LacCer, and Cer. Interestingly, the acidifi ed Bligh and Dyer method (method 3) resulted in the increased extract-ability of SMs, lysoPCs, CSs, LAAs, and LacCer compared with extraction method 2 ( Fig. 4 ). The higher apparent extractability of lysoPCs for method 3 is unlikely to be due to the acidic solution causing degradation of acid-labile bonds especially in ester phospholipids, as the intensity of FA is similar to that observed for method 2. Method 4 (MeOH-TBME method) appeared to be particularly suit-able for the extraction of sphingolipids, as it resulted in nearly a two-fold increase in SMs and LacCer when com-pared with the more popular methods 1 and 2 ( Fig. 4 ). Method 5 (hexane-isopropanol) was particularly suitable for the extraction of FFAs, TAGs, and CEs, probably be-cause of their greater hydrophobicity and hence solubility
Fig. 4. Evaluation of extractability of individual lipid classes using data set 1. Data set 1 consists of 169 lipid species identifi ed in fi ve dif-ferent solvent systems, as described in Materials and Methods, following processing of LC-MS data through MzMatch R. Graphs depict in-tensity in counts per second (cps) for individual classes in fi ve solvent system; bars represent standard deviation, ±SD.
at UNIVERSIDADE DE AVEIRO, on September 20, 2016
www.jlr.org
Downloaded from
.html
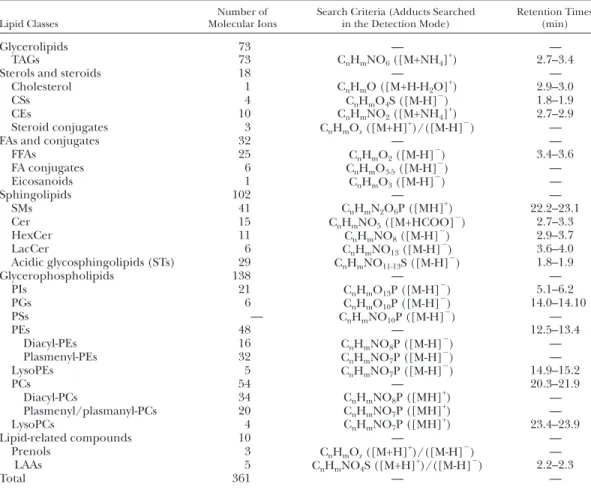
in general the effectiveness of the extraction protocol demonstrated by data set 2 was similar to that of data set 1. However, summed signal intensities for the TAG and CE regions were signifi cantly higher using method 1 suggest-ing higher extraction of these classes, whereas for the FA region only method 2 showed lower extractability, while in the CS region methods 2 and 5 performed better than in-dicated by data set 1. Overall, the extractability in between individual lipid regions for the different solvent systems was signifi cantly different except for PE and PC ( Table 3 ). In the ASCA score plot, solvent systems were aligned along the fi rst principal component in order of increasing total sum of the peak areas, from method 5 on the right to method 1 on the left ( Fig. 6 ). It can be seen that method 3 (acidifi ed Bligh and Dyer) showed a high dispersion of points, and therefore was the least reproducible protocol. The corresponding ASCA loading plot is not shown, as it contained 1,567 points and visualization of individual points was diffi cult.
DISCUSSION
The aim of this study was to investigate the effectiveness of fi ve popular lipid extraction protocols, namely the Folch ( 2 ), Bligh and Dyer ( 3 ), acidifi ed Bligh & Dyer ( 29 ), MeOH-TBME ( 16 ), and hexane-isopropanol ( 19, 20 ) methods, designated methods 1 to 5 respectively, for the extraction of lipid classes from LDL. The lipids extracted by each method were analyzed by MS in a high-resolution instru-ment, which allowed identifi cation based on accurate mass formula prediction. Evaluation of solvent systems and sta-tistical analysis of lipid extractability was assessed by two approaches; data set 1 included only lipid species identifi ed by processing using MzMatch and manual identifi cation, whereas data set 2 included all ions within delimited time windows in the chromatograms. Together, these approaches provided a robust method for determining differences in the profi le of extraction by the various protocols, and gave very comparable results. Although several previous studies have reported similar extractability for predominant lipid classes between three of the solvent systems here studied, we found that while the solvent systems were indeed similar The effect of the different solvent extraction systems on
the extractability of lipid is also demonstrated in the ASCA score and loading plots ( Fig. 5A and B , respectively). The more polar lipid classes are situated on the right side of the loading plot ( Fig. 5B ), i.e., PC, PE, CS, SM, LacCer, and lysoPC, and are more effectively extracted using method 3 (fi lled triangles on the right side of the score plot Fig. 5A ), which also gave the most effi cient total lipid extraction. Likewise, the more hydrophobic lipid classes situated on the left side of the loading plot ( Fig. 5B ), such as FA 2 and CEs, are more effectively extracted with method
5 (fi lled diamonds on the left side in Fig. 5A ), which also gave the lowest total lipid extraction. Lipid classes posi-tioned in the lower section of the loading plot ( Fig. 5B ),
such as PI and some compounds from FA (FA 1 ), TAG, and
CE classes, are more effectively extracted with method 1 (fi lled circles in Fig. 5A ). Interestingly, some lipid classes appear to display heterogeneous behavior with respect to their extraction effi ciency with the different methods, shown for example by three distinct clusters for FAs (fi lled triangles, delimited by dashed line) and two distinct clus-ters for CEs (squares, delimited by solid line) on the load-ing plot ( Fig. 5B ). Examination of the mass spectrometric data indicates that saturated FAs, clustered in the region labelled FA 1 , are better extracted using solvent system 3,
monounsaturated FAs clustered in FA 2 are better extracted
using solvent system 5, and polyunsaturated FAs, clustered in FA 3 are best extracted using solvent system 3 .
Evaluation of lipid extractability using data set 2 (data from XCMS platform)
As can be seen from supplementary Fig. III, the extrac-tion protocol infl uenced the extractability of the different lipids noticed for each individual chromatographic re-gion. The ion intensities of lipid species in the individual chromatographic region were summed (representing data set 2). This data set contains all features identifi ed by XCMS platform in each chromatographic window regard-less of whether they could be identifi ed as lipids. The in-clusion of data that were not initially identifi ed as lipids gives a more robust analysis; at the same time the inclusion of ions not specifi cally identifi ed as lipids or the inclusion of nonlipid species could be misleading. Methods 1 and 3 gave better total extraction (supplementary Fig. VI), and
TABLE 2. Signifi cance ( P values) of the effect of solvent systems on the extraction of lipids calculated using data set 1 (identifi ed compounds)
Solvent Systems
Lipid Classes
All CSs TAGs CEs FAs LacCer PIs PEs PCs SMs LysoPCs
All fi ve <0.001 <0.001 <0.001 <0.001 <0.001 <0.001 <0.001 0.045 <0.001 <0.001 <0.001 1 versus 2 0.003 0.087 0.002 0.006 0.001 <0.001 <0.001 0.062 0.353 0.138 0.141 1 versus 3 0.002 0.088 0.395 0.026 0.001 0.008 0.001 0.313 0.025 <0.001 0.002 1 versus 4 <0.001 0.061 0.082 <0.001 <0.001 <0.001 0.001 0.436 0.074 0.002 0.018 1 versus 5 0.002 0.001 0.034 <0.001 <0.001 <0.001 0.001 0.001 0.001 <0.001 <0.001 2 versus 3 <0.001 0.014 0.005 0.014 0.143 <0.001 0.001 0.072 0.03 <0.001 0.002 2 versus 4 0.003 0.484 0.003 0.006 0.005 <0.001 0.002 0.701 0.092 0.001 0.154 2 versus 5 0.008 <0.001 0.001 <0.001 <0.001 0.006 <0.001 0.235 <0.001 0.01 0.005 3 versus 4 <0.001 0.016 0.235 0.427 0.01 0.127 0.001 0.369 0.086 0.016 0.002 3 versus 5 0.0001 0.001 0.133 0.003 0.001 <0.001 0.001 0.02 0.001 <0.001 <0.001 4 versus 5 0.003 0.002 0.205 <0.001 0.001 <0.001 0.001 0.006 <0.001 <0.001 0.002
P values were estimated using permutation test with 1,000 permutations. Bold text indicates a statistically signifi cant effect ( P < 0.05).
at UNIVERSIDADE DE AVEIRO, on September 20, 2016
www.jlr.org
Downloaded from
.html
were almost completely absent using this method. Methods 1 (Folch method) and 2 (Bligh and Dyer method) showed similar extractability for PCs, CEs, and TAGs based on total lipid intensities, which is in accordance with previously published reports ( 15 ), but for other lipid classes methods 2 and 4 gave lower lipid extractability than methods 1 and 3, apart from for LacCer where method 4 was best. Overall the data suggest that methods 1 and 3, corresponding to the Folch and acidifi ed Bligh and Dyer methods, respec-tively, are most suitable for broad-based lipidomic studies of LDL, whereas other methods would be best for studies directed at some specifi c lipid species. While the analysis here has been derived from data on LDL lipid extraction, it seems likely that it would also be useful for selecting the most suitable solvent system for targeted detection of par-ticular lipid classes in other sample types.
While the main aim of this work was to determine the best solvent for lipid extraction from LDL, an inevitable consequence of the study was an extensive catalog of the lipid species present in LDL. The variety of lipid structures identifi ed in the LDL population in one run ( Table 1 and supplementary Table I) was substantially increased as a consequence of acquiring data in a high-resolution ana-lyzer operating in both positive and negative ion modes (polarity switching); this also facilitated matching of spe-cifi c lipid species that occurred in different ionized forms in the two modes and reduced the possibility of double counting. LDL of normolipidemic individuals shows con-siderable structural variability in its lipid species, with more than 350 individual molecular species from a broad range of lipid subclasses being identifi ed in this study. In fact, the number of individual lipid species present is likely to be higher than suggested by the numbers identifi ed in this study, as the identifi cation is based on the accurate m/z value of the ion, and only the total number of carbons and double bonds can be determined, so isomers with dif-ferent carbon chain lengths in acyl and in ether-linked phospholipids are not distinguished. Interestingly, glyce-ro-PSs were not identifi ed in the LDL extracts, despite the fact that they have previously been identifi ed in plasma ( 44–46 ), suggesting that they could be confi ned to other lipoproteins. The absence of PSs in LDL may not be sur-prising given that they are generally only localized in the for extraction of the predominant lipid classes, there were
striking differences in the extraction of minor lipid classes. Based on the difference in extractability of individual lipid classes by the solvent systems tested, the optimum solvent systems for each class can be summarized ( Table 4 ). For instance, method 4 (MeOH-TBME method) is the most suitable for the sphingolipidomic studies, whereas method 5 (hexane-isopropanol) is optimal for the extraction of apolar lipids such as CEs and FAs, though it has limita-tions as some lipid classes (PIs, LAAs, CS, and lysoPCs) Fig. 5. Principal component analysis plots for lipids in fi ve sol-vent systems for data set 1 using ASCA model. A: Principal compo-nent analysis score plot of total lipids using ASCA model. B: Principal component analysis loading plot for the individual lipid classes in the fi ve solvent systems.
TABLE 3. Signifi cance ( P values) of the effect of solvent systems on the extraction of lipids calculated using data set 2 (all compounds in the elution zones)
Solvent Systems
Lipid Classes
All CSs TAGs CEs FAs LacCer PIs PEs PCs SMs LysoPCs
All fi ve <0.001 <0.001 <0.001 <0.001 <0.001 <0.001 <0.001 0.422 0.508 <0.001 <0.001 1 versus 2 <0.001 <0.001 <0.001 0.002 <0.001 0.01 <0.001 — — 0.294 0.672 1 versus 3 0.008 0.004 0.002 <0.001 0.002 0.001 <0.001 — — <0.001 0.004 1 versus 4 0.008 0.598 0.002 0.002 0.012 0.001 0.004 — — <0.001 0.442 1 versus 5 0.002 0.004 0.006 <0.001 0.006 0.003 0.004 — — 0.002 0.004 2 versus 3 0.062 0.632 0.034 0.082 0.528 0.001 0.02 — — 0.002 <0.001 2 versus 4 0.002 0.004 0.006 <0.001 0.002 0.001 <0.001 — — <0.001 0.688 2 versus 5 0.002 0.004 0.004 0.004 0.002 0.002 <0.001 — — 0.014 <0.001 3 versus 4 0.002 0.004 <0.001 <0.001 0.014 0.015 0.004 — — 0.032 0.002 3 versus 5 0.006 0.002 0.002 0.002 0.01 <0.001 0.002 — — 0.002 0.002 4 versus 5 0.002 0.006 <0.001 0.004 0.012 <0.001 0.044 — — 0.002 0.004
P values were estimated using permutation test with 1,000 permutations. Bold text indicates a statistically signifi cant effect ( P < 0.05).
at UNIVERSIDADE DE AVEIRO, on September 20, 2016
www.jlr.org
Downloaded from
.html
HexCer with d16:1, d18:1, and d18:2 chains, have been reported previously in normolipidemic LDL particles at micromolar levels ( 50 ). LDL particles are known carriers of FFAs, which in our study were found to be predomi-nantly stearoyl chains (18:0); these may be involved in the formation and stabilization of the lipid droplet, as recently reported for PLA 2 -modifi ed LDL particles ( 54 ).
Lyso-phos-pholipids are also known components of LDL ( 23 ) and plasma ( 44, 45 ), and may increase as result of oxidative damage ( 55 ).
CS species even though they have been previously re-ported in LDL ( 56 ) and at a submicromolar concentration range in the plasma ( 57 ), their localization within the par-ticle remains uncertain. Likewise, other sulfur-containing lipids such as STs, previously observed in mammalian plasma ( 58, 59 ) and interestingly found at elevated levels in ovarian tissue cancer ( 60 ) but lowered in patients with end-stage renal disease ( 59 ), are likely localized at the sur-face of lipoproteins. The STs identifi ed in this study, to-gether with LacCer and HexCer contribute to the galactose and glucose residues quantifi ed previously in extracts of LDL samples ( 61 ). Additionally, we identifi ed LAAs in the lipid extracts ( Table 1 ) that have not previously been re-ported in LDL particles. Acyl-glycines, carnitines, acyl-taurines, and acyl-dopamines are typical components of mammalian brain and spinal cord extracts ( 62 ) and may be substrates of fatty acid amide hydrolase ( 63, 64 ). Over-all, the complexity of lipid species detected in the LDL extracts is quite remarkable and even though most of the lipid classes (TAG, CE, PC, SM, PE, PI, and Cer) have pre-viously been identifi ed as LDL components, the study reported here represents an in-depth exploration of the lipidome in one analysis, including some minor lipids be-ing profi led for the fi rst time as components in LDL.
CONCLUDING REMARKS
In summary, more than 350 individual molecular lipid species in 19 lipid subclasses were identifi ed in the LC-MS spectra of LDL lipid extracts. While all fi ve solvent systems external lipid leafl et during cellular apoptosis, and their
inclusion in the lipid monolayer surrounding the LDL particle would expose them to the plasma.
The roles and localization of predominant lipid classes in LDL such as CEs, PCs, SMs, free cholesterol, and TAGs are known . Choline phospholipids located at the surface of LDL particles provide compartmentalization for CEs and TAGs and support for the ApoB-100 protein. SMs are thought to act as adhesive molecules, interacting favorably with cholesterol and promoting stabilization of the liquid-ordered phase ( 47–49 ). The high structural variability of SMs that we observed in LDL, with carbon chains of 33:1; 35:1, 35:0, 37:0; 39:1, 41:0, and 43:0 (supplementary Table I) agree with previously published data ( 23, 50 ). We also characterized a number of minor phospholipid classes in the LDL. The PEs observed were predominantly ether-linked PE species, with less than one-third corresponding to acyl-PE, in agreement with previous fi ndings in LDL from normolipidemic individuals ( 51 ). In tissues, ether-PEs have been suggested to act as antioxidants by chelat-ing cupric ions and protectchelat-ing other PLs from oxidation ( 52, 53 ), but their function in LDL is as yet unknown. The major PI species detected in this study was 18:0/20:4 PI ( m/z 885.5489), which agrees with the PI composition of plasma ( 44, 45 ). Glycosylated lipids, such as LacCer and Fig. 6. Principal component analysis score plot for total lipids in fi ve solvent systems for data set 2 using ASCA model.
TABLE 4. Evaluation of the most and least effective solvent system for the extraction of lipid classes in LDL
Lipid Classes
Data Set 1 Data Set 2
Best Worst Best Worst
Total 3 5 1 2 CSs 3, 1 a 5 3, 2 5 TAGs 1, 3, 4 2 1 2 CEs 5 (1) 2 1 2, 3 FAs 5 (1) 2, 3 5 (4) 2, 3 LacCer 4, 3 5 4 5 PIs 1 5 1 5 PEs 3, 1, 2, 4 5 — — PCs 3,4 5 — — SMs 3 5 3 5 LysoPCs 3 5 3 5
Statistical analysis of data set 1 and data set 2 was performed using the ASCA model with test permutations (details in supplementary data online). Numbers in parentheses indicated the second best solvent system for extraction.
a
When no statistical difference is observed, all of them are indicated.
at UNIVERSIDADE DE AVEIRO, on September 20, 2016
www.jlr.org
Downloaded from
.html
14 . Feki , N. C. , P. Thérond, M. Couturier, G. Liméa, A. Legrand, P. Jouannet, and J. Auger. 2004 . Human sperm lipid content is modi-fi ed after migration into human cervical mucus. Mol. Hum. Reprod. 10 : 137 – 142 .
15 . Iverson , S. J. , S. L. Lang , and M. H. Cooper . 2001 . Comparison of the Bligh and Dyer and Folch methods for total lipid determina-tion in a broad range of marine tissue. Lipids . 36 : 1283 – 1287 . 16 . Matyash , V. , G. Liebisch, T. V. Kurzchalia, A. Shevchenko, and D.
Schwudke. 2008 . Lipid extraction by methyl-tert-butyl ether for high-throughput lipidomics. J. Lipid Res. 49 : 1137 – 1146 .
17 . Byeon , S. K. , J. Y. Lee , and M. H. Moon . 2012 . Optimized extrac-tion of phospholipids and lysophospholipids for nanofl ow liquid chromatography-electrospray ionization-tandem mass spectrom-etry. Analyst . 137 : 451 – 458 .
18 . Löfgren , L. , M. Ståhlman, G. B. Forsberg, S. Saarinen, R. Nilsson, and G. I. Hansson. 2012 . The BUME method: a novel automated chloroform-free 96-well total lipid extraction method for blood plasma. J. Lipid Res. 53 : 1690 – 1700 .
19 . Hara , A. , and N. S. Radin . 1978 . Lipid extraction of tissues with a low-toxicity solvent. Anal. Biochem. 90 : 420 – 426 .
20 . Zhang , R. , M. L. Brennan, Z. Shen, J. C. MacPherson, D. Schmitt, C. E. Molenda, and S. L. Hazen. 2002 . Myeloperoxidase functions as a major enzymatic catalyst for initiation of lipid peroxidation at sites of infl ammation. J. Biol. Chem. 277 : 46116 – 46122 .
21 . Hammad , S. M. , J. S. Pierce, F. Soodavar, K. J. Smith, M. M. Al Gadban, B. Rembiesa, R. L. Klein, Y. A. Hannun, J. Bielawski, and A. Bielawska. 2010 . Blood sphingolipidomics in healthy hu-mans: impact of sample collection methodology. J. Lipid Res. 51 : 3074 – 3087 .
22 . Kosicek , M. , S. Kirsch, R. Bene, Z. Trkanjec, M. Titlic, L. Bindila, J. Peter-Katalinic, and S. Hecimovic. 2010 . Nano-HPLC-MS analy-sis of phospholipids in cerebrospinal fl uid of Alzheimer’s disease patients–a pilot study. Anal. Bioanal. Chem. 398 : 2929 – 2937 . 23 . Wiesner , P. , K. Leidl, A. Boettcher, G. Schmitz, and G. Liebisch.
2009 . Lipid profi ling of FPLC-separated lipoprotein fractions by electrospray ionization tandem mass spectrometry. J. Lipid Res. 50 : 574 – 585 .
24 . Graessler , J. , D. Schwudke, P. E. Schwarz, R. Herzog, A. Shevchenko, and S. R. Bornstein. 2009 . Top-down lipidomics reveals ether lipid defi ciency in blood plasma of hypertensive patients. PLoS ONE . 4 : e6261 .
25 . Jerlich , A. , A. R. Pitt, R. J. Schaur, and C. M. Spickett. 2000 . Pathways of phospholipid oxidation by HOCl in human LDL detected by LC-MS. Free Radic. Biol. Med. 28 : 673 – 682 .
26 . Yue , H. , S. A. Jansen, K. I. Strauss, M. R. Borenstein, M. F. Barbe, L. J. Rossi, and E. Murphy. 2007 . A liquid chromatography/mass spectrometric method for simultaneous analysis of arachidonic acid and its endogenous eicosanoid metabolites prostaglandins, dihydroxyeicosatrienoic acids, hydroxyeicosatetraenoic acids, and epoxyeicosatrienoic acids in rat brain tissue. J. Pharm. Biomed. Anal. 43 : 1122 – 1134 .
27 . Laemmli , U. K. 1970 . Cleavage of structural proteins during the assembly of the head of bacteriophage T4. Nature . 227 : 680 – 685 . 28 . Mahley , R. W. , T. L. Innerarity, S. C. Rall, Jr., and K. H. Weisgraber.
1984 . Plasma lipoproteins: apolipoprotein structure and function. J. Lipid Res. 25 : 1277 – 1294 .
29 . Retra , K. , O. B. Bleijerveld, R. A. van Gestel, A. G. Tielens, J. J. van Hellemond, and J. F. Brouwers. 2008 . A simple and universal method for the separation and identifi cation of phospholipid mo-lecular species. Rapid Commun. Mass Spectrom. 22 : 1853 – 1862 . 30 . Zheng , L. , R. T’Kind, S. Decuypere, S. J. von Freyend, G. H. Coombs,
and D. G. Watson. 2010 . Profi ling of lipids in Leishmania donovani using hydrophilic interaction chromatography in combination with Fourier transform mass spectrometry. Rapid Commun. Mass Spectrom. 24 : 2074 – 2082 .
31 . Tautenhahn , R. , G. J. Patti, D. Rinehart, and G. Siuzdak. 2012 . XCMS online: a web-based platform to process untargeted metabo-lomic data. Anal. Chem. 84 : 5035 – 5039 .
32 . Smith , C. A. , E. J. Want, G. O’Maille, R. Abagyan, and G. Siuzdak. 2006 . XCMS: processing mass spectrometry data for metabolite profi ling using nonlinear peak alignment, matching, and identifi -cation. Anal. Chem. 78 : 779 – 787 .
33 . Scheltema , R. A. , A. Jankevics, R. C. Jansen, M. A. Swertz, and R. Breitling. 2011 . PeakML/mzMatch: a fi le format, Java library, R library, and tool-chain for mass spectrometry data analysis. Anal.
Chem. 83 : 2786 – 2793 .
evaluated showed only small differences in the extractabil-ity of the predominant lipid classes, major differences were observed in the extraction of minor and less abun-dant lipid classes. Based on our fi ndings, the most suitable single solvent systems for lipidomic studies of LDL parti-cles are the Folch method and the acidifi ed Bligh and Dyer method for optimum lipidome coverage. This com-prehensive study provides guidance for choosing the best solvent system for profi ling a particular lipid class, although choice of optimal extraction conditions is always a com-promise, and it is clear that a preliminary study on the ef-fectiveness of different solvent systems and data processing procedures is useful prior to implementing routine lipi-dome analysis.
G.J.B. acknowledges the Scottish Metabolomics Facility (SCOTMET). C.M.S. would like to acknowledge the 08-EuroMEMBRANES-FP-021 consortium.
REFERENCES
1 . Greig , F. H. , S. Kennedy , and C. M. Spickett . 2012 . Physiological ef-fects of oxidized phospholipids and their cellular signaling mecha-nisms in infl ammation. Free Radic. Biol. Med. 52 : 266 – 280 . 2 . Folch , J. , M. Lees , and G. H. Sloane Stanley . 1957 . A simple method
for the isolation and purifi cation of total lipides from animal tis-sues. J. Biol. Chem. 226 : 497 – 509 .
3 . Bligh , E. G. , and W. J. Dyer . 1959 . A rapid method of total lipid extraction and purifi cation. Can. J. Biochem. Physiol. 37 : 911 – 917 . 4 . Saville , J. T. , Z. Zhao, M. D. Wilcox, S. J. Blanksby, and T. W.
Mitchell . 2010 . Detection and quantifi cation of tear phospholip-ids and cholesterol in contact lens deposits: the effect of contact lens material and lens care solution. Invest. Ophthalmol. Vis. Sci. 51 : 2843 – 2851 .
5 . Rantamäki , A. H. , T. Seppänen-Laakso, M. Oresic, M. Jauhiainen, and J. M. Holopainen. 2011 . Human tear fl uid lipidome: from com-position to function. PLoS ONE . 6 : e19553 .
6 . Touboul , D. , S. Roy, D. P. Germain, A. Baillet, F. Brion, P. Prognon, P. Chaminade, and O. Laprévote. 2005 . Fast fi ngerprinting by MALDI-TOF mass spectrometry of urinary sediment glycosphingo-lipids in Fabry disease. Anal. Bioanal. Chem. 382 : 1209 – 1216 . 7 . Kim , H. , H. K. Min, G. Kong, and M. H. Moon. 2009 . Quantitative
analysis of phosphatidylcholines and phosphatidylethanolamines in urine of patients with breast cancer by nanofl ow liquid chro-matography/tandem mass spectrometry. Anal. Bioanal. Chem. 393 : 1649 – 1656 .
8 . Palmerini , C. A. , C. Saccardi, F. Ferracci, and S. Arienti. 2011 . Lipid patterns in the saliva of smoking young adults. Hum. Exp. Toxicol. 30 : 1482 – 1488 .
9 . Pasvogel , A. E. , P. Miketova , and I. M. Moore . 2010 . Differences in CSF phospholipid concentration by traumatic brain injury out-come. Biol. Res. Nurs. 11 : 325 – 331 .
10 . Miketova , P. , K. Kaemingk, M. Hockenberry, A. Pasvogel, J. Hutter, K. Drull, and I. M. Moore. 2005 . Oxidative changes in cerebral spi-nal fl uid phosphatidylcholine during treatment for acute lympho-blastic leukemia. Biol. Res. Nurs. 6 : 187 – 195 .
11 . Morera , S. , A. I. Castellote, O. Jauregui, I. Casals, and M. C. López-Sabater. 2003 . Triacylglycerol markers of mature human milk. Eur.
J. Clin. Nutr. 57 : 1621 – 1626 .
12 . Schiller , J. , S. Hammerschmidt, H. Wirtz, J. Arnhold, and K. Arnold. 2001 . Lipid analysis of bronchoalveolar lavage fl uid (BAL) by MALDI-TOF mass spectrometry and 31P NMR spectroscopy. Chem. Phys. Lipids . 112 : 67 – 79 .
13 . Georas , S. N. , E. Berdyshev, W. Hubbard, I. A. Gorshkova, P. V. Usatyuk, B. Saatian, A. C. Myers, M. A. Williams, H. Q. Xiao, M. Liu, et al . 2007 . Lysophosphatidic acid is detectable in human broncho-alveolar lavage fl uids at baseline and increased after segmental al-lergen challenge. Clin. Exp. Allergy . 37 : 311 – 322 .
at UNIVERSIDADE DE AVEIRO, on September 20, 2016
www.jlr.org
Downloaded from
.html