This work is licensed under the Creative Commons Attribution-NonCommercial-ShareAlike 4.0 International License.
Impact of cutoff points on adolescent sedentary
behavior measured by accelerometer
Impacto dos pontos de corte para comportamento sedentário mensurado por
acelerômetro em adolescentes
AUTHOR’S Ially Rayssa Dias Moura1
Arthur Oliveira Barbosa1,2
Inácio Crochemore Mohnsam da Silva4,5
Marcelo Romanzini6,7
Alcides Prazeres Filho1,2
José Cazuza de Farias Júnior1,2,3
1 Study and Research Group in Epidemiology of Physical Activity, João Pessoa, Paraiba, Brazil. 2 Associate Post-Graduation Program in Physical Education. João Pessoa, Paraiba, Brazil. 3 Federal University of Paraíba. Department of Physical Education. João Pessoa, Paraiba, Brazil. 4 Federal University of Pelotas, Post-Graduate Program in Epidemiology, Pelotas, Rio Grande do Sul, Brazil.
5 Associate Post-Graduation Program in Physical Education, Pelotas, Rio Grande do Sul, Brazil. 6 Londrina State University, Department of Physical Education, Londrina, Paraná, Brazil. 7 Associate Post-Graduation Program in Physical Education UEM/UEL, Londrina, Paraná, Brazil. CORRESPONDING
Ially Rayssa Dias Moura
Federal University of Paraiba, Department of Physical Education, Research Study Group in the Epidemiology of Physical Activity – GEPEAF. Campus I, Cidade Universitária, João Pessoa, Paraíba, Brazil.
Zip code: 58059-900. DOI
10.12820/rbafs.24e0071
ABSTRACT
The aim of this study was to analyze the impact of cutoff points in defining sedentary behavior (SB) time and prevalence, measured by accelerometers in adolescents from Northeastern Brazil. This is a cross-sectional study with adolescents aged between 10 and 14 years from public schools in João Pessoa, Paraíba state, conducted in 2014. SB was measured by an accelerometer (ActiGraph GT3X+) and the following cutoff points were applied: Evenson (≤ 25 counts/15sec), Puyau (< 800 counts/60sec), Vanhelst (≤ 400 counts/60sec), Hänggi (< 3 counts/1sec) and Romanzini (≤ 180 counts/15sec), along with the 20 and 60-minute accelerometer nonwear time. To compare the av-erage and prevalence of excessive SB time (≥ 8 hours/day) between cutoff points, one-way ANOVA for repeated measures (Bonferroni post hoc) and the Cochran test, respectively, were used. There were significant differences in average SB between the cutoff points analyzed (p > 0.05), ranging from 37.44 min/day (Romanzini: 547.37 min/day vs. Vanhelst: 584.81 min/day) to 370.44 min/ day (Hänggi: 310.51 min/day vs. Puyau: 680.95 min/day) for the 20-minute nonwear criterion; and from 81.52 min/day (Evenson: 502.41 min/day vs. Romanzini: 583.93 min/day) to 361.94 min/day (Hänggi: 354.58 min/day vs. Puyau: 716.52 min/day) for the 60-minute criterion. The prevalence of excessive SB varied from 3.3% (Hänggi) to 99.3% (Puyau). Average daily SB and the prevalence of excessive SB in the adolescents showed marked differences between the cutoff points assessed. Keywords: Sedentary lifestyle; Accelerometry; Adolescent.
RESUMO
O objetivo deste estudo foi analisar o impacto dos pontos de corte para definir comportamento sedentário (CS) no tempo e prevalência desse comportamento, mensurado por acelerômetros, em adolescentes no Nordeste do Brasil. Estudo transversal, com adolescentes de 10 a 14 anos de idade de escolas públicas de João Pessoa, Paraíba, em 2014. O CS foi mensurado por acelerômetro (ActiGraph GT3X+) e foram aplicados os seguintes pontos de corte: Evenson (≤ 25 counts/15seg), Puyau (< 800 counts/60seg), Vanhelst (≤ 400 counts/60seg), Hänggi (< 3 counts/1seg) e Romanzini (≤ 180 counts/15seg), combinados às definições de 20 e 60 minutos de não uso do acelerômetro. Para comparar o tempo médio e a prevalência de tempo excessivo de CS (≥ 8 horas/dia), entre os pontos de corte, utilizou-se a ANOVA ONE-WAY para medidas repetidas (post hoc de Bonferroni) e o teste de Cochran, respectivamente. Houve diferenças significativas na média de CS entre todos os pontos de corte analisados (p < 0,05), variando de 37,44 min/dia (Romanzini: 547,37 min/dia vs. Vanhelst: 584,81 min/dia) a 370,44 min/dia (Hänggi: 310,51 min/dia vs. Puyau: 680,95 min/dia) para o critério de 20 minutos de não uso; e de 81,52 min/dia (Evenson: 502,41 min/dia vs. Romanzini: 583,93 min/dia) a 361,94 min/dia (Hänggi: 354,58 min/dia vs. Puyau: 716,52 min/dia) para o de 60 minutos. A prevalência de exposição excessiva de CS variou de 3,3% (Hänggi) a 99,3% (Puyau). O tempo médio diário e a prevalência de exposição excessiva de CS de adolescentes apresentaram diferenças acentuadas entre os pontos de corte analisados.
Palavras-chave: Estilo de vida sedentário; Acelerometria; Adolescente.
Introduction
Sedentary behavior (SB) has typically been assessed by measuring time spent watching television and/or com-bined with other electronic media indicators
(com-puter, videogame)1. However, adolescents spend 60%
of total sedentary time on other SB , such as chatting with friends, attending class, sitting during commutes, and using a cell phone or tablet2.Although there are
questionnaires that measure SB in all the domains3,
they are generally innacurate4.
In this respect, accelerometers have been increas-ingly used5 to measure SB (total time, bouts and
breaks)6, due to their accuracy3,7 and non-susceptibility
to memory bias8. However, there is no consensus
re-garding data reduction criteria, namely epoch length, number of valid days, defining accelerometer nonwear time and valid days, and cutoff points to establish SB9.
In a systematic review, Migueles et al.10 identified
20 cutoff points used to define SB in children and ad-olescents with Actigraph accelerometers. The thresh-old values varied from 25 counts/15 seconds to 800 counts/60 seconds for the vertical vector and from 3 counts/1 second to 305 counts/5 seconds for the vector magnitude10. This may lead to differences in estimates
of SB3,8, and in the associations between these
indica-tors and health outcomes11.
Studies with children found differences in average SB time of 1.5 hours/day12 and 4 hours/day13 between
cutoff points. These results cannot be generalized for adolescents because their behavior pattern differ from those observed in children14. The study in adolescents15
estimated the sensitivity and specificity of six cutoff points, for five sedentary activities, but did not com-pare SB time and prevalence or consider different cri-teria to establish accelerometer nonwear time. The aim of this study was to analyze the impact of cutoff points in defining SB time and prevalence, measured by ac-celerometers in adolescents from Northeastern Brazil.
Methods
This is a cross-sectional epidemiological study that used data from the first collection year (2014) of the Longitudinal Study on Sedentary Behavior, Physical Activity, Dietary Habits and Health of Adolescents (LONCAAFS). The aim of LONCAAFS was to analyze the inter-relations between physical activity, SB, dietary habits, quality of life and health indicators of adolescents. This study was approved by the Human Research Ethics Committee of the Health Sciences Center, at the Federal University of Paraíba (protocol no. 240/13). The students that participated in the study were authorized by their parents/legal guardians, who gave their written informed consent.
The target population was composed of adolescents aged between 10 and 14 years, in the 6th grade of
munici-pal and state schools of João Pessoa, Paraíba state, Brazil. The following were considered to calculate sample size:
reference population size of 9,520 6th grade students;
outcome prevalence of 50%, 95% confidence interval, maximum acceptable error of 4%; design effect (deff) of two and 40% increase to compensate for possible losses and refusals, resulting in a sample of 1,582 adolescents.
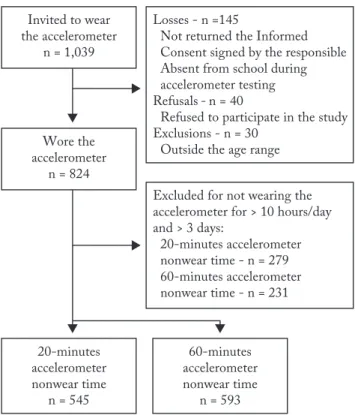
This study used data from a subsample of adoles-cents that wore accelerometers, corresponding to 60% of the sample. Seventeen of the 28 schools in the sam-ple were randomly selected, distributed proportional-ly by geographic region (north, south, east and west zones) and by the number of students enrolled in each school. All the six graders at the selected schools were invited to wear the accelerometer. Figure 1 provides in-formation on the sampling process.
Data were collected at the schools from February to June and August to December 2014. Questionnaires in the form of face-to-face interviews were applied by previously trained scientific initiation graduate students enrolled in the physical education and nutrition cours-es, and who followed the standard collection protocol.
The following sociodemographic variables were measured: sex; age (10-11 and 12-14 years); school shift (morning and afternoon); economic class according to Brazilian Association of Research Company criteria16
(A/B – upper class; C – middle class; D/E – lower class) and mother’s schooling (incomplete elementary, com-plete elementary and comcom-plete secondary and/or uni-versity). Weight and height were measured to determine nutritional status, defined based on established WHO criteria17: low/normal weight vs overweight/obese.
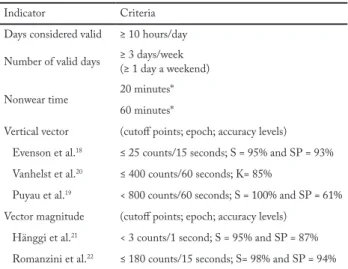
SB was measured by GT3X+ accelerometers (Ac-tiGraph, Pensacola, FL, USA). The students were in-structed to wear the accelerometers for seven consec-utive days. The device was attached to the right side of their waist and removed only for bathing, sleeping, water activities and martial arts (to avoid injury). All the accelerometers were programmed to collect data at a frequency of 30 Hz. The data recorded were ana-lyzed by the Actilife 6.12 program, according to the criteria described in Table 1. Epochs between 1 and 15 were reintegrated for 60 seconds, because this Actilife version analyzes accelerometer data only with cutoff points based on 60-second epochs. Thus, to adjust ep-och length, thresholds based on 1 and 15 seconds were multiplied by 60 (< 3 counts/1 second x 60 = < 180 counts/60 sec) and four (≤ 25 counts/15 sec x 4 = ≤ 100 counts/60 sec), respectively.
SB was determined by five different cutoff points, three related to the vertical axis (Evenson et al.18,
Puy-au et al.19 and Vanhelst et al.20) and two to magnitude
(Hänggi et al.21 and Romanzini et al.22). These cutoff
points and criteria to define ActiGraph accelerometer nonwear time were selected because they are the most widely used in adolescents10.
To determine the average daily SB time, the weighted mean was calculated as follows: average SB time (hours/day) during the week (Monday to Friday) multiplied by 5 and by 2 for weekends (Saturday and Sunday), dividing the sum of these values by 7.
Excessive SB was defined arbitrarily as ≥ 8 hours per day. This cutoff point was used due to the absence of a criterion to define excessive SB measured by ac-celerometer and because it is the average time per day adolescents spend on this behavior3.
Losses were deemed to be students who did not provide their parents’ written informed consent or were absent from school on at least three occasions when the accelerometers were worn. Excluded were students younger than 10 and older than 14 years, or with any impairment that prevented or limited their ability to complete the questionnaire and/or engage in physical activity, as well as those who did not meet the acceler-ometer data reduction criteria.
Descriptive data analysis consisted of applying the mean and standard deviation to the quantitative varia-bles and frequency distribution (absolute and relative) to the qualitative variables. Normal data distribution was assessed using the Kolmogorov-Smirnov test (p ≥ 0.05) and homogeneity of variances applying the Levene test. One-way ANOVA for repeated measures, with the Bonferroni post hoc test, was used to compare the aver-age time per day students spent on SB, based on different cutoff points. The dependent t-test was applied to com-pare average SB times between the 20 and 60-minute accelerometer nonwear criteria for the same cutoff point.
The prevalence of excessive SB was compared be-tween cutoff points using the Cochran and McNemar tests for multiple comparisons. The significance level was set at p < 0.05. For the McNemar test, this p-value was divided by the number of comparisons (p/10). Sta-tistical analyses were carried out in Stata version 13.0.
Results
A total of 1,039 students were invited to wear the ac-celerometer. After losses, refusals and exclusions, the sample consisted of 545 and 593 adolescents for the 20 and 60 -minute accelerometer nonwear criteria, respec-tively (Figure 1). Subsequent calculations indicated that
the samples (n = 545 and n = 593) exhibited a power greater than or equal to 85% when alpha was set at 5%, for the differences between estimated SB.
Figure 1 – Flowchart of the sample of adolescents 10 to 14-year olds from public schools in João Pessoa, Paraíba, considering the 20 and 60-minute Actigraph GT3X+ accelerometer nonwear criteria.
The sociodemographic characteristics and body mass index showed no significant differences between the accelerometer nonwear criteria (p ≥ 0.05) – Table 1. Significant differences (p < 0.001) were identified be-tween adolescents excluded and included in the present study (data not presented in the tables) for the variables age group (12-14 years: 55.4% vs. 10-11 years: 38.8%) in the 20-minute nonwear criterion, and age group (12-14 years: 50.1% vs. 10-11 years: 34.2%) and mother’s schooling (incomplete elementary: 46.2% vs. complete elementary or more: 37.9%) for the 60-minute crite-rion. A majority of the adolescents were middle-class girls, aged 10-11 years, whose mother had complete el-ementary schooling, and who studied in the afternoon; more than a third of them were overweight (Table 1).
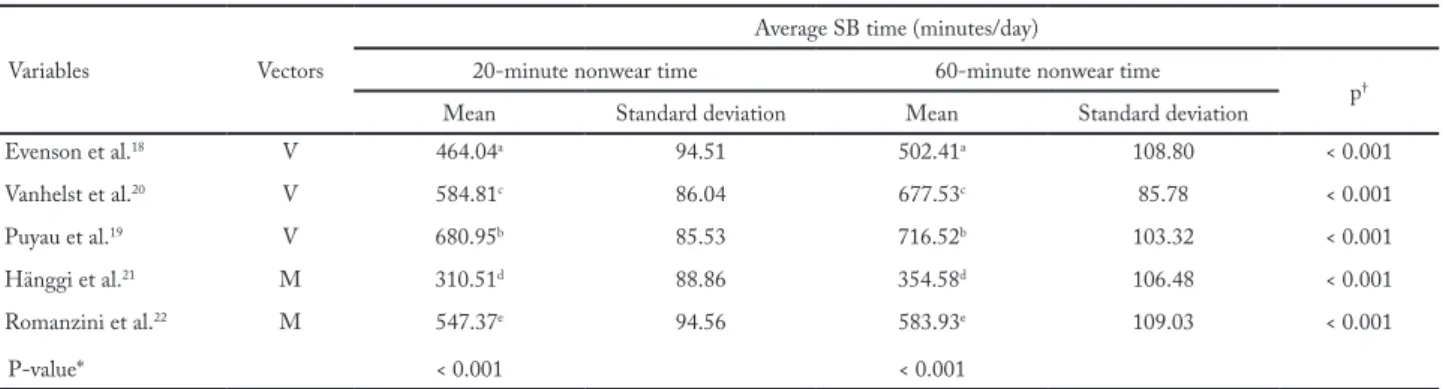
Significant differences were found in average SB time between the cutoff points analyzed, for both accelerometer nonwear criteria (20 and 60 minutes; F = 1309.64; p < 0.001 and F = 1174.72; p < 0.001, respectively), ranging from 37.44 min/day (Roman-zini: 547.37 min/day vs. Vanhelst: 584.81 min/day) to
370.44 min/day (Hänggi: 310.51 min/day vs. Puyau: 680.95 min/day) for the 20-minute criterion; and from 81.52 min/day (Evenson: 502.41 min/day vs. Roman-zini: 583.93 min/day) to 361.94 min/day (Hänggi: 354.58 min/day vs. Puyau: 716.52 min/day) for the 60-minute criterion (Table 2). The magnitude of the differences between average times was more marked when the 20-minute criterion was used. The prevalence of excessive SB time was different between the cut-off points analyzed (p < 0.001), except between Puyau et al.19 (99.3%) and Vanhelst et al.20 (99.2%), for the
60-minute nonwear criterion (Figure 2). The highest prevalence of excessive SB was produced by the cutoff point of Puyau et al.19 (20 minutes: 99.1% and 60
min-utes: 99.3%) and lowest by Hänggi et al.21 (20 minutes:
3.3% and 60 minutes: 10.5%).
Figure 2 – Comparison of the proportion of adolescents with ex-cessive SB time (≥ 8 hours/day) between the different accelerometer nonwear cutoff points and criteria in adolescents aged 10 to 14 years from João Pessoa, Paraíba, 2014.
† = not significant differences.
Discussion
Marked differences were observed in estimated SB between the most widely used cutoff points in GT3X accelerometers (ActiGraph) to define this behavior in adolescents. These differences were up to 360 minutes/ day for average SB and up to 96% for prevalence of excessive SB, depending on the cutoff point analyzed.
The results obtained are due to the significant dif-ferences in the cutoff points analyzed. These discrep-ancies may result from the sedentary activities, partic-ipant characteristics, accelerometer vector and epoch length used in cutoff validation studies to define SB.
The sedentary activities used in cutoff validation and calibration studies show a wide variation in body
Table 1 – Criteria adopted to reduce accelerometer data.
Indicator Criteria
Days considered valid ≥ 10 hours/day
Number of valid days ≥ 3 days/week(≥ 1 day a weekend)
Nonwear time 20 minutes*
60 minutes*
Vertical vector (cutoff points; epoch; accuracy levels)
Evenson et al.18 ≤ 25 counts/15 seconds; S = 95% and SP = 93%
Vanhelst et al.20 ≤ 400 counts/60 seconds; K= 85%
Puyau et al.19 < 800 counts/60 seconds; S = 100% and SP = 61%
Vector magnitude (cutoff points; epoch; accuracy levels)
Hänggi et al.21 < 3 counts/1 second; S = 95% and SP = 87%
Romanzini et al.22 ≤ 180 counts/15 seconds; S= 98% and SP = 94%
*criteria applied separately for each cutoff point; S = sensitivity; SP = specificity.
Table 2 – Descriptive analysis of sociodemographic characteristics, body mass index and accelerometer nonwear time of 10 to 14-year old adolescents from João Pessoa, Paraíba, 2014.
Variables
Accelerometer nonwear time
p* 20 minutes (n = 545) 60 minutes (n = 593) n % n % Sex Male 261 47.9 286 48.2 0.909 Female 284 52.1 307 51.8 Age (years) 0.750 10-11 356 65.3 382 64.4 12-14 189 34.7 211 35.6 Economic class 0.908 A/B 181 37.8 192 36.9 C 279 58.2 310 59.5 D/E 19 4.0 19 3.6 Mother’s schooling 0.980 Incomplete elementary 157 34.7 169 34.3 Complete elementary 138 30.4 149 30.2 Complete secondary or university 158 34.9 175 35.5 School Shift 0.888 Morning 211 38.7 232 39.1 Afternoon 334 61.3 361 60.9 BMI classification 0.828 Normal weight 355 65.9 383 65.2 Overweight 184 34.1 204 34.8
Mean Standard deviation Mean Standard deviation p†
Accelerometer nonwear
time (min/day) 828.91 79.62 860.78 97.77 0.000
BMI = body mass index; p* = Chi-squared test; p† = Independent t-test.
movement, some involving less (lying down, sitting, standing, watching DVDs, playing videogames)18,20,21
and others greater movement (writing, coloring, em-broidering, playing cards, solving puzzles and playing with miniature cars)19,22. Activities withgreater body
movement produce more acceleration and energy ex-penditure, resulting in higher thresholds that define SB. Moreover, the fact that the activities used to validate cutoff points may not be representative of those adoles-cents engaged in, could reduce the ability of thresholds to accurately establish the time spent on all SB , when applied to real life conditions.
Differences in the age range of the students, which served as a reference to validate cutoff points, is another factor that may explain the differences found in SB esti-mates. Puyau et al.19 considered children and adolescents
with a broader age range (6-16 years), while Evenson et al.18 studied 5 to 8-year-old children. The studies of
Vanhelst et al.20, Hänggi et al.21 and Romanzini et al.22
involved similar age ranges (10-16 years old). The SB patterns14 and energy expenditure in these activities23
vary between adolescents of different age ranges. Thus, applying a cutoff point in adolescents with a different age range from that considered in validation may result in different average SB time and prevalence.
Accelerometer vectors may also cause different SB estimates. Cain et al.24 observed that vector
magni-tude is more sensitive to movement, recording more non-zero counts when compared to the vertical vec-tor. With the same sedentary activity protocol, epochs and age range, Romanzini et al.22 found that the
cut-off threshold was four times higher for the magnitude than the vertical vector (189 counts/15 sec-1 and 46
counts/15 sec-1, respectively). In the present study, the
cutoff points for the vector magnitude produced a
dif-ference of four hours in SB time (Romanzini et al.22 vs.
Hänggi et al.21) compared to the vertical vector. These
differences may be partially attributed to the activity protocol used in both calibration studies. Hänggi et al.21 derived cutoff points for SB based on a single
ac-tivity (sitting), while Romanzini et al.22 considered a
larger number of sedentary activities (watching movies, writing/studying, and playing videogames).
The epoch length used for each cutoff point may have influenced the estimates of SB. In general, studies12,13
have demonstrated that for a same cutoff point, shorter epochs produce higher SB values. Although this study did not analyze different epochs, when cutoff points with the same vector, age range and epoch length were used, the differences in estimates were up to 1.6 hours and 10% for SB time and prevalence, respectively. It is important to underscore that these differences were observed in both accelerometer nonwear time criteria, but higher for the 20-minute criterion.
In practice, comparisons of SB estimates, even be-tween cutoff points with similar characteristics such as vector, age range and epoch, must be made carefully, given that small differences were observed. It is also important to underscore that even when these deci-sions are considered, comparing the results with those of other studies that used the same cutoff point must take into account the nonwear criterion, number of hours and valid days of accelerometer use. On the other hand, when these characteristics are discrepant, especially for the vector and epoch, comparisons of SB time and prevalence between studies must be avoided, due to the significant differences.
In the present study, it was possible to identify which cutoff points produced more accurate estimates of SB, in the absence of a gold standard measure.
Table 3 – Comparison of SB time between different cutoff points in 10 to 14-year old students from João Pessoa, Paraíba, 2014.
Variables Vectors
Average SB time (minutes/day)
20-minute nonwear time 60-minute nonwear time
p†
Mean Standard deviation Mean Standard deviation
Evenson et al.18 V 464.04a 94.51 502.41a 108.80 < 0.001 Vanhelst et al.20 V 584.81c 86.04 677.53c 85.78 < 0.001 Puyau et al.19 V 680.95b 85.53 716.52b 103.32 < 0.001 Hänggi et al.21 M 310.51d 88.86 354.58d 106.48 < 0.001 Romanzini et al.22 M 547.37e 94.56 583.93e 109.03 < 0.001 P-value* < 0.001 < 0.001
SB: = sedentary behavior; V = vertical; M = magnitude; *one-way ANOVA for repeated measures (Bonferroni post hoc); a, b, c, d, e = indicate significant differences in average times between cutoff points; † dependent t-test.
However, when selecting a cutoff point, the vector, age range, epoch, accelerometer brand and model used in the calibration studies must be considered, as well as the accuracy of the measure. In addition, cutoff point calibration and validation tests are needed to define SB over a wider adolescent age range and include more sedentary activities. A minimum standard should also be adopted for accelerometer data reduction criteria (nonwear time, hours and days of valid use). This will make it possible to compare and summarize SB meas-ures and their relation with different health outcomes. One limitation of this study is the fact that the cutoff epochs of Evenson et al.18, Hänggi et al.21 and
Roman-zini et al.22 were reintegrated for 60 seconds, given that
the Actilife version used produces SB estimates based on 60-second epochs. This procedure may have underes-timated the average time and prevalence of this behav-ior, because shorter epochs produce longer SB times13.
The following strengths deserve to be mentioned: the use of a representative sample of public school 6th graders; using the accelerometer individually or in
small groups by a trained team, thereby avoiding meas-urement bias; using different cutoff points to define SB, and defining accelerometer nonwear time and vectors.
In conclusion, the cutoff points analyzed produced significant differences in SB estimates, which were more marked for the 20-minute accelerometer nonwear cri-terion. In some cases, comparing SB estimates between studies that used different cutoff points is not feasible, especially in accelerometers calibrated based on differ-ent seddiffer-entary activities, age ranges, epoch lengths and vectors. As such, there is a need to establish a consensus regarding accelerometer data reduction criteria when it is used to measure SB.
Conflict of interests
The authors declare no conflict of interest.
Financing
Funding National Council for Scientific and Technological Deve-lopment – CNPq (Protocols 486306 / 2012-7 and 460887 / 2014-9) and Paraíba State Research Support Foundation – FAPESQPB.
Authors’ contribution
Moura IR, participated in the manuscript conception, data col-lection, analysis and interpretation, and in the writing of the manuscript. Barbosa AO and Prazeres Filho A, participated in the collection, data analysis and writing of the manuscript. Silva ICM and Romanzini M, participated in the critical review of the
manuscript. Farias Junior JC, participated in the writing and cri-tical revision of the manuscript.
Acknowledgment
To the National Council for Scientific and Technological De-velopment – CNPq (Protocols 486306 / 2012-7 and 460887 / 2014-9) and the Paraíba State Research Support Foundation – FAPESQPB for the funding granted for the research. To the State and Municipal Secretariat of Education of the Municipa-lity of João Pessoa – Paraiba, for the authorization to conduct the research, as well as to the principals of the schools and the students who agreed to participate. To the team of the Study and Research Group in Epidemiology of Physical Activity for their contribution to data collection.
References
1. Carson V, Hunter S, Kuzik N, Gray CE, Poitras VJ, Chaput J-P, et al. Systematic review of sedentary behaviour and health indicators in school-aged children and youth: an update. Appl Physiol Nutr Metab. 2016;41(6):S240-S65.
2. Olds TS, Maher CA, Ridley K, Kittel DM. Descriptive epidemiology of screen and non-screen sedentary time in adolescents: a cross sectional study. Int J Behav Nutr Phys Act. 2010;7(1):92.
3. Bauman AE, Petersen CB, Blond K, Rangul V, Hardy LL. The Descriptive Epidemiology of Sedentary Behaviour. In: Epidemiology SB, editor.: Springer International Publishing AG; 2018. p.73-106
4. Lubans DR, Hesketh K, Cliff D, Barnett L, Salmon J, Dollman J, et al. A systematic review of the validity and reliability of sedentary behaviour measures used with children and adolescents. Obes Rev. 2011;12(10):781-99.
5. Verloigne M, Lippevelde WV, Maes L, Yıldırım M, Chinapaw M, Manios Y, et al. Self-reported TV and computer time do not represent accelerometer-derived total sedentary time in 10 to 12-year-olds. Eur J Public Health. 2012;23(1):30-2.
6. Troiano RP, McClain JJ, Brychta RJ, Chen KY. Evolution of accelerometer methods for physical activity research. Br J Sports Med. 2014;0:1-5.
7. Welk G, Morrow J, Sain-Maurice P. Measures Registry User Guide: Individual Physical Activity. In: National Collaborative on Childhood Obesity Research (NCCOR). 2017:1-72.
8. Reilly JJ, Penpraze V, Hislop J, Davies G, Grant S, Paton JY. Objective measurement of physical activity and sedentary behaviour: review with new data. Arch Dis Child. 2008;93:614-9.
9. Sasaki J, Coutinho A, Santos C, Bertuol C, Minatto G, Berria J, et al. Orientações para utilização de acelerômetros no Brasil. Rev Bras Ativ Fís Saúde. 2017;22(2):110-26.
10. Migueles JH, Cadenas-Sanchez C, Ekelund U, Nyström CD, Mora-Gonzalez J, Löf M, et al. Accelerometer data collection and processing criteria to assess physical activity and other outcomes: a systematic review and practical considerations. Sports Med. 2017;47(9):1821-45.
11. Chau JY, Grunseit AC, Chey T, Stamatakis E, Brown WJ, Matthews CE, et al. Daily sitting time and all-cause mortality: a meta-analysis. PLoS One. 2013;8(11):e80000.
Quote this article as:
Moura IR, Barbosa AO, Silva ICM, Romanzini M, Prazeres Filho A, Farias Júnior JC. Impact of cutoff points on adolescent sedentary behavior measured by accelerometer. Rev Bras Fís Saude. 2019;24:e0071. DOI: 10.12820/rbafs.24e0071
12. Ojiambo R, Cuthill R, Budd H, Konstabel K, Casajús JA, González-Agüero A, et al. Impact of methodological decisions on accelerometer outcome variables in young children. Int J Obes. 2011;35:S98-S103.
13. Banda JA, Haydel KF, Davila T, Desai M, Bryson S, Haskell WL, et al. Effects of varying epoch lengths, wear time algorithms, and activity cut-points on estimates of child sedentary behavior and physical activity from accelerometer data. PLoS One. 2016;11(3):e0150534.
14. Janssen X, Mann KD, Basterfield L, Parkinson KN, Pearce MS, Reilly JK, et al. Development of sedentary behavior across childhood and adolescence: longitudinal analysis of the Gateshead Millennium Study. Int J Behav Nutr Phys Act. 2016;13(1):88.
15. Kim Y, Lee J-M, Peters BP, Gaesser GA, Welk GJ. Examination of different accelerometer cut-points for assessing sedentary behaviors in children. PLoS One. 2014;9(4):e90630.
16. ABEP - Associação Brasileira de Empresas de Pesquisa. Critério de classificação econômica Brasil - [database on the Internet] 2014 [cited 2018 out 05]. Available from: http:// www.abep.org
17. World Health Organization. Multicentre Growth Reference Study Group. WHO Child Growth Standards: Length/ height-for-age, for-age, for-length, weight-for-height and body mass index-for-age: Methods and development. Geneva:. World Health Organization; 2006.
18. Evenson KR, Catellier DJ, Gill K, Ondrak KS, McMurray RG. Calibration of two objective measures of physical activity for children. J Sports Sci. 2008;26(14):1557-65.
19. Puyau MR, Adolph AL, Vohra FA, Butte NF. Validation and calibration of physical activity monitors in children. Obes Res. 2002;10(3):150-7.
20. Vanhelst J, Béghin L, Turck D, Gottrand F. New validated thresholds for various intensities of physical activity in adolescents using the Actigraph accelerometer. Int J Rehabil Res. 2011;34(2):175-7.
21. Hänggi JM, Phillips LR, Rowlands AV. Validation of the GT3X ActiGraph in children and comparison with the GT1M ActiGraph. J Sci Med Sport. 2013;16(1):40-4.
22. Romanzini M, Petroski EL, Ohara D, Dourado AC, Reichert FF. Calibration of ActiGraph GT3X, Actical and RT3 accelerometers in adolescents. European journal of sport science. 2014;14(1):91-9.
23. Harrell JS, McMurray RG, Baggett CD, Pennell ML, Pearce PF, Bangdiwala SI. Energy costs of physical activities in children and adolescents. Med Sci Sports Exerc. 2005;37(2):329-36.
24. Cain KL, Bonilla E, Conway TL, Schipperijn J, Geremia CM, Mignano A, et al. Defining accelerometer nonwear time to maximize detection of sedentary time in youth. Pediatr Exerc Sci. 2018;30(2):288-95.
Received: 09/05/2019 Approved: 20/07/2019