Faculdade de Farmácia
Continuous feeding and mixing in continuous
tablet manufacturing: measuring system
responses to parameter and material changes
and implementation of NIR sphere
André João Nascimento Canas
Dissertation to obtain the Master of Science Degree in
Pharmaceutical Engineering
Work supervised by:
Professor João Almeida Lopes (Supervisor)
Professor Ossi Korhonen (Co-Supervisor)
Universidade de Lisboa
Faculdade de Farmácia
Continuous feeding and mixing in continuous
tablet manufacturing: measuring system
responses to parameter and material changes
and implementation of NIR sphere
André João Nascimento Canas
Dissertation to obtain the Master of Science Degree in
Pharmaceutical Engineering
Work supervised by:
Professor João Almeida Lopes (Supervisor)
Professor Ossi Korhonen (Co-Supervisor)
The experimental work was performed in PROMIS continuous tablet
manufacturing line (University of Eastern Finland, School of
Pharmacy, Kuopio, Finland). All the facilities, equipments, materials
and support were gently provided by
Abstract
Continuous manufacturing is an advantageous choice in many industries, including the pharmaceutical. Its main advantages are better controllability, and, for sufficiently large volumes, lower manufacturing costs by decreased footprint and labor. Since the inception of the process analytical technology initiative (PAT), and more recently, the quality-by-design (QbD) initiative, significant efforts in designing new manufacturing strategies for the pharma industry are underway.
Continuous mixing is important in many processes in pharmaceutical manufacturing, including some obvious ones such as API and lubricant mixing, and some less apparent, such as wet granulation, coating, extrusion, and drying, where mixing often plays a critical role.
In this study, NIR spectroscopy is used to further understand a novel continuous mixing process. This new method is used to monitor the concentration of paracetamol blends that range from 30 to 70% (w/w). An experimental design was performed to define a set of runs in order to identify the critical process parameters and evaluate their impact on the critical quality attributes such as the homogeneity of the powder blend produced in the in-line mixer. The in-line mixer used was the Hosokawa Modulomix. The mixing process was monitored by an near infrared spectral camera aided by an integration sphere with an innovative design, attached to the mixer’s outlet port.
The process parameters evaluated and their respective range were: mixer speed (300-1500 rpm), total feed rate (5-15 kg/h), inlet port (A or B) and excipient type (dibasic calcium phosphate or paracetamol). All process variables were kept constant throughout the experiments, and whilst maintaining the total feed rate constant, step changes to the paracetamol concentration were introduced at different time points. These were meant to stimulate the system and allowed for monitoring of system mixing performance with alterning setpoints for a wide range of settings, and for determination of the mixer’s mean residence time.
The NIR spectral camera was able to operate, through the integration sphere’s innovative design, with multi-point signal acquisition for a good representative analysis of the flowing powder. The mixer speed was revealed to be the most important critical process parameter. Mixture performance was determined via the powder blend’s relative standard deviation (RSD), and results revealed that powder homogeneity was very good under all experimental conditions, having the RSD values always remained under 5% RSD.
Key words: Chemometrics; Continuous manufacturing; Continuous
mixing; Near-infrared spectroscopy; Powder blending
Resumo
A produção contínua tem sido frequentemente adotada em muitas indústrias, incluindo a química, alimentar, micro-electrónica, entre outras. As suas principais vantagens são um maior controlo, e para volumes suficientemente grandes, menores custos de fabrico através de menor necessidade em mão de obra e possibilidade de uso de equipamento de menores dimensões. A indústria farmacêutica contudo, devido à natureza rígida da sua estrutura regulamentar, tem permanecido focada em larga medida no método de produção por “lote”.
Não obstante, desde a iniciativa de tecnologia analítica de processo lançada pela Food and Drug Administration, e mais recentemente, da iniciativa Quality-by-design, (que visam não só o desenvolvimento integrado do produto desde a sua conceção até a sua entrada no mercado mas também a otimização de recursos, matérias primas e instalações), que esforços significativos têm sido levados a cabo de forma a desenvolver novas estratégias de produção.
A produção contínua de formas farmacêuticas sólidas de dose individual tem pois, como um dos seus objetivos, melhorar a qualidade do medicamento a partir da origem, reduzindo o seu custo de fabrico, e ao mesmo tempo permitir aos doentes o acesso a medicamentos mais seguros. Para isso, realizam-se delineamentos experimentais para perceber de que forma os parâmetros do processo influenciam as respostas do mesmo. As tecnologias analíticas de processo são ferramentas fundamentais de monitorização porque fornecem dados do produto e do processo em tempo real. Esses dados são utilizados em modelos de análise multivariada que por sua vez devolvem informação sobre o processo. Esses modelos são em grande medida, ferramentas que contribuem para a construção de mecanismos de controlo do próprio processo. Estes mecanismos de controlo garantem que perturbações no processo são corrigidas de forma a obter os atributos críticos de qualidade desejados conforme as especificações.
A produção contínua aplicada à produção farmacêutica secundária é atrativa visto que processos como compressão, compactação por rolos, e enchimento de cápsulas já são efetuados de forma contínua, enquanto que a mistura, granulação por via húmida, secagem e revestimento são efetuados em “lote”. Esta combinação de operações “lote” com operações contínuas torna-se frequentemente uma fonte de ineficiência. Para além disso, os processos contínuos podem ser aumentados em escala simplesmente por
extensão do tempo de operação, ao contrário dos processos tipo “lote”, que invariavelmente requerem um aumento de escala físico que muitas vezes não é fácil de fazer nem eficaz.
A produção contínua possui outras vantagens em relação à produção por “lote”, nomeadamente o tamanho de equipamento reduzido, menor inventário para o processo, menos manuseamento sólido como por exemplo o enchimento e esvaziamento de misturadores (reduzindo assim efeitos potencialmente indesejados como a segregação), um controlo mais preciso em torno de um estado estacionário bem definido, e uma maior uniformidade na aplicação de tensões de corte. Contudo, a produção contínua tem algumas limitações, como o custo inicial mais elevado, dificuldade de implementação para produtos com baixo volume de produção, e flexibilidade reduzida do processo. Apesar da produção contínua ter sido fortemente implementada na indústria química, o conhecimento relativamente à mistura de pós por via de processos contínuos ainda é limitado e relativamente poucos artigos têm sido publicados nesta área.
A mistura é uma operação unitária extremamente importante em muitos processos de produção farmacêutica, incluindo alguns bastante óbvios como a mistura de substâncias ativas e lubrificantes, e alguns menos aparentes, tais como a granulação por via húmida, revestimento, extrusão, e secagem, onde a mistura tem um papel crucial. O desenvolvimento de operações de mistura contínua requer uma avaliação de um amplo espaço paramétrico, que inclui a seleção e conceção dos equipamentos de mistura e alimentação, avaliação dos parâmetros de operação tais como velocidade de rotação das pás do misturador e taxa de alimentação, caracterização dos efeitos de propriedades físicas como distribuição do tamanho de partícula e coesão dos pós, e o controlo de variáveis ambientais tais como a temperatura e humidade relativa. Este grande número de variáveis, e as suas interações entre si, torna extremamente difícil a implementação do processo para uma nova entidade sem estudos detalhados. Tendo tudo isto em conta, a identificação de parâmetros críticos de processo é um passo essencial em direção à implementação da produção contínua.
O processo de mistura em contínuo inicia-se pelo enchimento e calibração dos alimentadores que irão debitar as matérias primas em pó a serem misturadas. Estes alimentadores estão assentes em balanças extremamente sensíveis que pesam continuamente a quantidade de massa de pó existente dentro da tremonha, tendo um
balanças regula assim automaticamente o débito com que os pós são alimentados para o misturador. Com o misturador ligado as partículas de pó ao entrarem no misturador cilíndrico pela porta de alimentação sofrem agitação pelas pás fixas ao rotor que se encontra no eixo central do misturador. Estas pás podem ter várias configurações e orientações e portanto originam diversos tipos de fluxos de matéria dentro do misturador. Ao atingir a porta de descarga do misturador a mistura de pós homogénea é libertada para um recipiente ou para um transportador para a próxima operação unitária.
Este trabalho experimental foi realizado utilizando a linha de produção contínua de comprimidos do PROMIS Centre, na University of Eastern Finland, School of Pharmacy, em Kuopio, na Finlândia. Neste trabalho, recorreu-se a alimentadores gravimétricos (K-Tron K-ML-D5-KT20) de duplo parafuso e a um misturador contínuo (Hosokawa Modulomix). O processo de mistura consistia em homogeneizar uma mistura de pós composta pelo principio ativo (paracetamol) e um excipiente (fosfato de cálcio ou celulose microcristalina). A monitorização do processo foi seguida em tempo real por um sistema de infravermelhos próximos com uma câmara espectral SPECIM e um sensor ImSpector (SPECIM, Finland). Este sistema encontra-se associado a um acessório inovador que permitiu a aquisição de seis sinais simultâneos em locais diferentes da zona de amostragem de forma a melhor representar o fluxo de pó que saia do misturador. Este acessório denominado de “esfera de integração” utiliza seis fibras óticas para recolher informação do fluxo de pó e foi desenhado especialmente para este processo.
A relação entre os possíveis parâmetros de processo e os atributos de qualidade da mistura de pós foi estabelecida através de ensaios definidos de acordo com um delineamento experimental fazendo variar: a velocidade do misturador de 300 rpm a 1500 rpm; a taxa de alimentação total entre 5 kg/h e 15 kg/h; a porta de alimentação (A e B) e dois excipientes (fosfato de cálcio e celulose microcristalina). Considerou-se o desvio padrão relativo entre o teor de paracetamol nas amostras determinado com UV-Vis e o teor de paracetamol calculado a partir dos dados de registo dos alimentadores, como atributo de qualidade.
A análise de componentes principais foi usada como método de análise exploratória dos espetros obtidos assim como para identificar medições atípicas.
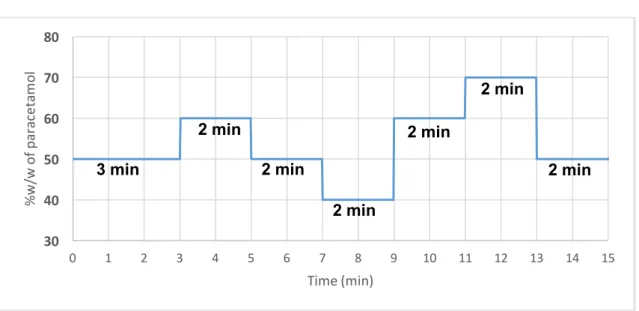
Todas variáveis do processo foram mantidas constantes ao longo das experiências. Apesar da taxa de alimentação total ter sido mantida constante ao longo das experiências, a taxa de alimentação do paracetamol e do excipiente foi variada sob forma de níveis de concentração (40%, 50%, 60% e 70%) . Estas variações tiveram como objetivo estimular o sistema, observar a sua resposta e monitorizar de que forma isso afetava a homogeneidade da mistura resultante nesses instantes.
A câmara espectral de infravermelho próximo operou através da esfera de integração, com aquisição de sinal em múltiplos pontos de forma a obter uma análise representativa do fluxo de pós. Isto permitiu que os modelos de análise de componentes principais identificassem claramente as perturbações aos níveis de concentração das matérias primas causadas no sistema, e detetar o tempo necessário para que o processo atingisse o estado estacionário. Os modelos baseados nos espetros obtidos foram capazes de capturar as concentrações de paracetamol e excipiente ao longo do tempo. Estes resultados foram confirmados através de análise por resolução multivariada de curvas onde foi possível quantificar de forma precisa os teores de substância ativa e excipiente (no caso da celulose microcristalina) impondo os espetros dos compostos puros. Verificou-se também que após cerca de três minutos do inicio das experiências, o sistema atingia o estado estacionário.
O sistema revelou óptimo desempenho de mistura, pois os valores do desvio padrão relativo revelaram ser inferiores a 5% em todas as experiências independentemente das definições do processo. Os modelos de regressão entre os parâmetros do processo e os atributos de qualidade indicaram que a velocidade do misturador era o parâmetro crítico de processo mais relevante.
Palavras-chave: Espetroscopia de infravermelho próximo; Mistura contínua; Produção contínua; Quimiometria; Tecnologia analítica de processo.
Acknowledgements
I would very much like to thank Prof. Ossi Korhonen, for the mentorship, patience and clarity with which he supervised my work. That, along with all his patience and great personality, made the experience of doing my internship abroad much more pleasant and enriching. Also a word of appreciation and thanks to Prof. Jarkko Ketolainen for the opportunity of being able to do my internship at the School of Pharmacy, University of Eastern Finland.
I would like to thank Anssi-Pekka Karttunen for being an excellent colleague and also tutor, for his dedication to our work and for the good mood we were able to share while doing the experimental work. Thanks for all the support.
I am very grateful to Prof. João Almeida Lopes for also allowing me the opportunity to develop my experimental work at University of Eastern Finland. I would also like to thank him for giving me tireless support during the writing of this thesis, and for all I have learned from him, in and out of the classroom.
A very special thanks to Rute Dias, for embarking in this journey with me since the beginning. Thank you for all your friendship and support, this would not have been possible without it.
I would also like to acknowledge my friends Sara Ramos, Pedro Januário, Marisa Lopes, Valter Marques, Eloísa Silva, Joana Valadas and Gonçalo Grazina for the constant support and continuous encouragement throughout this internship.
Last but not the least, I would like to thank my parents and my family for the unconditional support and encouragement throughout my years of study and through the process of researching and writing this thesis.
Contents
Abstract ... i
Resumo ... iii
List of Figures ... ix
List of Tables ... xii
List of Abbreviations ... xiii
Chapter 1 ... 1
Motivation ... 1Chapter 2 ... 2
Objectives ... 2Chapter 3 ... 3
Introduction ... 33.1 Continuous manufacturing ... 5
3.2 Continuous mixing ... 7
3.3 Monitoring of continuous mixing with near-infrared spectroscopy ... 10
3.4 Continuous manufacturing line ... 12
Chapter 4 ... 16
Materials and methods ... 16
4.1 Raw-materials ... 16
4.2 Equipment ... 22
4.3 Methods ... 32
Chapter 5 ... 39
Results and discussion ... 39
5.1 Exploratory data analysis ... 39
5.2 Residence time distribution calculation ... 52
5.3 UV-Vis measurements ... 54
5.4 System variables influence over response parameters ... 62
Chapter 6 ... 66
References ... 69
List of Figures
Figure 1 - Full line configuration schematic (adapted from (25)) ... 12
Figure 2 - "Rat-hole" example ... 13
Figure 3 - Labview control software interface. On the left: monitoring of the
powder mixture. On the right: monitoring of the compaction force ... 14
Figure 4 – Full production line ... 15
Figure 5 - Dibasic calcium phosphate molecular structure ... 16
Figure 6 - Spectrum of EMCOMPRESS in the NIR region encompassing the
region 1000–2500 nm
... 17
Figure 7 - MCC molecular structure
... 18
Figure 8 - Spectrum of EMCOCEL 90M in the NIR region encompassing the
region 1000–2500 nm ... 19
Figure 9 - Molecular structure of paracetamol ... 20
Figure 10 - Spectrum of Paracetamol in the NIR region encompassing the
region or 1000–2500 nm ... 21
Figure 11 - Experimental configuration setup ... 22
Figure 12 - K-Tron LIW powder feeders ... 23
Figure 13 - Gain-in-weight versus loss-in-weight batching schematic (adapted
from (57))
... 24
Figure 14 - Loss-in-weight powder feeder schematic (adapted from (58))
... 25
Figure 15 - Modulomix in-line mixer with inlet ports A and B, and outlet port C . 26
Figure 16 - Modulomix in-line mixer. On the left: With the side panel removed,
exposing the mixing chamber. On the right: Before cleaning with the
external casing removed ... 27
Figure 17 - Example of Modulomix cascade setup (adapted from (59)) ... 28
Figure 18 - Belt conveyor ... 29
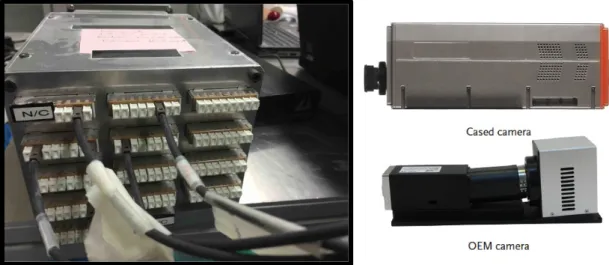
Figure 19 - NIR spectral camera. On the left: fiber receiving and merging
acessory. On the upper right: profile of the cased camera. On the lower
right: profile of the camera with no casing. ... 30
Figure 20 - The integration sphere. ... 31
Figure 21 - Shimadzu UV-1800 spectrophotometer. ... 31
Figure 22 - Paracetamol step changes along the duration of each experimental
run ... 34
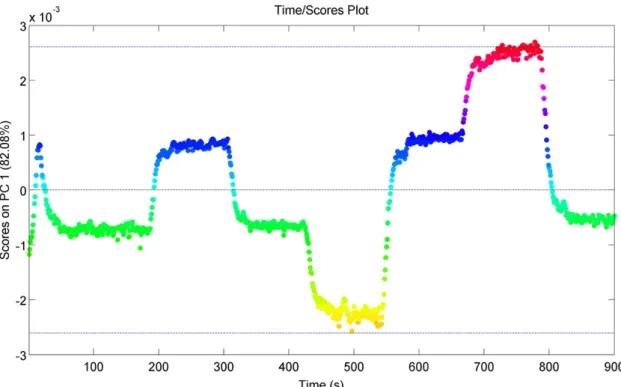
Figure 23 - Raw NIR spectra obtained for run N6 ... 39
Figure 24 - Pre-processed NIR spectra for run N6 ... 40
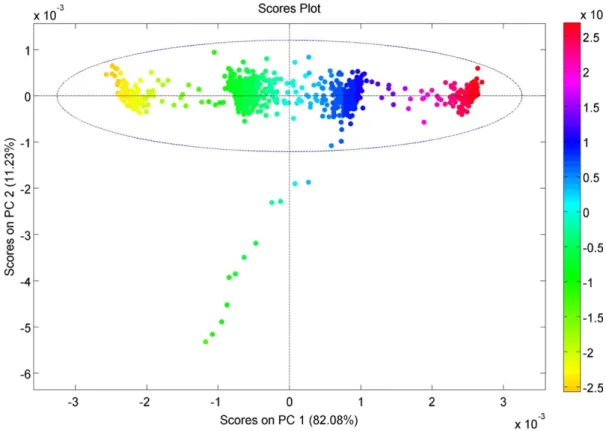
Figure 25 - Score plot for the PCA model obtained from run N6 spectra. ... 41
Figure 26 - Q residuals vs Hotelling T
2from a PCA model from run N6 spectra
... 41
Figure 27 - Evolution of the first PC over time for run N6.
... 42
Figure 28 - Raw and preprocessed (first derivative) NIR spectra of paracetamol.
... 43
Figure 29 - Preprocessed (first derivative) and PCA PC1 loadings NIR spectra
of paracetamol ... 43
Figure 30 - Raw and preprocessed (first derivative) NIR spectra of MCC. ... 44
Figure 31 - Preprocessed (first derivative) and PCA PC2 loadings NIR spectra
of MCC.
... 44
Figure 32 – Preprocessed (first derivative) paracetamol and MCC NIR spectra.
... 45
Figure 33 - Scores (first and second component) obtained from the MCR model
for the eight runs containing MCC. ... 46
Figure 34 - Corrected scores (first and second component) obtained from the
MCR model for the eight runs containing MCC ... 48
Figure 35 - Overlay of the first component profiles obtained for the PCA (blue)
and MCR (orange) models for experiment N6.
... 48
Figure 36 - Overlay of the first component profiles obtained for the PCA (blue)
and MCR (orange) models for experiment N12. ... 49
Figure 37 - Overlay of the first component profiles obtained for the PCA (blue)
and MCR (orange) models for experiment N13. ... 49
Figure 38 - Overlay of the first component profiles obtained for the PCA (blue)
and MCR (orange) models for experiment N14. ... 50
Figure 39 - DCP and paracetamol raw NIR spectra encompassing the region
1000–2500 nm ... 51
Figure 40 - Weibull Sigmoid function fitting for the 50% to 60% step change for
experiment N6. ... 52
Figure 41 – Function E(t) representing the residence time distribution for
experiment N6
... 53
Figure 42 - UV-Vis Calibration Curve
... 55
Figure 43 – Overlay of paracetamol feeder setpoint, real fed paracetamol
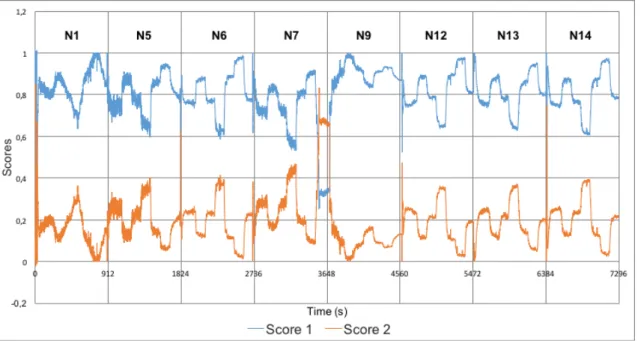
concentration and UV-Vis measured results for experiment N1 ... 56
Figure 44 - Overlay of paracetamol feeder setpoint, real fed paracetamol
concentration and UV-Vis measured results for experiment N2 ... 56
Figure 45 - Overlay of paracetamol feeder setpoint, real fed paracetamol
concentration and UV-Vis measured results for experiment N3 ... 56
Figure 46 - Overlay of paracetamol feeder setpoint, real fed paracetamol
concentration and UV-Vis measured results for experiment N4 ... 57
Figure 47 - Overlay of paracetamol feeder setpoint, real fed paracetamol
concentration and UV-Vis measured results for experiment N5 ... 57
Figure 48 - Overlay of paracetamol feeder setpoint, real fed paracetamol
concentration and UV-Vis measured results for experiment N6 ... 57
Figure 49 - Overlay of paracetamol feeder setpoint, real fed paracetamol
concentration and UV-Vis measured results for experiment N7 ... 58
Figure 50 - Overlay of paracetamol feeder setpoint, real fed paracetamol
concentration and UV-Vis measured results for experiment N8 ... 58
Figure 51 - Overlay of paracetamol feeder setpoint, real fed paracetamol
concentration and UV-Vis measured results for experiment N9 ... 58
Figure 52 - Overlay of paracetamol feeder setpoint, real fed paracetamol
concentration and UV-Vis measured results for experiment N10 ... 59
Figure 53 - Overlay of paracetamol feeder setpoint, real fed paracetamol
Figure 54 - Overlay of paracetamol feeder setpoint, real fed paracetamol
concentration and UV-Vis measured results for experiment N12 ... 59
Figure 55 - Overlay of paracetamol feeder setpoint, real fed paracetamol
concentration and UV-Vis measured results for experiment N13
... 60
Figure 56 - Overlay of paracetamol feeder setpoint, real fed paracetamol
concentration and UV-Vis measured results for experiment N14 ... 60
Figure 57 - RSD acording to experiment number and concentration step ... 61
Figure 58 - Regression coefficients for the bulk residence time model developed
including error bars for assessing coefficients significance. ... 63
Figure 59 - Regression coefficients for the mass hold at the end of the run
model developed including error bars for assessing coefficients
significance. ... 63
Figure 60 - Regression coefficients for the mass hold at 180s model developed
including error bars for assessing coefficients significance. ... 64
Figure 61 - Regression coefficients for the relative standard deviation
developed model including error bars for assessing coefficients
List of Tables
Table 1 - Complete continuous line equipment description ... 14
Table 2 - Experimental design used to define the runs' conditions according to
four process parameters.
... 32
Table 3 - LIW feeders step changes
... 33
Table 4 - Mass hold and residence time for the produced experiments.
... 53
Table 5 - UV-Vis calibration curve measurement results
... 54
Table 6 - Relative standard deviation between UV-Vis results and feeder
registry data. ... 61
Table 7 – Data introduced into the Modde worksheet to build the PLS models.
The imput variables were: feed rate, mixer speed, port and excipient; and
the responses were: bulk residence time, mass hold at the end of run,
mass hold at 180s and RSD. ... 62
List of Abbreviations
API, Active Pharmaceutical Ingredient
BRT, Bulk Residence Time
CM, Continuous Manufacturing
CMP,
Critical Material PropertiesCPP, Critical Process Parameters
CQA, Critical Quality Attributes
DoE, Design of Experiment
FDA, Food and Drug Administration
NIR, Near-Infrared
NIRS, Near-Infrared Spectroscopy
PC 1, Principal Component 1
PC 2, Principal Component 2
PCA, Principal Component Analysis
PAT, Process Analytical Technology
PLS, Partial Least Square
PSD, Particle Size Distribution
QbD, Quality by Design
RSD, Relative Standard Deviation
RTD, Residence Time Distribution
Sav-Gol, Savitzky-Golay
Chapter 1
Motivation
The ongoing paradigm shift in the pharmaceutical industry with the introduction of new legislation and guidelines supporting continuous manufacturing, represents a huge opportunity for process optimization, lower manufacturing costs, and higher quality products.
The push for continuous manufacturing
has focused on solid dosage forms. A continuous manufacturing line built to produce tablets with real time release has been one of the most sought after objectives. Mixing, being the first unit operation of a continuous tableting line, is involved in the production of several pharmaceutical dosage forms (e.g., tablets, granules, powders), and represents a critical operation to the process.
The CM approach for the manufacturing of drug products lays on top of the quality-by-design (QbD) principles, which demand the implementation of process understanding methodologies and require full adoption of process analytical technologies (PAT). In this context, the widely adopted near-infrared spectroscopy method, as a PAT tool, enables real-time monitoring of the process, feeding process models with frequent and high quality data.
Statistical models can be adjusted to deal with these data to monitor and to estimate in real-time drug product properties. Thus, this work aims at providing knowledge on powder blending as a continuous process, to support its future implementation in the pharmaceutical industry.
The experimental work was performed in the research and development continuous tableting line (PROMIS-line), constructed at the School of Pharmacy of the University of Eastern Finland.
Chapter 2
Objectives
This written thesis is the result of the experimental work performed in the PROMIS-line (School of Pharmacy of the University of Eastern Finland).
The main objectives of this work are
to gain knowledge on how to operate the feeding and blending equipment part of the continuous production line, and to study and monitor the following mixing process parameters:- Total feed rate (ranging from 5 kg/h to 15 kg/h). - Composition/formulation ratio
- Mixer speed
- Mixing residence time
Capture real-time near-infrared spectra of the output blend in order to:
-
implement a process analytical method to monitor in real-time the quality of the
blend after the continuous in-line mixer;
- better understand the design and technical characteristics of a newly developed near infrared probe including an integration sphere and several monitoring ports: - assess blend homogeneity from a spectral time series.
Chapter 3
Introduction
Pharmaceutical companies, during their product development process, undergo long and expensive research efforts with the objective of optimizing and understanding the production of homogeneous powder blends. These solid mixtures, comprised of several substances including active pharmaceutical ingredients (API) and excipients (like lubricants and diluents), constitute the base material for several pharmaceutical unitary operations and pharmaceutical forms. Minimizing variability in solid mixtures is essencial to the pharmaceutical industry, because mixture uniformity has direct impact on the performance and quality of the product. Bearing that in mind, it becomes clear that when significant divergence from the desired mixing performance happens, it generally leads to batch rejection, triggers costly process investigations, and corrective actions are often required to maintain regulatory compliance (1).
Although some strides and efforts have been made in the field recently, powder flow and powder mixing are processes that are far from being well understood. It is not uncommon for powder mixing processes to be designed ad-hoc, with little experimental data available to support them. The need to further understand blending processes has thus become a priority for regulatory bodies in the last 15 years, and rightfully remains the central focus point of quality-by-design (QbD) and process analytical technology (PAT) efforts.
Over the last decade, the International Conference on Harmonization (ICH) and the Food and Drug Administration (FDA) have issued a series of guidelines for drug manufacturing. In the ICH Guidelines Q7, Q8, Q9, Q10 and Q11 and FDA Guidance for Industry — PAT in which the FDA has published their current thinking on using QbD methods to identify critical quality attributes (CQA), and state the need for a systematic approach to process development through the implementation of engineering modeling and optimization techniques.(2)(3)(4) This will allow the manufacturing of safe and effective products with their quality built into the process.(5) This philosophy of QbD has been applied in other industries to reliably create products with the desired quality attributes. Quality is assured through the development of reliable and robust processes, designed based on the knowledge of process principles.(4) The transition from batch to continuous pharmaceutical operations can facilitate the development of processes within the QbD framework. Continuous processing allows real-time control, lesser need for scale-up studies and can help to reduce product variability.(6)
The pharmaceutical regulatory environment has recognized that in CM processes the major challenges are the coordination of equipment input/output properties, and the formulation of predictive process control strategies. In order to achieve equipment coordination and predictive capabilities, the relationships between critical quality attributes (CQA), critical material properties (CMP) and critical process parameters (CPP) need to be correlated sequentially between the multiple unit operations in product manufacturing, through the use of mathematical models characterizing individual unit operation performance as a function of CPPs (e.g., screw speed, residence time) and CMPs (e.g., particle size distribution).(4) In addition, multi-unit processes can be characterized with respect to the temporal-space location of particles in the system.(7)
These guidelines are intended to motivate manufacturers to enhance their processes for better quality, apply CM to drugs and to gain a deeper insight in pharmaceutical manufacturing processes, replacing empirical approaches by knowledge-based procedures.
The objective of “building in quality” requires a very fine comprehension of the key parameters of a process, and in order to avoid having to “test into the final product” it is vital to understand their impact on the product quality. With this in mind, PAT needs to be understood in a much broader sense: in addition to the implementation of sensors for real-time measurement of CPP, understanding of the process based on mathematical models is essential to guarantee and control product quality.(3) PAT requires, based on mechanistic process understanding, the:
(1) identification of the key parameters;
(2) continuous and real-time measurement of the selected parameters and (3) development of a control strategy based on the relevant multivariate real-time measurements
Before developing process control models, it is also important to consider environmental data and information regarding raw materials. For powder-blending processes the ultimate goal is to obtain a uniform blend with a blend quality close to optimal (in typical applications the relative standard deviation (RSD) should be below 5%). Today, powder homogeneity is obtained through predetermined and established processes, i.e., a constant fill level and a fixed mixing time. This approach, remains as the standard in current pharmaceutical manufacturing, and does not compensate for variability of the raw material's specifications such as particle size or crystallinity, which may significantly
affect segregation behavior and mixture quality, or the environmental conditions, such as temperature and moisture. Of even greater importance is the fact that since blender performance and mixing kinetics are unpredictable when switching between diferent mixer types, it becomes impossible to scale-up in a reliable way. This has led to a growing interest and study of this field by the scientific community in recent years, with the goal of exploring and comprehending the fine details of particle and powder mixing, using both experimental (8)(9) and computational approaches.(10–15)
Interestingly, continuous processing has been utilized extensively by petrochemical, food, and chemical manufacturing but has yet to reach the pharmaceutical industry to a meaningful extent. Recent research efforts indicate that a well controlled continuous mixing process illustrates the capability of scale-up and ability to integrate on-line control ultimately enhancing productivity significantly.(16,17)
The FDA's PAT initiative has encouraged the development of new technology to improve upon the current manufacturing paradigm.(3) As a result, substantial attention has recently focused on continuous processing due to the ability to control disturbances online, avoiding the loss of processing materials and enabling effective process scale-up.
3.1 Continuous manufacturing
Continuous processing has numerous known advantages, over the past few years, CM of solid dose pharmaceutical products has been an area of high interest. CM can be defined as a process where starting materials are manufactured into the final product as a constant flow with an integrated set of equipment, and equipment is controlled to produce required product quality. The scale of continuous production is defined by time rather than dimension of equipment as in batch production.(18) Some pharmaceutical equipments operate inherently continuously, like tableting machines and roller compactors. Others, such as wet granulators and coaters, have to be modified for continuous production. A typical continuous process for pharmaceutical manufacturing consists of unit operations such as powder feeding, blending, granulation, compaction and capsule filling. Powder transfer between unit operations can be performed with the aid of gravity or conveyers. In vertical configuration, pieces of equipment are placed on top of each other and powder is transferred between unit operations by gravity. This configuration requires a footprint of only a few square meters, but the height of the room
normal room height but conveyers (pneumatic or screw) are required to transfer powder between unit operations. Feeding and blending are among the most critical parts in the manufacturing process, affecting directly the homogeneity of the powder mixture and thus the uniformity of the end product. For this reason, feeding accuracy and monitoring as well as ensuring proper blender settings are essential.(17)(19–23)
In a continuous process, monitoring and ensuring blend uniformity in real time at the blender discharge point is critical. Unlike batch manufacturing, it is difficult to rework a blend in a CM scenario. Nevertheless it has numerous known advantages, including reduced cost, increased capacity, facilitated scale up, mitigated segregation, and more easily applied and controlled shear.(24) To set up continuous line into operation, the primary task is to synchronize the yield of each piece of equipment in regard to mass balance. If the line is not balanced adequately, material can start accumulating at a point of operation, or a unit of operation can run out of material if it functions at a faster rate than the previous unit. Thus, reliable mass flowmeters are of great importance. Process monitoring and process controls are integral parts of CM.(25) Another important aspect is the understanding of process disturbances and how they are dampened or accumulated in subsequent unit operations. A key parameter for that is the residence time distribution (RTD) of each piece of equipment.
The residence time is a critical equipment and process parameter that characterizes the period of time a particle stays in one or more unit operations in a continuous system. The RTD is defined as the probability of particles exiting the equipment at a given time period based on the flow patterns inside of the unit.(26) Mathematical models for the RTD have previously been developed for chemical engineering applications in order to characterize the influence of operating conditions, material properties and unit geometry on the degree of non-ideal behavior (i.e., back-mixing). Pharmaceutical unit operations for which the RTD has been experimentally studied include feeding, blending, and granulation processes.(27) RTD can be used to characterize the propagation of transient disturbances across sequential unit operations in flowsheet simulations. The RTD can provide traceability along the continuous line and delineate continuous products based on the feed strategy. Manufactured products created using different batches of starting material can be traced in order to comply with process validation. This will facilitate the prediction and rejection of out-of-spec products by tracing disturbances along the process. Overall, RTD models can add significant value to the transition from batch to continuous operations by providing reliable predictive tool for behavior of unit operations based on their residence time.(27)
In manufacturing processes involving large capacities, continuous processing is considered a viable choice although the pharmaceutical industry has so far relied on batch manufacturing. CM offers several advantages over batch manufacturing as: smaller footprint of manufacturing sites, no or limited scale-up, better process understanding with PAT, higher quality of products with the aid of PAT and faster production to market time.(28) The biggest gain for the pharmaceutical industry is that while batch processes are dependent on time and do not scale-up well, continuous processes only need an extension of time to scale up, and the same equipment can be used for the production of phases I–III clinical products (short runs) and final production (continuous run) (29). This eliminates problems related to site and equipment change. A second advantage is the reduction of waste as optimized continuous processes can operate in a much more efficient way than batch and are easy to control. When looking at CM with an integral perspective we see that these advantages ultimately decrease production costs and increase the quality of pharmaceutical products.(30) The advantages of CM cannot be realized without overcoming several challenges prior to its adoption in the pharmaceutical industry.(29) And continuous mixing is one of the most important.
3.2 Continuous mixing
Among emerging technologies for improving the performance of blending operations, continuous mixing (as continuous processing in general) currently commands enormous interest at pharmaceutical companies. However, development of a continuous powder blending process requires venturing into a process that has a large and unfamiliar parametric space. While continuous blending processes have been used in other industries, in general such applications operate at much larger flow rates and have less demanding homogeneity requirements than typical pharmaceutical applications.(31) Powder mixing is widely used in pharmaceutical, cosmetic, chemical, cement, food, agricultural, and other industries in which product mixtures need to satisfy typical performance criteria. It is a process in which two or more than two solid substances are intermingled in a mixer by continuous movement of the particles. Mainly, the object of mixing operation is to produce a bulk mixture which when divided into different doses, every unit of dose must contain the correct proportion of each ingredient. The degree of mixing will increase with the length of time for which mixing is done.(31) The pharmaceutical industry, mainly produces tablets, capsules or packets that are usually mixtures of 5 to 15 ingredients, and which may contain several API. Standards have
been developed to estimate the quality of the mixtures with respect to each of the actives and thus authorise the release of the products on the market.
The process is complex as it depends on many factors operating at various scales: single particle properties, bulk particle properties, general mixer design and operation, combination of operating conditions, mixture formulation, etc. In batch mixture operation, all ingredients are loaded into the mixer together or in a pre-defined sequence, and mixed until a homogenous material is produced and discharged from the mixer in a single lot. The output of a batch mixer is measured in kg/batch. The continuous mixer on the other hand is generally dedicated to a single high volume product. Ingredients are continuously charged into the mixer in accordance with the formulation. The mixing takes place as the material travels from the charging port to the discharge nozzle, from where it is continuously discharged. The output of a continuous mixer is measured in kg/h.
Experimental work in continuous mixing published so far has focused on operating conditions such as rotation rate, mixer inclination angle, and flow rate.(21) While several types of continuous mixers have been built, and many more can easily be conceived, only a few geometric designs have been examined in the literature.(32) However, many more conditions remain to be examined, and for many interesting designs, performance has never been quantitatively examined in the literature.
Studies have been mainly focused on the influence of operating conditions (feed rate, impeller speed, etc.) and geometric designs (mixer size, impeller types, etc.) on the efficiency and throughput of mixers.(19) The performance of several continuous mixers has been investigated for materials with different flow properties.(33) The effects of different types of stirrer on the hold-up and quality of mixtures have been examined.(34) The quality of a mixture, which may be the degree of homogeneity of loose material at the outlet of a mixer, is important for end-user properties as perceived by customers or for in-process properties used by manufacturers for normative procedures. In addition, mixing process optimisation is a matter of reducing mixing time and savingl energy, especially for low added-value products.
Chemical and process engineers working with powders are currently faced with problems associated with mixture quality. There is a need to overcome such difficult barriers as sampling, use more or less advanced statistical analysis, cope with different standards and practices, but also understand a wide range of available technologies. Most of the time, when considering the insertion of a new mixer in an existing process, costly pilot or full scale tests need to be performed. As a consequence, the general tendency in the industry is to avoid any change, and to concentrate on the way to validate the actual process. This is illustrated by a certain elasticity in sampling recommendations and practices.(35,36)
In the pharmaceutical industry, the above general picture is magnified. This is especially due to traceability needs and quality insurance that requires step-by-step validation, unit operation by unit operation. It also means that a single change in a single operation requires resetting the validation of the following steps, and sometimes of the previous ones. Furthermore, since reprocessing is generally not allowed in such processes, if a mixture is found to be inhomogeneous, the whole related production must be destroyed. Even if there is clearly no problem of product contamination by an external source, it is not permitted to mix the powders again. That of course increases the prices of products and indirectly induces a social cost.
Basic advantages of continuous mixers with respect to batch mixers are currently: Lower size of the mixing vessel for a same production level; less segregation risk due to the absence of handling operations, such as filling and emptying; lower running costs; better definition of mixture homogeneity, at the outlet of the apparatus.
In the pharmaceutical context, it is even possible to add and emphasize:
• The possibility to include an on-line analysis set-up at the outlet of the mixer to measure the quality of the mixtures, but also to implement process control. This point is exactly in the direct line of the PAT recommendations.
• The fact that practically all the final steps, such as tabletting and conditioning, in a drug fabrication scheme are already continuous operations.
• The elimination of scale-up problems during process development.
This last point is undoubtedly a very serious advantage for continuous mixers enhanced by the PAT initiative from the FDA. The qualification of a full-scale pharmaceutical “batch” during process development is actually done at a scale of one-tenth of the industrial scale. This means that if one wants to produce 100 kg at industrial scale in a batch mixer, the validation can be done with a mixer containing 10 kg of mixture. This is a serious problem as there is no guarantee that what has been proved with a 100L mixer will still hold good for a 1m3 batch vessel. In contrast, continuous mixer qualification, will simply
require a full-scale validation of, for example, 1h if the industrial production time of a certain product is 10h. The risk of error is undoubtedly much easier to estimate for a continuous process rather than for a batch process that has to “cross the scales”.
3.3 Monitoring of continuous mixing with
near-infrared spectroscopy
Different spectroscopic methods, mostly NIR and Raman, are among the PAT [ methods recently introduced by the FDA for process monitoring and building predictive understanding of pharmaceutical manufacturing processes.(3)(37–41) Examples of PAT applied to powder blending processes are abundant in literature. They typically include NIR spectroscopy, Raman spectroscopy and laser induced fluorescence (LIF).(39,40,42) Also laser diffraction, image analysis and machine vision are used.(43) Preferably all of these PAT tools run in-line. NIR spectroscopy is currently one of the principal analytical techniques for monitoring pharmaceutical processes.(44)
The NIR spectral region extends from 780 to 2500nm, and NIR spectra consist of absorbance bands corresponding to overtone and combination of fundamental C–H, N–H, S–H and O–H molecular vibrations. NIR methods have been developed to monitor a number of pharmaceutical unit operations including granulation, drying and crystallization.(45–47) Both chemical and physical information are obtained from NIR spectra after properly processing following an adequate method of analysis. For process control, the first principle model-based controls are the most obvious choices, but also gray or black-box models are used due to the lack of first principle models. Continuous monitoring of blend uniformity is the first step towards implementing process control for continuous blending operations, or to facilitate rejection of out-of-specification powder from the manufacturing stream.
NIR spectroscopy has been applied extensively to batch pharmaceutical blending processes to identify the time at which a mixture is homogeneous and stopping the process. Most of the PAT work for blend uniformity monitoring exists for batch blending, which includes commonly used blenders such as the V-blender, the bin blender, the Y-mixer and the Nauta Y-mixer.(41,48–50) Methods reported in the literature to monitor blend uniformity are mostly generic, and include quantitative methods such as a partial least squares (PLS) modeling, or qualitative methods such as principal component analysis (PCA) of the spectra acquired during the blending process, monitoring the pooled standard deviation between spectra, and monitoring the dissimilarity between the process spectra and spectrum of a uniform mixture or individual components. PAT for blending has been reported primarily as a tool for monitoring evolution of RSD during the blending process and for detecting blending end-point. The final blend uniformity measured using PAT methods and the blend uniformity measured using an off-line method are often not related, and the methods to link off-line and on-line blend uniformity measurements are not well established in literature. In order to directly relate the off-line
and on-line measurements, it is necessary to quantify the sample size being analyzed in the in-line measurements and relate that with the offline measurements. In the continuous blending process, powder is typically in a state of motion and, inherently, there is a certain degree of spectral averaging involved in the measurement. Blend uniformity, quantified by the relative standard deviation (RSD) between the in-line measurements, is dependent on the degree of averaging.
3.4 Continuous manufacturing line
The work presented in this thesis was performed at the University of Eastern Finland, School of Pharmacy’s PROMIS-line. It used a continuous tableting line that is modular and can produce tablets via dry granulation or direct compression (Figure 1).
Figure 1 - Full line configuration schematic (adapted from (25))
Being a standard continuous tableting line, the PROMIS-line comprises a set of unit operations and equipment (Table 1) such as loss-in-weight or loss-in-volume feeders that weight and feed the powder substances (API and excipients) into the mixer. These feeders run at specific feed rates that are determined by the formulation specifications, and provide real time data via a computer regarding both the feed rate and the total mass still held inside the hopper. A few difficulties are observed at this stage when working with low feed rates and with cohesive materials. These type of conditions may frequently generate “rat-holes” (Figure 2) that occur when, due to the cohesive nature of the material a “dome” of air is created inside the hopper above the feeding screws, stopping the flow of powder at the feeder exit, affecting the overall performance of the line and limiting its throughput. Inserting a metal rod into the powder in the hopper normally caused the colapse of the “rat-hole”.
Figure 2 - "Rat-hole" example
Next the formulation components are blended inside the mixer resulting in a homogenous powder blend. These mixers are typically tubular blenders, consisting of a horizontal cylinder with a bladed shaft which rotates around a central axis. Powder is fed throught the entrance port at one end of the mixer, and exits through another port on the other end. The impeler that rotates along the axis of the continuous mixer has the double purpose of both blending and transporting the material, thus an optimal amount of radial and axial movement of particles in the blender is required in order to achieve ideal mixing.
If the desired manufacturing process for tableting is direct compression, then the powder blend is directly fed to the tableting machine. If granulation is necessary prior to the tableting it can be preformed via wet or dry granulation which can both be achieved continuously through modern equipment and roller compaction respectively. Of all the equipment in the line, the tableting machine holds the bottleneck being the equipment with the lowest throughput.
Table 1 - Complete continuous line equipment description
Equipment
Brand and manufacturer Specifications
(in continuous operation mode)3 Loss-In-Weight powder
feeders
K-Tron, K-ML-D5-KT20
500 g/h - 24 kg/h
Loss-In-Weight granule
feeder
K-Tron, K-CL-24-KT24
300 g/h - 40 kg/h
Loss-In-Weight micro
feeder
K-Tron, K-CL-SFS-MT12
32 g/h - 300 g/h
Two continuous blenders
Hosokawa, Modulomix
300 - 1450 rpm
Roller compactor
Hosokawa, Pharmapaktor
L200/30P, with flake
crusher FC 200
Screw speed: 0 - 53 rpm; Roll speed:
0 - 19 rpm; Roll pressure: 0 - 50 kN;
Flake crusher: 32 - 313 rpm
Tableting machine
PTK, PT-100 with PISCon
96 000 tablets/h
Screw conveyer
Entecon Spiral Screw
Constant speed
Vacuum conveyer
K-Tron, P10-BV-100-VE
Constant speed
Vacuum conveyer
Volkmann, VS200 Eco
Constant speed
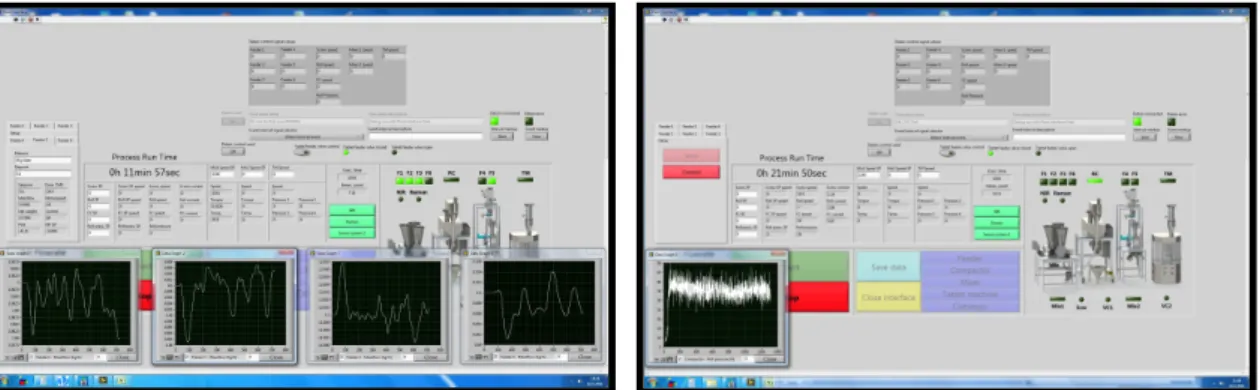
Transfer of powder between unit operations is done either with the aid of gravity or with screw conveyers, depending on the configuration or setup of the equipment. Throughout the continuous process, feeding and mixing are the most important steps, because of their direct impact on homogeneity of the powder mixture and consequently on the final product’s uniformity. It is therefore essential to guarantee precise feeding and mixing, as well as real-time monitoring of the equipment. By integrating all the equipment used in the continuous line (except the tablet press) with a control software (built on top of Labview (National Instruments Corporation, Austin, TX)) (
Figure 3
), it is possible to not only monitor and control in real-time, but to collect and store information onto a data server. That data can also be graphically represented in real time.Figure 3 - Labview control software interface. On the left: monitoring of the powder mixture. On the right: monitoring of the compaction force
Figure 4 – Full production line
Chapter 4
Materials and methods
4.1 Raw-materials
Dibasic calcium phosphate
Figure 5 - Dibasic calcium phosphate molecular structure
Dibasic calcium phosphate dihydrate (DCP) (Figure 5) is a white, odorless, tasteless,
free-flowing powder or crystalline solid. It occurs as monoclinic crystals and is used in the production of tablets and capsules as an inorganic binder and also as a flowing agent
in high speed tablet production.(51) Good material flow is crucial for the manufacturing process and helps ensure the final product will have a consistent composition. DCP is directly compressible and the pharmaceutical industry uses it in two main mesh sizes.
The milled material is typically used in wet-granulation, roller-compaction or slugged formulations. The ‘unmilled’ or coarse-grade material is typically used in direct-compression formulations. The coarser grades flow well and have excellent compressibility.
It works synergistically with microcrystalline celulose (MCC) and other excipients that exhibit plastic deformation to improve powder flow and increase compaction, leading to more robust tablets and less loss in production and packaging. Additionally, because DCP is composed of calcium and phosphorous, it offers nutritional benefits to dietary supplements, being also used in breakfast cereals, flour and animal feed. It is one of the more widely used materials, particularly in the nutritional/health food sectors.
Phosphorus or phosphate cannot be detected directly with near-infrared spectroscopy (NIRS) because of the low di-pole moment between P and O. However, P can be quantified via NIRS if it is bound organically or is tightly associated with other soil properties.(52) Therefore, it is not surprising that only few NIRS models are available to
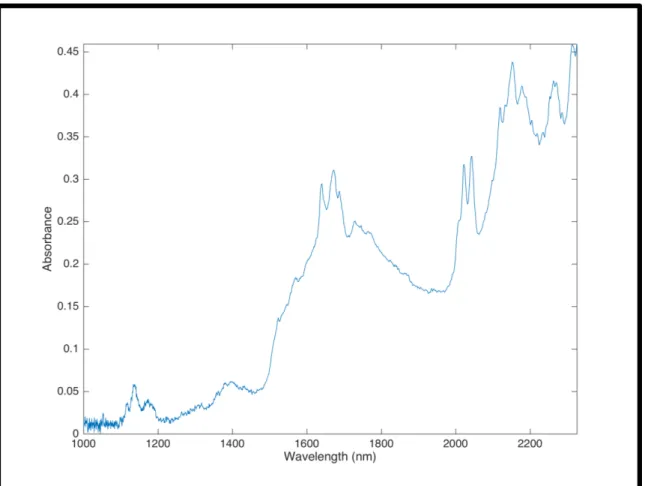
predict concentrations of phosphate or different phosphorus fractions in soil.(53–55) The selected DCP for the experimental work was EMCOMPRESSÒ produced by JRS Pharma, (Rosenberg, Germany). This DCP is a coarse-grade material suitable for direct compression and high speed tableting with an advertised average particle size of 190µm. A particle size D50 of 124µm was experimentally determined by laser diffraction, bulk density was measured at 0.74 g/mL, and the angle of repose was determined to be 44º with a Hosokawa Micron Powder Tester model PT-X.
Microcrystalline celullose
Cellulose is the most abundant natural polymer on earth with an annual biomass production of 50 billion tons. Microcrystalline cellulose (MCC) (Figure 7) is a purified, odorless, tasteless, partially depolymerized cellulose that occurs as a white, crystalline powder composed of porous particles.(51) The most common source of pharmaceutical MCC is wood, in which cellulose chains are packed in layers held together by a cross-linking polymer (lignin) and strong hydrogen bonds.
MCC was discovered in 1955 by Battista and Smith and was first commercialized under the brand name Avicel1 (FMC, 2013). In 1964 FMC Corporation introduced Avicel1 PH to the pharmaceutical industry as an ingredient for direct compression tableting. MCC was first registered in the supplement to the British National Formulary, twelfth edition, in 1966 and more than 60 years later, MCC is manufactured globally by more than 10 suppliers with several comercial brands (Avicel PH; Emcocel; Tabulose; Vivapur; etc).
It is commercially available in different particle sizes and moisture grades that have diferent properties and applications.
MCC is widely used in pharmaceuticals, primarily as a binder and diluent in oral tablet and capsule formulations where it is used between 20% and 90% of the final formulation in both wet-granulation and direct-compression processes.(51) It is physiologicaly inert, non toxic, flows relatively well and is produced virtually free of organic or inorganic contaminants. In addition to its use as a binder/diluent MCC also has some lubricant (8) and disintegrant properties when used between 5% and 15% of the final formulation, that make it useful in tableting, and offers other advantages including broad compatibility with APIs, ease of handling, and security of supply. MCC is also used in cosmetics and food products.
Figure 7 - MCC molecular structure
that results from the hydrolysis of vegetable celulose with dilute mineral acid solutions. Most commercial grades are formed by varying and controlling the spray drying conditions in order to manipulate the degree of agglomeration (particle size distribution) and moisture content (loss on drying). MCC is generally considered as the diluent having the best binding properties and is recognized as one of the preferred DC binders.
The selected MCC for the experimental work was EMCOCEL 90MÒ produced by JRS Pharma, (Rosenberg, Germany). This MCC is a medium size standard grade, suited for the majority of directly compressible actives, and combines good flow and high compactibility. According to the manufacturer’s specifications EMCOCEL 90M has a particle size distribution between 90 and 150 µm, a particle size D50 of 130µm, moisture content below 6%, bulk density between 0.25 and 0.37 g/cm3, and a Carr Index of 21. A particle size D50 of 124µm was experimentally determined by laser diffraction, bulk density was measured at 0.36 g/mL, and the angle of repose was determined to be 43º with a Hosokawa Micron Powder Tester model PT-X.
Paracetamol
Paracetamol (common international denomination) (Figure 9) also called acetaminophen, was synthesized by Morse in 1878, and appears as an odorless, slightly bitter white crystalline powder. Paracetamol is a nonprescription analgesic and antipyretic drug, but it is not an NSAID (Nonsteroidal Anti-inflammatory Drug) as it doesn't participate in the inflammatory response. The analgesic and antipyretic properties of paracetamol were first discovered in the late nineteenth century and clinically used by Von Mering in 1887. Two molecules were already in use for the treatment of mild to moderate pain, acetanilide and phenacetin, but studies later conducted by Brodie and Axelrod in 1948 established that paracetamol was the major metabolite of both these molecules and that resulted in the rediscovery of paracetamol as substitute analgesic for phenacetin due to its nephrotoxicity. Phenacetin disappeared from the market as paracetamol's popularity grew, and since then it has become one of the most popular and widely used drugs in the world for pain and fever treatment, and probably the most prescribed drug for children.(56)
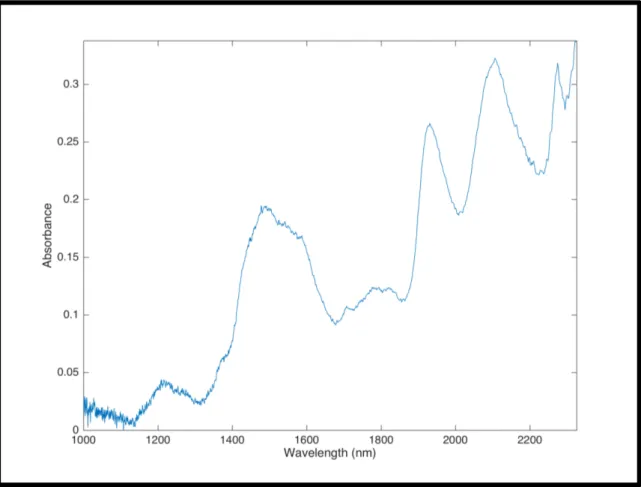
The paracetamol used for the experimental work was purchased from Xiamen Forever Green Source Biochem Tech. Co., Ltd (Xiamen, China). A particle size D50 of 87µm was experimentally determined by laser diffraction, bulk density was measured at 0,35 g/mL, and the angle of repose was determined to be 58º with a Hosokawa Micron Powder Tester model PT-X. For UV-Vis quantification paracetamol’s characteristic 242nm absorbance peak was considered.
Figure 10 - Spectrum of Paracetamol in the NIR region encompassing the region or 1000–2500 nm
The raw materials were characterized according to the physical properties described in the and. Paracetamol has the worst flowability (Carr Index 28). MCC is the material that flows better (Carr Index 16.7).
4.2 Equipment
The system used consists of two loss-in-weight feeders (K-Tron), a continuous in-line mixer (Modulomix, Hosokawa Micron) with a NIR spectral camera (Specim, Finland) and integration sphere (VTT, Finland) attached to its outlet port and a conveyor belt under the sphere’s discharge (Figure 11).
Figure 11 - Experimental configuration setup
4.2.1 Powder blending
a) Three LIW powder feeders K-Tron, K-ML-D5-KT20 (for excipients and API) b) One in-line continuous mixer, Hosokawa Modulomix
a) LIW Twin Screw Feeders
All three of the K-Tron K-ML-D5-KT20 twin screw feeders (Figure 12) used in the experimental work were able to operate either in volumetric mode or gravimetric mode. It is important to know the operating differences between each mode in order to understand which was better for this experiment.
Figure 12 - K-Tron LIW powder feeders
Volumetric feeding principle
Bulk material is discharged from a hopper with a constant volume per unit of time by regulating the speed of the feeding device. The actual volume of material fed is determined through calibration. The feeding accuracy is dependent on the uniformity of the material flow characteristics and the bulk density.
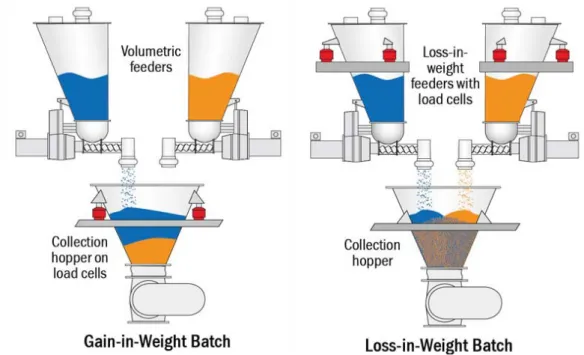
Gain-in-weight (GIW) batches employ volumetric feeders to feed each ingredient sequentially, while loss-in-weight (LIW) feeders feed multiple ingredients simultaneously into a collection hopper (Figure 13). Instead of the layering of ingredients that you get with GIW feeding, in LIW feeding all the ingredients are metered at the same time, eliminating the layering effect and the time and cost for further processing downstream. It is relevant to state that in continuous mixing, due to time constraints and to the several simultaneous feeding flows, GIW operation is generally not possible and thus
LIW provides the more reliable feeding mechanism.
Figure 13 - Gain-in-weight versus loss-in-weight batching schematic (adapted from (57))
LIW gravimetric feeding principle
Bulk material is discharged from the hopper with a constant weight per unit of time by weighting the hopper/feeder assembly and regulating the speed of the feeding device depending on the rate of weight loss. The weighting control system compensates for non-uniform material flow characteristics and variations in bulk density, an advantage over volumetric feeding, therefore providing a high degree of feeding accuracy.
When the hopper reaches a predetermined minimum weight level, the LIW control can be briefly interrupted and the hopper refilled. During the refill period the controller regulates the speed of the feeding device based upon the historic weight and speed information that was accumulated during the previous weight loss cycle, or switches to a default volumetric mode. The LIW feeding principle is most accurate when using a high resolution, fast responding, vibration immune weighing systems such as the D5 platform scale or load cells combined with self-tuning controls such as the compact Coperion K-Tron Control Module (KCM).
Figure 14 - Loss-in-weight powder feeder schematic (adapted from (58))
LIW feeders (Figure 14) are the best at providing fast and accurate measurement and control of individual ingredients fed into a batch or continuous process. When the wheighting accuracy of each ingredient in a process is crucial to maintain the formulation within specification, when a formulation includes micro ingredients that are usually expensive, when cycle times must be kept short, or there is a big gap in the ratio of a major ingredient to a minor ingredient, LIW feeders are the best solution.
In very specific situations, if additional verification of delivered batch weight is required, a dual weighing scenario may be used, with the combination of a LIW feeding into a GIW system.
Batch size and accuracy requirements will often determine whether GIW or LIW feeders are the best for the process. In general, GIW feeding can be used in batch manufacturing when the response time and resolution of a platform scale is sufficient to guarantee batch accuracy requirements. Even though most floor scales do not have sufficient speed and resolution to measure small amounts of product into a large volume container.
Achieving an accuracy of < ± 0,03 %, the K-Tron system employed uses a hopper with twin screw LIW feeders mounted on a D5 Platform Scale that provides 1 part in 4 million resolution, controlled by a compact KCM. The LIW KCM controller monitors
material weight loss from the hopper and controls the start/stop functions of the feeder. With each feeder possessing its own dedicated weighing system, the K-Tron LIW Twin Screw Feeder system delivers each ingredient with great accuracy, in less time, and was the best solution for this experimental setup.
b) In-line continuous mixer
The in-line continuous mixer used was a Hosokawa Modulomix (
Figure 15
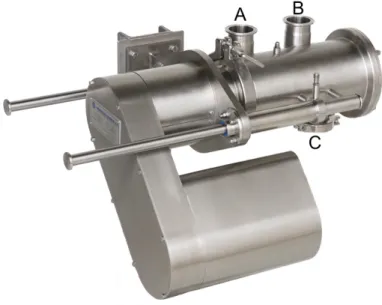
). It has a small footprint with good reactivity, holds a relatively small residue at the end of mixing and has rapid start-up and shutdown protocols. It produces a homogeneous mix in a blending chamber, with little change to PSD or temperature. It can operate at a range of 300 to 1460 rpm, has a maximum capacity of 130 kg/h and can be used with different mixing conditions due to its in-process variable rotor speed as well as several designs of its agitator blades.Figure 15 - Modulomix in-line mixer with inlet ports A and B, and outlet port C
Inlet ports A and B are connected to the feeding systems and can be used for separate feeding of API and excipients to the mixer. Inside the mixing chamber there is a rotating axis on which the agitator blades are placed at diferent angles (Figure 16). On the axis there is also a partitioning disc separating almost completely the mixing chamber between the inlet port zone and outlet port zone. This helps prevent powder from exiting the mixer through outlet port C without having been properly blended.
Figure 16 - Modulomix in-line mixer. On the left: With the side panel removed, exposing the mixing chamber. On the right: Before cleaning with the external casing removed
If necessary, due to formulation requirements, multiple Modulomix mixers can be cascaded in series to allow for multiple stage mixing processes. As seen in Figure 17 up to three diferent formulation components (API, binder, diluent, etc) can be fed through the first inlet port at the same time and, If needed, aditional components may also be added through the second inlet port.
All of these components are blended eficiently within the mixer under high shear conditions. If the formulation requires the addition of a lubricant this can be done through the third inlet port that directly connects to the second mixer where the blending occurs at low shear conditions (needed for the lubricant).