Repositório ISCTE-IUL
Deposited in Repositório ISCTE-IUL:2019-05-22
Deposited version:
Post-print
Peer-review status of attached file:
Peer-reviewed
Citation for published item:
Moro, S. & Rita, P. (2019). Identification of common city characteristics influencing room occupancy. International Journal of Tourism Cities. N/A
Further information on publisher's website:
10.1108/IJTC-08-2018-0063
Publisher's copyright statement:
This is the peer reviewed version of the following article: Moro, S. & Rita, P. (2019). Identification of common city characteristics influencing room occupancy. International Journal of Tourism Cities. N/A, which has been published in final form at https://dx.doi.org/10.1108/IJTC-08-2018-0063. This article may be used for non-commercial purposes in accordance with the Publisher's Terms and Conditions for self-archiving.
Use policy
Creative Commons CC BY 4.0
The full-text may be used and/or reproduced, and given to third parties in any format or medium, without prior permission or charge, for personal research or study, educational, or not-for-profit purposes provided that:
• a full bibliographic reference is made to the original source • a link is made to the metadata record in the Repository • the full-text is not changed in any way
The full-text must not be sold in any format or medium without the formal permission of the copyright holders.
Serviços de Informação e Documentação, Instituto Universitário de Lisboa (ISCTE-IUL) Av. das Forças Armadas, Edifício II, 1649-026 Lisboa Portugal
Phone: +(351) 217 903 024 | e-mail: administrador.repositorio@iscte-iul.pt https://repositorio.iscte-iul.pt
Identification of common city characteristics influencing room
occupancy
Abstract
Purpose
National tourism offices worldwide implement marketing strategies to influence tourists’ choices. However, there is more than meets the eye when it comes to choose a city as a tourism destination. This study seeks to answer which are the characteristics that play a key role in room occupancy.
Design/methodology/approach
Diverse characteristics such as the city offer, demographics, natural amenities (e.g., number of beaches), and also politics (e.g., type of government) are combined into a decision tree model to unveil the relevance of each in determining room occupancy. The empirical experiments used data known in 2015 from 43 cities from Europe and the rest of the World to model room occupancy rate in 2016.
Findings
While the seasonality effect plays the most significant role, other less studied features such as the type of political party prior to current government were found to have an impact in room occupancy.
Originality/value
This study unveiled that center-right and right governments are generally more sensitive to promote their cities as tourism destinations.
Keywords
1. Introduction
City tourism attractiveness is a combination of a myriad of factors that are dispersed across the literature. These include the geographic location (Pearce, 2015), the weather (Buhalis and Amaranggana, 2015), and the destination marketing (Heeley, 2016), among others. Those factors reflect tourist demand and, consequently, influence a city’s occupancy rate in terms of the number of rooms occupied versus the city’s offer. Although a city’s offer tends to adjust itself to tourist flocks, such adjustments take time and demand fluctuation often results in different levels of occupancy (Pan, 2007). Furthermore, little is known about the impact of local governments which, due to their political orientations, can influence a city’s attractiveness through brand destination marketing (Heeley, 2015).
Occupancy rate has been one of the most prominent hotel performance metrics used by the tourism industry (Chen et al., 2015). A significant number of forecasting techniques have been studied to determine occupancy rate. Arguing that time series forecasting models do not take advantage of the last trend in the data series, Law (2004) proposed to compute hotel occupancy rates based on an improved extrapolative time series forecasting technique that delivered good results. Neural networks have been also tested in forecasting room occupancy rates vis-à-vis multiple regression and naïve extrapolation (Law, 1998). When estimating room occupancy rates as compared with actual room occupancy rates, neural networks were found to outperform the above mentioned two commonly used forecasting techniques.
This study aims to encompass, under a unique model, a relevant set of features backed by current literature as relevant for modeling occupancy rate. Such model helps not only in forecasting demand, but also in explaining which of the variables grounded on the literature contribute the most to occupancy rate. By using a simple yet effective and readable decision tree, decision makers can easily understand each variable’s effect on occupancy.
2. Literature review
With the explosion of social media use, consumer reviews on websites like TripAdvisor, Booking.com and Yelp (Moro et al., 2018a; Nave et al., 2018; Moro et al.,
2017; Guerreiro and Moro, 2017), have also been under scrutiny to assess how critical is their role in choosing a hotel and consequent effects regarding hotel occupancy rates. Viglia et al. (2016) used regression analysis to measure the influence of review score, review variance and review volume on occupancy rates. Review score was found to be the highest impact dimension of consumer reviews, with a one–point increase in the review score being associated with a 7.5% increase in the occupancy rate, thus signaling reputation management as an important asset to increase hotel occupancy.
Average daily rate (ADR) is a most frequently used metric to evaluate hotel performance. Oses et al. (2016) presented a model to explain and predict mean hotel occupancy rates by destination based on prices offered online, achieving high model fit and good predictions. In turn, revenue per available room (RevPAR) is seen by hotel companies as an effective way to assess hotel room supply and demand (Slattery, 2002). Actually, Enz et al. (2009) underwent a seven-year study and found that the hotels offering average daily rates above those of their direct competitors achieved higher relative RevPAR, despite having lower comparative occupancies.
Hotel performance such as occupancy rate is also likely to be influenced by city characteristics. For instance, Lu and Lam (2017) suggested that urbanization, measured by economic, geographical landscape, population and social cultural dimensions, generally improves hotel performance but with different effects. The influence of a country’s area and population size on tourism has led Khadaroo and Seetanah (2008) to include them in their tourism flow model. Padilla and McElroy (2017) proposed a metaphor of “Three Cs” (context, characteristics and consequences), arguing that tourism results from a complex set of interrelated socio-economic macro forces (context), with the interaction between context and characteristics defining at great length the observed consequences or results. Political governments are known to influence cities’ attractiveness in bringing more guests to their hotels (e.g., Stepchenkova and Shichkova, 2017; Webster et al., 2016). Moreover, Rigall-I-Torrent
et al. (2011) studied the effects of beach characteristics and location with regard to hotel
prices, and found that hotels located in front of a beach increased the price of a room by between 13%-17%, and that a blue flag could allow for an increase in price by nearly 12%. Seasonality is another factor that should be taken into account and measured in terms of the seasonal concentration of tourist activity as well as the decomposition of the monthly concentration by major markets (Duro, 2016).
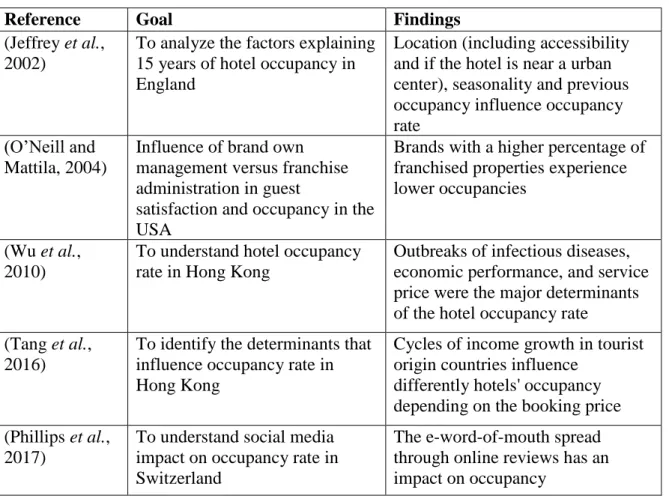
Table 1 summarizes five studies focusing on hotel occupancy rate. Two of them analyzed Hong Kong, one of the largest and most populated cities in the world and encompassing a specific context, as Wu et al. (2010) pointed by identifying the influence of disease outbreaks on occupancy rate. The remaining three are country scope analyses (e.g., UK, Switzerland, and USA). Both O’Neill and Mattila (2004) and Philips et al. (2017)’s studies are focused on specific subjects: franchised hotels and social media, respectively. The older study, by Jeffrey et al. (2002), is a compilation of time-spanned analysis considering factors such as seasonality and location. Thus, Table 1 shows a lack of an updated holistic model able to explain how different factors contribute to different cities’ occupancy rate.
3. Materials and methods
The experimental procedure consisted in gathering data from 43 cities, twenty-five of them in the European Union, eight in the rest of Europe, and the remaining ten in the rest of the world (Table 2). These cities were chosen because they are capitals of countries in Europe, the widely visited “Old Continent” that people across the world dream to visit (e.g., Pung and Del Chiappa, 2018; White, 2012), while the remaining cities were chosen for being among the top 100 destinations worldwide (https://www.listchallenges.com/top-100-most-visited-cities-in-the-world/stats). Choosing such a diversity of different cities requires including features that characterize that diversity, such as if a city is coastal or not. Thus, the model needs to handle several distinct independent variable features to understand each influence on the dependent variable room occupancy.
The number of rooms sold, the number of rooms available and room revenue in 2016 and 2015 were obtained through a survey answered by at least 10% of the property managers and encompassing at least 20% of the room offer. Although such data can be more reliable if obtained from official sources (e.g., as Chattopadhyay and Mitra, 2018, did), surveys have also been previously applied to collect ADR/revenue data (e.g., Tarí et al., 2017). Furthermore, there is not a unique source for cities from such different places. Thus, the survey provides a uniform method of data collection for all cities.
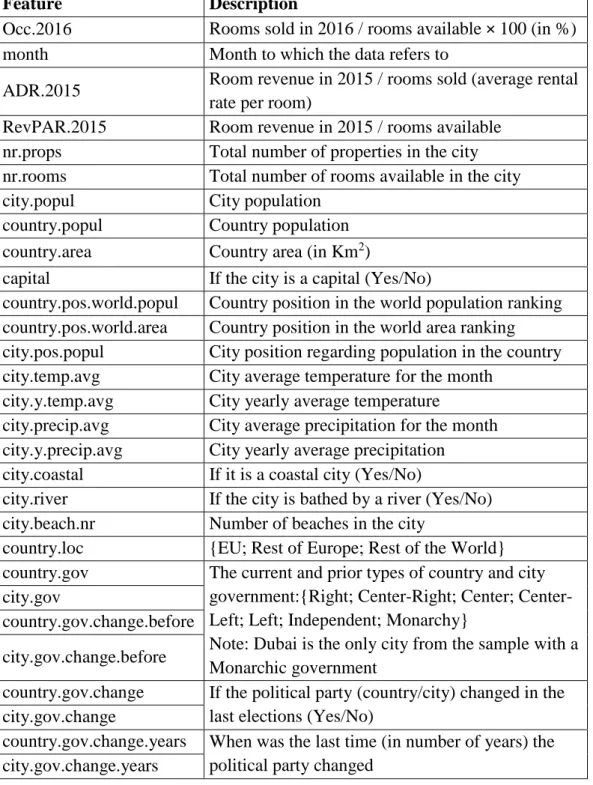
The occupancy rate is the ratio between rooms sold and rooms available, constituting the variable to model. The dataset holds a granularity on a city and month basis, with a total of 516 rows, with data corresponding to 2016, except the dependent variables for computing the average daily rate and the revenue per available room. Thus, the seasonality effect is considered on a month level. Also, data on demographics, natural amenities and weather, and politics were collected from freely available sources such as the CIA website (https://www.cia.gov/library/publications/resources/the-world-factbook/geos/print_nl.html) and the WeatherBase website (http://www.weatherbase.com). Table 3 shows the total 29 features used for building the model.
To assess weather, both the average monthly and yearly temperatures and precipitation are considered. Regarding the types of government, all the cities and corresponding countries hold a democratic government (left to right wing, as well as independent parties), with the exception of Dubai, ruled under a monarchy.
The occupancy rate model was built by adopting a decision tree, which is a binary structure where each node represents a decision based on the features used to build the model (Moro et al., 2018b). Specifically, the CART (Classification and Regression Tree) method was adopted, which uses the Gini coefficient to compute each potential node split’s purity. The node with the lowest Gini value (most pure) is then chosen to create the next branches until reaching the final leaf (Rutkowski et al., 2014). Therefore, the CART model can deal with distinct features by choosing the most relevant ones for occupancy rate, as required given the different cities included in the analysis.
A decision tree model is very intuitive to human understanding, which is a major advantage when compared to more complex black-box models such as neural networks. Thus, starting from the tree’s root, a sequence of rules can be obtained by following the branches through nodes which evaluate input features to decide the next split.
All the experiments were conducted using the R statistical tool, which is an open source language and environment specifically suited for data analysis, benefiting from an enthusiastic community worldwide who implement and make available packages for all types of analysis (Cortez, 2014). For modeling the decision tree, the “rminer” package was chosen, which implements a set of functions for data mining, including decision tree modeling (Cortez, 2010).
4. Results and discussion
The decision tree model was validated through a k-fold cross validation scheme (Bengio and Grandvalet, 2004). As recommended by Refaeilzadeh et al. (2009), k was set to ten, assuring modeling robustness. The accuracy in modeling was assessed through two widely known metrics: the mean absolute error (the deviation of the predicted value from the real occupancy rate) and the mean absolute percentage error (the relation of the deviation and the real value) (Hyndman and Koehler, 2006). The former metric achieved a result of 6.9% (noting that the occupancy rate is also a percentage) while the latter got a result of 15.5%.
Figure 1 plots the decision tree where each node represents a decision toward discovering occupancy rate. Each leaf represents a specific occupancy rate given by a set of rules through each branch from the root (top) node to the leaf. As an example:
IF month between April and November
AND country located in the Rest of Europe (not in European Union) AND city yearly average temperature above 11.5º C
THEN the occupancy rate is 54%
Some interesting findings emerge from this tree model. The geographic and political location of the country where the city is located holds significant influence, with several branches highlighting that depends if the city resides in the European Union, in the rest of Europe, or in the rest of the world. This is corroborated by Lugosi and Walls (2013), as the country and city’s investments in promoting tourism has a positive effect on the success of attracting visitors. The rest of Europe (apart from European Union countries) is influenced by air temperature, with colder countries having a higher occupancy rate, showing a better fit for tourist demand. Also, coastal cities or with a higher number of beaches tend to fill more the rooms offered. While the sea, sun and beach effect is a known attractive factor (e.g., Presenza et al., 2013), this study highlights that the rate supply/demand is higher for non-coastal cities, suggesting there is still gap for increasing the offer in coastal cities.
However, the most striking finding is the influence of the country’s political government type before its last change. Our study demonstrates that in general, center-right and center-right local governments show greater focus in promoting the country and its
cities as brand destinations, thus helping achieving higher occupancy rates. Hence, center-left and left local governments are more likely to give more emphasis to other concerns.
5. Conclusions
5.1. Theoretical and practical implications
This study contributes to current state-of-the-art in several ways. First, it shows how a simple yet effective data-driven approach to model occupancy rate can highlight the individual contribution of different features. The easy to read rules extracted from the decision tree show evidence that center-right and right parties invest more on promoting their countries as brand destinations. This finding has no precedent in current literature, since current studies have focused on specific locations and did not try to offer a broader perspective including distinct political wings. From a practical perspective, citizens can expect in general that a center/left party will devote lesser attention to tourism promotion. Another contribution is related to coastal cities and with beaches, which tend to have higher occupancy rates. Such finding suggests that there is still room for increasing offer in those cities, when compared to the remaining ones. Thus, tourist offices can manage grant licenses based on their city’s characteristics. A takeaway related to this contribution is the discovery that colder cities in the rest of Europe have a more adjusted offer, exhibiting higher occupancy rates when compared to hotter cities in the same region.
5.2. Limitations and future research
This study aimed at a broader scope by including 43 cities around the world. Yet, this is not sufficient for a full generalization, considering the specificities of tourism cities. Also, governmental data sources could be used instead of surveys. Those sources would pose two new challenges: (1) data is not available for all cities; and (2) data is not on the same format nor with the same detail. Yet, an endeavor to understand if the presented results are similar to ours emerges as an interesting avenue for further research.
Additionally, this study calls for more research based on the political influence of both national and city’s governments in increasing the occupancy rate.
References
Bengio, Y. and Grandvalet, Y. (2004), “No unbiased estimator of the variance of k-fold cross-validation”, Journal of Machine Learning Research, Vol.5, pp.1089-1105.
Buhalis, D., and Amaranggana, A. (2015), “Smart tourism destinations enhancing tourism experience through personalisation of services”, in Information and
communication technologies in tourism (pp.377-389). Springer, Cham.
Chattopadhyay, M., and Mitra, S.K. (2018), “Determinants of revenue per available room: Influential roles of average daily rate, demand, seasonality and yearly trend”,
International Journal of Hospitality Management. DOI: 10.1016/j.ijhm.2018.09.001. Chen, C.M., Yang, H.W., Li, E.Y., and Liu, C.C. (2015), “How does hotel pricing influence guest satisfaction by the moderating influence of room occupancy?”, International Journal of Hospitality Management, Vol.49, pp.136-138. Cortez, P. (2010), “Data mining with neural networks and support vector machines using the R/rminer tool”, Advances in data mining. Applications and theoretical
aspects, pp.572-583.
Cortez, P. (2014), Modern optimization with R, Springer.
Duro, J.A. (2016), “Seasonality of hotel demand in the main Spanish provinces: Measurements and decomposition exercises”, Tourism Management, Vol.52, pp.52-63. Enz, C.A., Canina, L., and Lomanno, M. (2009), “Competitive pricing decisions in uncertain times”, Cornell Hospitality Quarterly, Vol.50 No.3, pp.325-341.
Guerreiro, J., and Moro, S. (2017), “Are Yelp's tips helpful in building influential consumers?”, Tourism Management Perspectives, Vol.24, pp.151-154.
Heeley, J. (2015), “Urban destination marketing in contemporary Europe–what does “good” look like?”, International Journal of Tourism Cities, Vol.1 No.1, pp.36-49.
Heeley, J. (2016), “Rethinking urban destination marketing”, International Journal of
Tourism Cities, Vol.2 No.1,pp.94-102.
Hyndman, R.J., and Koehler, A.B. (2006), “Another look at measures of forecast accuracy”, International Journal of Forecasting, Vol.22 No.4, pp.679-688.
Jeffrey, D., Barden, R.R., Buckley, P.J., and Hubbard, N.J. (2002), “What makes for a successful hotel? Insights on hotel management following 15 years of hotel occupancy analysis in England”, Service Industries Journal, Vol.22 No.2, pp.73-88.
Khadaroo, J., and Seetanah, B. (2008), “The role of transport infrastructure in international tourism development: A gravity model approach”, Tourism Management, Vol.29 No.5, pp.831-840.
Law, R. (1998), “Room occupancy rate forecasting: a neural network approach”, International Journal of Contemporary Hospitality Management, Vol.10 No.6, pp.234-239.
Law, R. (2004), “Initially testing an improved extrapolative hotel room occupancy rate forecasting technique”, Journal of Travel & Tourism Marketing, Vol.16 No.2-3, pp.71-77.
Lugosi, P. and Walls, A.R. (2013), “Researching destination experiences: Themes, perspectives and challenges”, Journal of Destination Marketing & Management, Vol.2 No.2, pp.51-58.
Luo, J.M., and Lam, C.F. (2017), “Urbanization effects on hotel performance: A case study in China”, Cogent Business & Management, Vol.4 No.1, Article:1412873.
Moro, S., Rita, P., and Coelho, J. (2017), “Stripping customers' feedback on hotels through data mining: The case of Las Vegas Strip”, Tourism Management
Perspectives, Vol.23, pp.41-52.
Moro, S., Rita, P., and Oliveira, C. (2018a), “Factors influencing hotels’ online prices”,
Journal of Hospitality Marketing & Management, Vol.27 No.4, pp.443-464.
Moro, S., Cortez, P., and Rita, P. (2018b), “A divide‐and‐conquer strategy using feature relevance and expert knowledge for enhancing a data mining approach to bank telemarketing”, Expert Systems, Vol.35 No.3, Article:e12253.
Nave, M., Rita, P., and Guerreiro, J. (2018), “A decision support system framework to track consumer sentiments in social media”, Journal of Hospitality Marketing &
Management, Vol.27 No.6, pp.693-710.
O’Neill, J.W., and Mattila, A.S. (2004), “Hotel branding strategy: Its relationship to guest satisfaction and room revenue”, Journal of Hospitality & Tourism Research, Vol.28 No.2, pp.156-165.
Oses, N., Gerrikagoitia, J.K., and Alzua, A. (2016), “Modelling and prediction of a destination’s monthly average daily rate and occupancy rate based on hotel room prices offered online”, Tourism Economics, Vol.22 No.6, pp.1380-1403.
Padilla, A., and McElroy, J.L. (2017), “The three Cs of Caribbean tourism: Contexts, characteristics, and consequences”, ARA: Revista de Investigación en Turismo, Vol.2 No.2, pp.78-90.
Pan, C.M. (2007), “Market demand variations, room capacity, and optimal hotel room rates”, International Journal of Hospitality Management, Vol.26 No.3, pp.748-753. Pearce, D.G. (2015), “Urban management, destination management and urban destination management: a comparative review with issues and examples from New Zealand”, International Journal of Tourism Cities, Vol.1 No.1, pp.1-17.
Phillips, P., Barnes, S., Zigan, K., and Schegg, R. (2017), “Understanding the impact of online reviews on hotel performance: an empirical analysis”, Journal of Travel
Research, Vol.56 No.2, pp.235-249.
Presenza, A., Del Chiappa, G., and Sheehan, L. (2013), “Residents’ engagement and local tourism governance in maturing beach destinations. Evidence from an Italian case study”, Journal of Destination Marketing & Management, Vol.2 No.1, pp.22-30.
Pung, J.M., and Del Chiappa, G. (2018), “Understanding Chinese Travellers’ Motivations to Visit Europe”, in Tourist Behavior (pp.187-201). Springer, Cham. Refaeilzadeh, P., Tang, L., and Liu, H. (2009), “Cross-validation”, in L. Liu, & M. T. Özsu (Eds.), Encyclopedia of Database Systems (pp.532–538). USA: Springer.
Rigall-I-Torrent, R., Fluvià, M., Ballester, R., Saló, A., Ariza, E., and Espinet, J. M. (2011), “The effects of beach characteristics and location with respect to hotel prices”, Tourism Management, Vol.32 No.5, pp.1150-1158.
Rutkowski, L., Jaworski, M., Pietruczuk, L., and Duda, P. (2014), “The CART decision tree for mining data streams”, Information Sciences, Vol.266, pp.1-15.
Slattery, P. (2002), “Reported RevPAR: unreliable measures, flawed interpretations and the remedy”, International Journal of Hospitality Management, Vol.21 No.2, pp.135-149.
Stepchenkova, S. and Shichkova, E. (2017), “Attractiveness of the United States as a travel destination for the Russian tourist in the era of strained bilateral relations”,
International Journal of Tourism Cities, Vol.3 No.1, pp.87-101.
Tang, M.C.F., Kulendran, N., King, B., and Yap, M.H. (2016), “Using demand determinants to anticipate fluctuations in hotel occupancy”, Tourism Economics, Vol.22 No.1, pp.179-187.
Tarí, J.J., Pereira-Moliner, J., Pertusa-Ortega, E.M., López-Gamero, M.D., and Molina-Azorín, J.F. (2017), “Does quality management improve performance or vice versa? Evidence from the hotel industry”, Service Business, Vol.11 No.1, pp.23-43.
Viglia, G., Minazzi, R., and Buhalis, D. (2016), “The influence of e-word-of-mouth on hotel occupancy rate”, International Journal of Contemporary Hospitality Management, Vol.28 No.9, pp.2035-2051.
Webster, C., Yen, C.L., and Hji-Avgoustis, S. (2016), “RFRA and the hospitality industry in Indiana: political shocks and empirical impacts on Indianapolis’ hospitality and tourism industry”, International Journal of Tourism Cities, Vol.2 No.3, pp.221-231. White, R. (2012), “Time travel: Australian tourists and Britain's past”, PORTAL Journal
of Multidisciplinary International Studies, Vo.10 No.1, pp.1-25.
Wu, E.H., Law, R., and Jiang, B. (2010), “Data mining for hotel occupancy rate: an independent component analysis approach”, Journal of Travel & Tourism Marketing, Vol.27 No.4, pp.426-438.
Table 1 - Summary of studies on occupancy rate.
Reference Goal Findings
(Jeffrey et al., 2002)
To analyze the factors explaining 15 years of hotel occupancy in England
Location (including accessibility and if the hotel is near a urban center), seasonality and previous occupancy influence occupancy rate
(O’Neill and Mattila, 2004)
Influence of brand own management versus franchise administration in guest
satisfaction and occupancy in the USA
Brands with a higher percentage of franchised properties experience lower occupancies
(Wu et al., 2010)
To understand hotel occupancy rate in Hong Kong
Outbreaks of infectious diseases, economic performance, and service price were the major determinants of the hotel occupancy rate
(Tang et al., 2016)
To identify the determinants that influence occupancy rate in Hong Kong
Cycles of income growth in tourist origin countries influence
differently hotels' occupancy depending on the booking price (Phillips et al.,
2017)
To understand social media impact on occupancy rate in Switzerland
The e-word-of-mouth spread through online reviews has an impact on occupancy
Table 2 - Cities studied.
City Location Milan European Union
Amsterdam European Union Moscow Rest of Europe Athens European Union Paris European Union Barcelona European Union Prague European Union
Baku Rest of Europe Riga European Union
Belgrade Rest of Europe Rome European Union Berlin European Union Saint Petersburg Rest of Europe Bratislava European Union Sofia European Union Brussels European Union Tel Aviv Rest of the World Bucharest European Union Vienna European Union Budapest European Union Vilnius European Union Copenhagen European Union Warsaw European Union Dublin European Union Zurich Rest of Europe Edinburgh European Union Beijing Rest of the World Frankfurt European Union Buenos Aires Rest of the World Geneva Rest of Europe Dubai Rest of the World Helsinki Rest of Europe Hong Kong Rest of the World Istanbul Rest of Europe Los Angeles Rest of the World Lisbon European Union New York Rest of the World London European Union Sydney Rest of the World Madrid European Union Tokyo Rest of the World Manchester European Union Toronto Rest of the World
Table 3 - Features included in the model.
Feature Description
Occ.2016 Rooms sold in 2016 / rooms available × 100 (in %) month Month to which the data refers to
ADR.2015 Room revenue in 2015 / rooms sold (average rental rate per room)
RevPAR.2015 Room revenue in 2015 / rooms available nr.props Total number of properties in the city nr.rooms Total number of rooms available in the city city.popul City population
country.popul Country population country.area Country area (in Km2)
capital If the city is a capital (Yes/No)
country.pos.world.popul Country position in the world population ranking country.pos.world.area Country position in the world area ranking city.pos.popul City position regarding population in the country city.temp.avg City average temperature for the month
city.y.temp.avg City yearly average temperature
city.precip.avg City average precipitation for the month city.y.precip.avg City yearly average precipitation
city.coastal If it is a coastal city (Yes/No)
city.river If the city is bathed by a river (Yes/No) city.beach.nr Number of beaches in the city
country.loc {EU; Rest of Europe; Rest of the World} country.gov The current and prior types of country and city
government:{Right; Right; Center; Center-Left; Center-Left; Independent; Monarchy}
Note: Dubai is the only city from the sample with a Monarchic government
city.gov
country.gov.change.before city.gov.change.before
country.gov.change If the political party (country/city) changed in the last elections (Yes/No)
city.gov.change
country.gov.change.years When was the last time (in number of years) the political party changed
month country.loc RevPAR.2015 country.gov.c hange.before country.area country.pos .world.area RevPAR.2015 city.coastal 85% 79% 78% 67% 67% 59% 64% city.y.temp. avg month 54% 79% 68% nr.rooms nr.rooms country.gov.c hange.before 81% 69% month 49% city.beach .nr 54% 75% 62% Dec-Mar Apr-Nov < 65 ≥ 65 < 8 ≥ 8 Center-Left;Center; Left Center-Right; Right; Monarchy; Independent ≥ 11.5ºC < 11.5ºC < $97.31 Rest of Europe European Union; Rest of the World
≥ $97.31 Jan Dec; Fev; Mar < 11 ≥ 11 Apr; May; Oct; Nov Jun-Sep Center; Center-Left; Left Center-Right; Right; Monarchy; Independent < 36k km 2 ≥ 36k km2 ≥ #133 < #133 No Yes < $42.19 ≥ $42.19