Firm Behaviour and Town Size - a comparison between firms in small and
medium-sized towns in the Netherlands and Portugal
E.S. van Leeuwen
Free University AmsterdamP. Nijkamp
Free University Amsterdam
T. de Noronha Vaz
University of AlgarveIntroduction
Nowadays, small and medium-sized towns in rural areas often are attractive tourist places. People enjoy the relative quietness and peacefulness together with the historical values present. The old market, church, and city hall remember us about earlier times. Among many stories, these old buildings tell us something about the importance and role of towns many years ago. It where places where products where sold and bought, deals were made, it were trading places. Residents from smaller towns or from the countryside regularly visited the place for business and pleasure.
In 1933, Walter Christaller described some of these relationships in his book, the Central places in Southern Germany, about spatial distributions of cities and towns according to his observations. Christaller argued that central places form a hierarchy: there are a large number of market towns, every group of market town is focused on a larger administrative centre and so on. The central-place theory can be best seen as a classification scheme, a description of the economy’s spatial structure (Fujita et al., 1999).
Two main ideas are important in this theory: First of all, the threshold of a particular good or service. This threshold refers to the number of people required to support it. Certain functions such as hospitals require larger number of consumers than other functions such as sales of grocery. Secondly the area from which a service draws its customers is relevant. Therefore a service with a high population threshold will tend to draw its custom from a wider area than one with a smaller threshold (Robinson 1990). The settlement hierarchy reflects the variation in thresholds and complementary regions (areas of customers) such that those settlements, or central places at the top of the hierarchy offer both higher and lower order goods, thereby serving a wider complementary region, than settlements at the lower end of the hierarchy where only lower order goods are available. Klemmer (1978) added that a functional relationship exists between the central place and its hinterland, which is indicated by a specific flow of products and services from the central place to its hinterland or by a reverse flow of demand from the hinterland to the central place. In a spatial-economic hierarchy the size and distribution of firms is thus determined by spatial- economic motives.
These days the size of the hinterland is growing as globalisation seems to become a dominant force. More and more firms are acting in response to a world market and are exposed to global competition. Nevertheless it is thought that within this global economy not just national but also regional and local environments still have a considerable importance for the competitiveness of firms (Tödtling 1995). When the local production environment is of high-quality, the firm will perform better. But in addition, the regional production structure can effect the growth of a firm as well when, for example, a large share of good performing, growing sectors is at hand (Lambooy, et al., 1997). Characteristics of the region and the locality have an impact on the behaviour of firms. On the other hand, the behaviour of firms feeds back on the local and regional environment. Firms shape the regional factor endowment (e.g. through their demand and through internal training) and they also have an
impact on the knowledge base and the networks of the region (Tödtling, 1995). Thus regions affect the performance of firms but also firms affect economic growth of regions, a mutual relationship exists.
In this paper we focus on the behaviour of firms in relation with the size of towns. According to Christaller, differently sized towns play different roles in (rural) economy. Not only the size of the market differs, but also accessibility or the availability of facilities such as transport. This implies that networks of sales, purchases and labour are different for firms in differently sized towns. Furthermore it is thought that a mutual relationship exists between towns and firms, they can affect each other. Therefore we will look at several characteristics of a set of 1450 firms, which tell something about their behaviour. We will make a comparison between firms located in small towns (5.000-10.000 inhabitants) or medium–sized towns (15.000-20.000 inhabitants), in the Netherlands and in Portugal. Firstly we will have a closer look at firm environments. Then, in the next section we will describe the data and the composition of firms in different kind of towns. This will be followed by a factor analysis to detect underlying structures in firm behaviour related to the size of the home- town of the firm. Finally we will draw conclusions.
Firm environments
Firms always distinguish between internal and external factors. Internal factors are under control of the firm itself and are closely related to the production process and organisation, obviously, external factors are not. Examples of external factors are the presence of a highway or railway, presence of schools, subsidies, or legislation. Most firms deal with different external factors because of different production processes, different markets, or different relevant policies.
According to Mc Dermott and Taylor (1982) not every factor is of the same importance to a firm. With part of the (external) factors a firm has to deal almost every day. These factors are for example customers, suppliers, competitors, and governments. This means that although the factors are external, the possibility exist to affect them to a certain extent.
Of course, these external factors differ due to different scale levels. On a national level, tax regulations, level of salaries, environmental legislation or the size of the market is of importance. But these factors are not interesting on a regional level because they usually do not differ between regions. On a regional level, things as main infrastructure, quality of the labour market or the presence of education institutes are more relevant. Finally we can distinguish factors on a local level which are of course more related to the direct environment of the firm such as accessibility, nearby firms, local restrictions and so on. In the Netherlands and to a lesser extent in the whole of Europe, regional differences tend to fade away (Lambooy et al., 1997).
As stated before, characteristics of a region and the locality have an impact on the behaviour firms. But firms also shape the regional factor endowment (e.g. through their demand and through internal training) and affect the knowledge base and the networks of the region. An important aspect of the behaviour of firms is the level of innovation (See Noronha Vaz, 2004 and Nijkamp, 2004). A few decades ago (in the 1960’s and 1970’s) a more or less rational behaviour of firms was assumed, with the assumption of full information about factors as local conditions and a high degree of mobility of certain activities. Varying location conditions were seen to lead to an innovation process hierarchically organised in space (Tödtling 1995). Nowadays it is thought that innovation is an incremental and continuous process, which at the regional level is strongly shaped by existing socio-economic structures and routines of firms (See Camagni, 1991). Often the importance of historically evolved routines, types of behaviour and organisational features of firms in various regions is stressed.
Tödtling (1995) developed an interesting figure (Figure 1) that shows the influencing factors of the level of innovation of firms. Of course these factors not only affect the level of innovation but the behaviour of firms in general.
Figure 1. Spatial differentiation of innovation, factors of influence at the firm level (according to Tödtling, 1995)
It becomes clear that six important factors affect the level of innovation or the behaviour of firms; location, markets, organisation of the firm, networks, strategy, and public policy.
In this paper, we look for different behaviour of firms according to a different location, in our case a small or medium-sized town. As this figure shows, an important aspect of the location is the competence and skills of labour. Furthermore accessibility and transport facilities are of importance. Of course we do not take into account the availability of these kind of facilities, but we do expect that this availability is higher in larger towns. Furthermore we expect that kind and spatial reach of markets differs between towns. Just as the figure describes, all these aspects affect the organisation and behaviour of the firm. Therefore we will include in our analysis variables related to purchases and sales (networks and markets) and variables related to labour (organisation). Because public policy is another more or less influential factor, we will also split the set of firms according to their nationality.
Dutch and Portuguese Towns
Smaller settlements (with a population of 5,000-20,000 people) form an important component of the economic structure of countries nowadays, especially when taking into account the declining importance of the agricultural sector because of globalization and technological progress (Courtney and Errington, 2000). Small and medium-sized towns are often seen as concentration points of activities of several institutions. According to, for example, central place theory, we may assume that small towns attract other activities than medium-sized towns do and, therefore, they play different roles in rural economies. Because the structure of the town affects the behaviour of firms we will first examine the number and kind of firms located in the towns, being part of the external environment.
Table 1 shows the number of different kinds of firms located in the Netherlands and Portugal.
When comparing the total absolute number of firms in the Netherlands with the total number in Portugal, it appears that Dutch firms are in a minority. Considering that Portugal is twice as big as the Netherlands in size but counts six million less inhabitants, this is quite remarkable. Furthermore we find that the total number of
Innovation
Amount and type of innovation activity
Location - Competence and skills of labour
- Facilities for communication and transport - Density of information
Markets - Kind and spatial reach of markets
- Strength of competition
Organisation Status of the firm Size of firm Organisation Skills Networks - Formal/informal co- operations
- Relations to suppliers and clients of stable nature - Corporate linkages
Strategy - Way of achieving competitive advantages - Risk taking and outward looking behaviour Public Policy
- Technology transfer - Financial support for innovation
agricultural firms is almost the same. But a big difference is that in the Netherlands most agricultural firms are located nearby the smaller towns, whereas in Portugal most of them are located near medium-sized towns. Table 1, Number and percentage of firms in Dutch and Portuguese towns
Industrial
category Netherlands Portugal
Total Medium Small Total Medium Small
# % # % # % # % # % # % Agriculture 90313 12 1114 14 165 4 29 87117 8 1573 15 1074 10 Industry 12610 5 17 1733 21 126 8 22 307377 29 2943 27 3544 34 Services 51276 7 70 5368 65 280 1 49 661234 63 6286 58 5942 56 of which retailers 11787 3 16 1112 14 691 12 291489 28 3131 29 3065 29 Total 72918 5 100 8215 100 572 3 100 1.05572 8 100 10802 100 10560 100 The total number of firms in small and medium-sized Portuguese towns is almost equal, in the Netherlands less firms are located in small towns. The Portuguese smaller towns even locate almost twice as much firms as the Dutch small towns!
Apart from the number of firms, it is remarkable that the share of agricultural firms is larger in the Netherlands, especially in the small towns. Furthermore, the share of industrial enterprises is much lower in the Netherlands; the Portuguese towns locate many more industrial firms. Concerning the services sector it is appealing to see that the share of services is somewhat higher in the Netherlands (except for the small towns), but that the share and number of retailers is much larger in Portugal. This can be explained by the assumption that the shops are much smaller in Portugal. In the Netherlands most products are bought in supermarkets, whereas in Portugal more small retail shops like groceries, bakeries etc. exist.
Summarising we can say that the number of firms in Portugal as a whole and also in the small and medium-sized towns is much larger than in the Netherlands. Nevertheless, the differences between small and medium-sized towns are much more obvious in the Netherlands. The small towns locate many more farms and the medium-sized towns more services. In Portugal the differences are less ambiguous. It does appear that more agricultural firms are located in medium-sized towns and more industrial firms in small towns.
Description of the data
For this analysis we used data derived from the European Union research project ‘Marketowns’. The Marketowns project focuses on the role of small and medium-sized towns as growth poles in regional economic development. For this purpose, the flow of goods, services and labour between firms and households in a sample of six small and medium-sized rural towns in EU countries is measured. The participating countries reflect the varied conditions of the existing and enlarged European Union, viz. France, Poland, Portugal, the Netherlands and the UK.
In each of the five participating countries, information on small and medium-sized towns has been collected on a set of relevant, predefined criteria, such as the fact that no other town with more than 3,000 inhabitants should be located in a hinterland of approximately 7 km. Furthermore, small towns are defined as towns with a population between 5.000 and 10.000 inhabitants and medium-sized towns as towns with a population between 15.000 and 20.000 inhabitants. Table 2 shows the selected small and medium-sized towns in the Netherlands and Portugal with their number of inhabitants.
Table 2. Selected small and medium-sized towns in the Netherlands and Portugal with the number of inhabitants.
Country Small Towns Medium Towns
Dalfsen 23465 Schagen 41330
Bolsward 27933 Nunspeet 46625
Netherlands
Oudewater 59450 Gemert 56060
Lixa 57595 Vila Real 49957
Tavira 24997 Silves 33830
Portugal
Mirandela 25819 Esposende 33325
To facilitate the analysis of economic linkages of firms and households in a town, several zones around a town have been distinguished. The town-centre itself is classified as zone A, the area within a circle of 7 km around the town-centre as zone B (the hinterland of the town-centre) and the area within a radius of 7 to 16 km around the town-centre as zone C. The remainder of the province where the town is located is classified as zone E, the rest of the country as zone F, the rest of the EU as zone G, and the rest of the world as zone H. For each town (zone A) and the immediately surrounding countryside (zone B), data were gathered from a systematic sample for farming and non-farming businesses using postal questionnaires and face-to-face interviews (see Terluin et al, 2003). For this analysis we grouped the zones in four areas: local, regional, national and international areas. This is shown in table 3.
Table 3: The distinguished zones around a town, grouped in four areas Distinguished zones
Local Town (Zone A) + 7km zone (Zone B)
Regional 7-16 km zone (Zone C) + rest of the province (Zone D) + rest of the region (Zone E) National Rest of the country (Zone F)
International Rest of the European Union (Zone G) + rest of the World (Zone H) Descriptive Statistics
For this analysis we are able to use a database with 1404 firms. More Portuguese firms are included in the database, because the Portuguese team interviewed them face to face, whereas the Dutch team sent postal questionnaires. Unfortunately the postal questionnaires resulted in a large share of incomplete answers. We only use the complete questionnaires.
Because a real mixture of firms is asked to give information (the share of included small and larger firms is the same in every town) the outcomes are very different. Table X shows the means with large standard deviations.
Table 4; Statistic descriptives (mean and standard deviation) of variables related to the behaviour of firms in four groups of towns
Medium Dutch (N=289) Small Dutch (N=260) Medium Portuguese (N= 426) Small Portuguese (N=429) Mean Std. Deviatio n Mean Std. Deviation Mean Std. Deviation Mean Std. Deviation Total purchases 783343 2986967 134127 2 11239167 138181 9 22283449 883431 8582019 Total sales 1211380 4041774 175864 2 12967908 189101 5 26670489 126087 8 11903317 Local purchases 26 33 20 29 34 37 33 37 Regional purchases 38 36 31 34 43 36 40 37 National purchases 28 35 40 38 17 30 21 33 International purchases 8 22 9 22 6 18 6 18 Local sales 41 39 38 37 62 36 66 35 Regional sales 34 33 28 30 26 31 20 27 National sales 20 32 28 35 6 18 6 16 International sales 5 19 5 17 6 17 8 22 Total FTE 8 49 7 24 9 28 8 21 Fulltime 71 34 72 33 92 20 93 18 Par time 26 33 26 32 7 17 6 17 Seasonal 3 13 2 11 1 11 1 7 Management 30 39 29 40 55 35 54 35 Skilled non-manual 24 32 24 33 8 18 8 19 Non-skilled non-manual 11 27 11 27 11 21 12 21 Skilled manual 31 40 30 39 19 30 20 30 Non-skilled manual 4 14 6 18 5 14 6 17
When we, first of all, focus on the average total sales and purchases of the firms, it appears that these values are highest in small Dutch towns and Medium Portuguese towns. In the medium-sized Dutch towns they are remarkably low.
The share of purchases in the four areas shows an interesting pattern. First of all the Portuguese firms buy larger shares of purchases on both the local and regional market than Dutch firms on average do. In the Netherlands more products are bought on the national market. On the other hand, in both countries, the firms in the small towns buy the largest share on the national market. When looking at the location of sales the picture is somewhat different: in both countries the largest share is sold on the local market but in Portugal this share is much larger (more than 60% on average). In the Netherlands the regional and national market is more important to the firms than in Portugal. In the Dutch small towns again the national market is relatively important.
The total average employment is almost the same in the four groups of towns, as should be according to planning of the database. Nevertheless the values are slightly lower in the Netherlands, possibly because larger firms tend to fill in fewer questionnaires completely. But according to the next variables (fulltime, par time and seasonal), the share of par time labour is significantly larger in Dutch towns. Interestingly, there are almost no differences between the small and medium-sized towns per country.
The labour skills related variables, the last group, again differ more between countries and almost not between small or medium-sized towns. In Portugal the share of management functions (in the total FTE) is almost twice as high as in the Netherlands. But in the Netherlands the share of skilled non-manual labour is three times as
high. Maybe employers are more often receive a manager title in Portugal. Also the share of skilled manual labour is higher in the Netherlands. Nevertheless the shares of non-skilled labour (both non-manual and manual) are the same in both countries.
Summarising we learned from the descriptive statistics that, according to this database, Dutch firms are more oriented to the national market and Portugal to the local and regional market. But, in both countries, the firms in small towns buy the largest shares of products on the national market (compared to the medium towns). These differences are quite large. The differences in the use of labour are less clear. Between small and medium-sized there seem to appear no differences. But in the Netherlands a larger share of employees works on a par time base. Furthermore the share of managers is much larger in Portugal, but the total share of skilled and non-skilled labour is the same!
Factor analysis
In this analysis we are looking for differences in firm behaviour related to the size of the home-town of the firm. By doing so we try to detect how the behaviour of firms is affected by the size of the town in which it is located. For the analysis we have information about 1404 firms located in 12 different towns, 3 small towns and 3 medium towns in Portugal and 3 small towns and 3 medium towns in the Netherlands.
Factor analysis is a statistical approach that can be used to analyse interrelationships between a large number of variables and to explain these variables in terms of their common underlying dimensions. The underlying assumption is that there exists a number of unobserved latent ‘factors’ that account for the correlations among observed variables. The main purpose of factor analytic techniques is to reduce the number of variables and/or to detect underlying patterns or structure in the relationships between variables. Our aim is not so much to find underlying patterns, the firms in the database are very heterogeneous, but to condense the number of variables. With a limited number of factors we will be able to look for significant differences between firms in small and medium sized towns.
In this paper we use principal component analysis with a varimax rotation. Unfortunately the Kaiser-Meyer- Olkin (KMO) measure is relatively low (around 0,5), indicating a diffusion in the pattern of correlations. This means that we must be aware of the heterogeneity of the data.
Table 5: The variables included in the factor analysis
# variables Purchases Agriculture 4 Industry 4 Services Local, Regional, National and International 4
Sales Total Local, Regional, 4
National and International Management 1 Labour Skilled 2 Non-skilled
Manual and
Non-manual 2
Fulltime, Par time or Seasonal
3
Total FTE 1
Total 25
In this factor analysis we use characteristics of both Portuguese and Dutch firms. The characteristics of the firms are described by three groups of variables: purchases, sales and labour (see Table 5). The purchases are subdivided in purchases in the agricultural, the industrial and the service sectors. Furthermore we included the location of the purchases and sales. The labour characteristics are split in skilled and non-skilled employees and in manual and non-manual. Furthermore the share of full timers, par timers and seasonal employees is included. The total Full Time Employment (FTE) is used as a measure of the size of the firm. Except from this last variable, all variables are measured in relative figures. This means that we used, for example, the share of local agricultural purchases from the total purchases, or the share of skilled-manual employees related to the total FTE. In the actual factor analysis some variables are excluded in case they correlated too much with other variables. This holds for national and regional service purchases, local sales and management.
Table 6 shows the factors which result from the factor analysis using the total number of firms both in Portugal and in the Netherlands. In the table we only show variable loadings higher than 0,4 or lower than -0,4. Only when variables with reasonable high loadings (higher than 0,160 with more than 500 observations) are meaningful, they are added (between brackets) to the table. The variables in italic have negative loadings. The four factors together explain 30% of the variance in the database. The first factor is best explained by sales variables and the fourth by purchases variables. The second and the third factor, mainly include labour related variables.
Table 6; Factors resulting from a factor analysis including all firms in all towns
Factor 1 2 3 4 Explained 30,0 8,2 8,2 7,4 6,2 Agriculture (Regional)/ National/ International Purchases (0,289)/ 0,672/ 0,777
Industry Regional (Local)
0,463 (0,341) Services Sales Regional -0,652 (National) (0,304) National/ International 0,632/0,720
Labour Skilled Manual Non-manual
0,790 0,720
(Non-manual) (-0,256)
Non-skilled (Non-manual) Non-manual
(-0,311) -0,647 Total FTE 0,484 LABEL REGIONAL AGAINST SUPRA -REGIONAL SALES MANUAL WORKFORCE SKILLED AGAINST NON -SKILLED NON -MANUAL LABOUR SUPRA-LOCAL AGRICULTURA L PURCHASES
Table 7; Regression analysis between the value added and the factors of the firms in all towns (N=1405, R²= 0,043) Constant 1 2 3 4 Coefficient 427479,4 0,071 0,190 0,016 0,026 T value 4,657 2,697 7,232 0,609 0,972 Significance 0,000 0,007 0,000 0,543 0,331 Factor labels
The variables that load highly on the first factor are national and international sales with a positive sign and regional sales with a negative sign. We label this factor as regional against supra-regional sales. The next factor consists of high loadings on labour related variables. The total workforce has a high loading, but even more important for this factor is skilled manual labour. The non-manual labour variables have an opposite sign. Therefore this factor will be labelled as manual workforce.
For a better understanding of the factors we also measured correlations between the factor scores and sector dummies (see appendix 1). From this we find that the second factor is most strongly correlated with the two industrial sectors: manufacturing and construction, which suits the label. The third factor is labelled as skilled against non-skilled non-manual labour. Apart from these two labour variables also local industrial purchases and national sales have reasonable high loadings. This can be explained by the correlation of the factor scores with the real estate, banking and wholesale sector. These sectors also make use of skilled non-manual labour. In a negative way the third factor is correlated with the retail and hotel and restaurant sector. Firms in these sectors often employ more non-skilled non-manual workers.
The fourth factor is more related with purchases. The national and international agricultural purchases and to a lesser extent the regional agricultural purchases have the highest loadings for this factor. The label we put on this factor is supra local agricultural purchases. As expected, this factor correlates especially with the agricultural sector.
Regression analysis between the four factors and the value added.
To learn more about the four factors, we are interested in which way they are important for a firm or, in other words, how they contribute to a certain level of success. Therefore we perform a regression analysis to find relationships between the value added of the firms and the four factors. Because the value added is derived in a rough way (by subtracting total purchases from the total sales) we have to threat the outcomes carefully.
From Table 7 we learn that both the first factor (regional against supra-regional sales) and the second factor (manual workforce) are significantly related to the value added. They are both positively related with the highest coefficient for the manual workforce. The other two factors also have positive coefficients but these values are not significant. It appears that these last factors are almost not related to the value added of the firms.
Of course many differences in firm characteristics exist between sectors. Although we included the kind of purchases in the analysis (in the agricultural, industrial or service sector), which indicates something about the kind of firm, we expect the relationship between value added and the four factors to be different when taking into account the kind of sector. Therefore we performed three additional regression analyses, for agricultural, industrial and service sectors (see Table 8). We see that none of the factors is significantly related to the value added for the agricultural firms. Only the coefficient of the first factor (sales) has a positive sign. The value added of the industrial firms particularly relates to the first and second factor (sales and manual workforce). The highest coefficient is the one of the manual workforce. Finally the service related firms have significant values for the first, second and fourth (agricultural purchases) factor. They are all positive but not very high.
Table 8; Regression analysis between the value added and the factors of the firms in all towns according to the kind of sector
Constant 1 2 3 4 Coefficient 57615,8 0,211 -0,048 -0,019 -0,006 T value 1,355 1,603 -0,366 -0,144 -0,049 Agricultural firms (R²=0,042) Significance 0,180 0,114 0,715 0,886 0,961 Coefficient -231873,5 0,102* 0,246*** 0,041 0,002 T value -0,447 1,855 4,430 0,735 0,032 Industrial firms (R²=0,070) Significance 0,655 0,065 0,000 0,463 0,975 Coefficient 214466,8** * 0,090*** 0,056* 0,045 0,069** T value 6,821 2,883 1,780 1,429 2,193 Service firms (R²=0,017) Significance 0,000 0,004 0,075 0,153 0,029
*** Correlation is significant at the 0.01 level, ** Correlation is significant at the 0.05 level, * Correlation is significant at the 0.10 level.
Summarizing, we found that especially the sales and manual workforce (the first two factors) are positively related to the value added. In addition it appears that none of the four factors significantly relates to the value added of agricultural firms but for the service related firms also agricultural purchases (factor 4) are relevant.
Factor scores
Now that we distinguished five factors that explain partly the variation in the characteristics of firms and now that we learned a little bit more about their contribution to success, it is time to try to find out whether these characteristics significantly differ between different kind of towns. For this reason we use the factor scores. We calculated mean values of the factor scores for four groups of towns; Dutch medium-sized, Dutch small, Portuguese medium-sized and Portuguese small towns (see Figure).
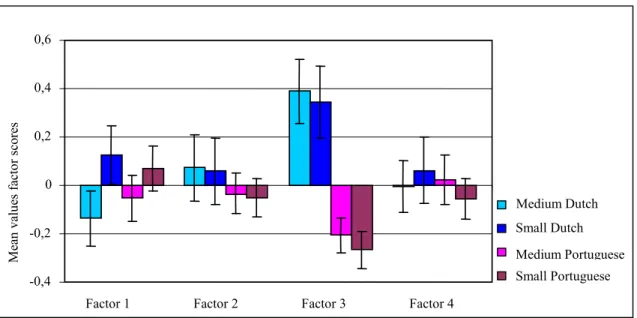
Figure 2;Mean values of the factor scores for four groups of towns with standard error-lines showing the significance of difference
Figure 2.Mean values of the factor scores for four groups of towns with standard error-lines showing the significance of difference
The standard error lines show us how significant the differences between the means are. From the figure it becomes clear that the average factor scores differ both between towns and between countries. The factor scores for the fourth factor (agricultural purchases) are not significantly different for firms in different countries or in differently sized towns.
A difference between small and medium sized towns appears with the first factor, dealing with the sales. The small towns have higher average scores for this factor, suggesting that firms in smaller towns are more oriented to the national and international market for their sales. This holds especially for the Dutch small towns. The negative mean value of the medium towns implies that they are more oriented towards the regional market. The two labour related factors, manual workforce and non-manual labour, differ more per country. Especially the third factor has high positive values for the Dutch towns and high negative values for the Portuguese towns. Thus in the Netherlands skilled manual labour is more important, whether in Portugal skilled non-manual labour is more noteworthy.
-0,4 -0,2 0 0,2 0,4 0,6 Medium Dutch Medium Portuguese Small Dutch Small Portuguese
Factor 1 Factor 2 Factor 3 Factor 4
M ea n v al u es f ac to r sc o re s
The next three figures (Figure 3, 4 and 5), show us the mean values of the factor scores, with the error bars according to the kind of sector of the firm. Because the database included only a limited number of Dutch agricultural firms we excluded them from this analysis.
Figure 3. Mean values of agricultural firms in four groups of towns, with error bars
-1 -0,5 0 0,5 1 1,5 2 Medium Dutch Medium Portuguese Small Dutch Small Portuguese
Factor 1 Factor 2 Factor 3 Factor 4
M ea n v al u es f ac to r sc o re s
Figure 4. Mean values of industrial firms, in four groups of towns, with error bars.
-1 -0,5 0 0,5 1 1,5 Medium Dutch Medium Portuguese Small Dutch Small Portuguese M ea n v al u es f ac to r sc o re s
Factor 1 Factor 2 Factor 3 Factor 4
Figure 5. Mean values of service related firms, in four groups of towns, with error bars
-0,6 -0,4 -0,2 0 0,2 0,4 0,6 M ea n v al u es f ac to r sc o re s Medium Dutch Medium Portuguese Small Dutch Small Portuguese
When looking at the three figures together, we see that the scores of factor three (non-manual labour) significantly differ per country. As mentioned before, the mean values are positive for Dutch firms and negative for Portuguese firms. This suggests that in the Netherlands skilled non-manual labour is more important, whether in Portugal non-skilled non-manual labour is more relevant1. Also factor four (agricultural purchases) shows different scores between Dutch and Portuguese firms, but only for service related firms. In the Netherlands it seems that the supra-local purchases for firms in these sectors are slightly more relevant. In Portugal, as the descriptives show, more products are sold on the local market.
The values of the first factor scores (sales) differ significantly between the small and medium-sized towns. These differences are most obvious for the Dutch towns. Small towns seem to be more oriented towards the national and international markets. This holds especially for the Portuguese industrial firms and Dutch service firms (in small towns). Firms in medium-sized towns are more oriented towards regional markets, this holds most for the Dutch towns.
The factor scores of the Portuguese agricultural firms are relatively uniform, except for the second factor, manual workforce. On average these scores are higher in smaller towns. In medium-sized towns the scores are negative, indicating non-manual workforce may be more important. The division of firms according to their sector provided us especially new insights in the second factor, manual workforce. The scores belonging to this factor are positive for industrial firms (manual labour and total FTE is essential for these kind of firms) but negative for service oriented firms (where possibly non-manual labour is more important). Furthermore these figures do not show significant differences between countries, whereas figure 2 (showing the mean factor scores of all firms together) suggests a small difference between the Netherlands and Portugal.
Conclusions
In this paper we compared the behaviour of firms in relation with the size of their home-town. The assumption is that differently sized towns have different functions in (rural) economy. Not only the size of the market differs, but also accessibility or the availability of facilities such as transport. This implies that networks of sales, purchases and labour are different for firms in differently sized towns. All these aspects affect the organisation and behaviour of the firm. Therefore we have selected characteristics of a set of 1450 firms, which tell something about their behaviour. The variables are related to purchases and sales (networks and markets) and to labour (organisation). We compared firms located in small towns (5.000-10.000 inhabitants) and medium–sized towns (15.000-20.000 inhabitants), in the Netherlands and in Portugal.
As expected, firms behave different in different countries. Apart from spatial varieties this is also a result from different national policies and strategies. The statistic descriptives show that, in general, Dutch firms are more oriented to the national market and Portuguese firms to the local and regional market. The differences in the use of labour are less clear. One dissimilarity is that in the Netherlands a larger share of employees works on a par time base. Furthermore the share of managers is much larger in Portugal, but the total share of skilled and non-skilled labour is the same!
The factor analysis reveals four factors, explaining 30% of the variance in the database. These factors are labelled as sales, manual workforce, non-manual labour and agricultural purchases. Particularly the third factor, non-manual labour, has different scores for Dutch and Portuguese firms. Especially firms in the service sector but also in the industrial sectors have positive scores when located in the Netherlands and negative scores in Portugal.
We also find differences in the behaviour of firms related to the size of the town. In both countries, the firms in small towns buy the largest shares of products on the national market (compared to the medium towns). These differences are quite large. They can be explained with help of the central place theory; medium-sized towns have a larger local market and are better able to buy and sell products nearby, whereas small towns have to obtain their input from a ‘central’ place, further away. Surprisingly, the labour characteristics of small and medium-sized towns do not seem to be significantly different. The factor analysis confirms these findings; no significant differences are found for the two labour related factors (only the agricultural firms in Portugal have different scores for the manual workforce). But the sales of firms (the first factor) seem to be affected by the size of the town. Small towns seem to be more oriented towards the national and international markets. This holds
1
We have to keep in mind that the variable ‘share of management’ had to be excluded from the analysis and that in Portugal a large share of the workforce is titled as manager. In a future analysis the skilled non-manual labour and management variable could possibly be combined.
especially for the Portuguese industrial firms and Dutch service firms (in small towns). Firms in medium-sized towns are more oriented towards regional markets.
Thus, as a result from this analysis, we conclude that the size of the town affects the behaviour of firms. Small towns are more oriented towards the national market and medium-sized towns to the regional market. Surprisingly, the labour characteristics of firms in small and medium-sized towns do not seem to be significantly different.
References
Camagni, R. (1991). Innovation Networks: Spatial Perspectives. Belhaven Press, London.
Christaller, W. (1933). Die Zentralen Orte in Süddeutschland, Fischer, Jena, translated by C.W. Baskin (1966), Central Places in Southern Germany, Prentice-Hall, Englewood-Cliffs.
Courtney, P. and A. Errington (2000). The Role of Small Towns in the Local Economy and Some Implications for Development Policy. Local Economy, 15 (4) 280-301.
Fujita, M., P. Krugman and A.J. Venables (1999). The Spatial Economy: cities, regions and international trade. MIT Press, Cambridge
Klemmer, P. (1978). Methods for the Determination of Centrality. In: Funck R. and J.B. Parr (eds.), The Analysis of regional structure: essays in honour of August Lösch. Pion Limited, Londen.
Lambooy, J. G., E. Wever and O.A.L.C. Atzema (1997). Ruimtelijke Economische Dynamiek: een inleiding in de theorethische aspecten van de economische georafie. [Spatial Economic Dynamics]. Coutinho, Bussum, Mc Dermott, P. and M. Taylor (1982). Industrial organisation and location. University Press, Cambridge. Robinson, G.M. (1990). Conflict and change in the countryside: rural society, economy and planning in the developed world. Belhaven Press, London.
Nijkamp, P. (2004). Innovation, space and economic development. Elgar, Cheltenham.
Noronha Vaz, T, de, J de Viaene, M. Wigier (2004). Innovation in small Firms and Dynamics of Local Development. Scholar Publishing House, Warsaw.
Tödtling, F. (1995). The innovation process and local environment. In: S. Conti, E. J. Malecki and P. Oinas (eds.), The industrial enterprise and its environment: spatial perspectives. Aldershot, Avebury.
Appendix I: Correlation between factor scores and sector dummies. Pearson
Correlation
N=1404 Factor 1 Factor 2 Factor 3 Factor 4
Agriculture -,002 -,029 -,056(*) ,209(**) Sig. (2-tailed) ,935 ,278 ,034 ,000 Manufacturin g ,049 ,296(**) ,015 ,059(*) ,068 ,000 ,574 ,026 Construction -,083(**) ,350(**) ,094(**) -,046 ,002 ,000 ,000 ,088 Wholesale ,062(*) -,099(**) ,130(**) ,056(*) ,021 ,000 ,000 ,037 Retail -,096(**) -,199(**) -,285(**) -,073(**) ,000 ,000 ,000 ,007 Hotel and restaurant ,085(**) -,081(**) -,186(**) -,050 ,001 ,002 ,000 ,060 Transport -,010 ,125(**) ,042 -,007 ,709 ,000 ,117 ,806 Banking ,035 -,159(**) ,160(**) -,023 ,190 ,000 ,000 ,396 Public administratio n -,011 -,024 ,025 ,002 ,680 ,371 ,350 ,943 Recreation -,048 -,033 -,007 -,019 ,074 ,215 ,784 ,488 Real estate ,074(**) -,101(**) ,288(**) -,005 ,005 ,000 ,000 ,861
** Correlation is significant at the 0.01 level (2-tailed). * Correlation is significant at the 0.05 level (2-tailed).