Development and valida on of the first brazilian
french-based asphalt mix complex modulus and
fa gue test apparatus
Breno Barra1, Leto Momm2, Yader Guerrero3, Yves Brosseaud4, Gustavo Momm5 1Post-Gradua on Program in Engineering and Mechanical Sciences, UFSC, Joinville, Brasil, [email protected] 2Post-Gradua on Program in Engineering and Mechanical Sciences, UFSC, Joinville, Brasil, [email protected] 3Post-Gradua on Program in Engineering and Mechanical Sciences, UFSC, Joinville, Brasil, [email protected]
4Ins tut Français des Technologies des Transports, de l’Aménagement et des Réseaux, Nantes, France yves.brosseaud@ifs:ar.fr 5Petróleo Brasileiro S.A. – Petrobrás, Device Engineering Department, Santos, Brasil, [email protected]
Recebido:
4 de janeiro de 2019
Aceito para publicação:
9 de maio de 2019
Publicado:
15 de maio de 2020
Editor de área:
Francisco Thiago Aragão
ABSTRACT
The main aim of this paper is to present the development and valida on procedures of the first brazilian french-based asphalt mix complex modulus and fa gue test apparatus, so-called FADECOM, in order to demonstrate the effec ve applica on of the results ob-tained in pavement design procedures. Magne c sensi ve Hall Effect non-contact cap-tors determine amplitude displacement, while loading cells capture force amplitude by a diaphragm system. Independent cooling and hea ng chambers assure a precise tem-perature control comprising a range from -30ºC to above 100ºC with an accuracy of 0.1ºC. A frequency inverter controls the emission of pulses usually set from 1Hz to 30Hz. For valida ng the apparatus, a scien fic coopera on agreement was dealt with French Ins tute of Transporta on Sciences and Technologies, Development and Road Network (IFSTTAR), in which specimen samples were tested in both UFSC and IFSTTAR laborato-ries. The crossed-results obtained indicate an excellent performance and accuracy of FADECOM apparatus, presen ng varia ons around just 3 microstrains in determining fa gue strains at 106 cycles (ε
6) and less than 10% related to the complex s ffness mod-ulus, demonstra ng huge accuracy of the FADECOM apparatus and its prac cal feasibi-lity to be applied in pavement design procedures, based on the technical principles of French methodology. Keywords: Valida on, Complex Modulus, Fa gue, Test Apparatus. DOI:10.14295/transportes.v28i2.1927
1. INTRODUCTION
Understanding rheological-mechanical properties of asphalt mixes at different temperatures and loading frequencies is essential, due to in luence they exert directly on the linear viscoelas-tic behavior of these materials (Barra, 2009; Momm, 1998; Sayegh, 1965; Huet, 1963).
The constant need of formulating asphalt mixes able to support the growing, continuous and intense loading axle levels of the traf ic leet worldwide, have been leading to research the effect of high consistent asphalt binders in increasing the stiffness dynamic (or complex) modulus and resistance to fatigue, which is the main phenomenon responsible for the rupture of pavement structures in the ield (Barra et al., 2016; Barra et al., 2012; Domec, 2005; Rudensky, 1997).
French methodology was chosen to be a reference, due to present a scienti ic, of icially pub-lished and proven close ield-laboratory rate (Manuel LCP, 2007; AFNOR NF EN 12697-24, 2012; AFNOR NF EN 12697-26, 2012), giving strong credibility to the results obtained.
Considering the above-mentioned principles, the irst french-based dynamic stiffness mod-ulus and fatigue test apparatus, so-called FADECOM, has been conceived by the Pavement Re-search and Development Group (GDPPav), pertained to Federal University of Santa Catarina, Campus UFSC/Joinville, endeavoring for more than a decade in continuous researches on phys-ical and mathematphys-ical models, as well as on numerphys-ical simulations, taking into account princi-pally the technical principles of French pavement design methodology, as demonstrate ahead in this manuscript.
Among particular and notable characteristics of the apparatus are its easy portability, despite have a robust and stable stainless steel framework, the capability to carry out complex stiffness modulus and/or fatigue tests with four trapezoidal specimens simultaneously, in continuous mode with displacement amplitude control and generation of sinusoidal loading and displace-ment signals.
Furthermore, it consists in the irst scienti ic initiative outside France to propose a project capable to carry out dynamic (complex) stiffness modulus and fatigue tests in the same appa-ratus, using trapezoidal specimens tested in continuous mode and with displacement amplitude control, also able to perform both mentioned tests under environmental conditioning states, i.e., in wet and dry situations.
2. Technical charateris0cs of the apparatus
FADECOM apparatus has a solid stainless steel base, which supports a climatic chamber made of polyurethane. The temperature inside this chamber is adjusted by an automatic digital con-troller that commands two distinct climatic systems: one for heating and another for freezing. Hence, when one of these systems is being adjusted for operation, the other is deactivated au-tomatically, thus guaranteeing the desired temperature for the tests.
With this automatic digital controller commanding both climatic systems, it is possible to carry out tests with temperatures ranging from -30ºC to higher than 100ºC. The temperature set during the tests is supplied by 9 thermocouples placed at different points into the chamber with an accuracy of 0.1ºC.
A frequency inverter is responsible for adjusting the frequency of the tests, which commands a 6-pole induction motor connected to two eccentric axles. The rotational movement of the eccentric axles generates a force that is transmitted gradually to a set of interlocking pieces until reach the oscillator rods connected to the specimens (Figure 1).
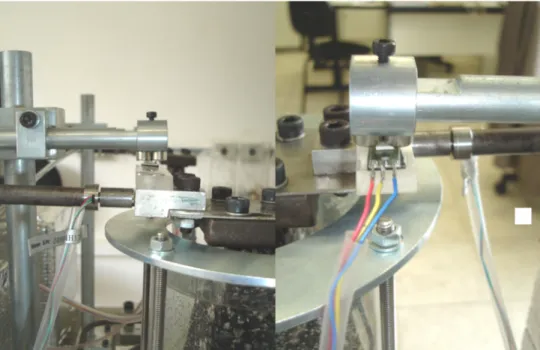
The force transmitted gradually to the oscillator rods applies a back and forth displacement in the top part of the specimens, which generates a sinusoidal loading signal, i.e., alternating lexion effort. The loading and displacement signals are captured simultaneously by loading cells and Hall effect sensors, respectively (Figure 2).
It is also possible to perform complex modulus and fatigue tests under conditioning states, sim-ulating alternated or continuous wet and dry environmental situations, submitting the trape-zoidal specimens to a prior saturation process into water using a vacuum pomp pressure of 350.0 mm/Hg ± 5.0% immediately before the beginning of the tests, in order to achieve a given
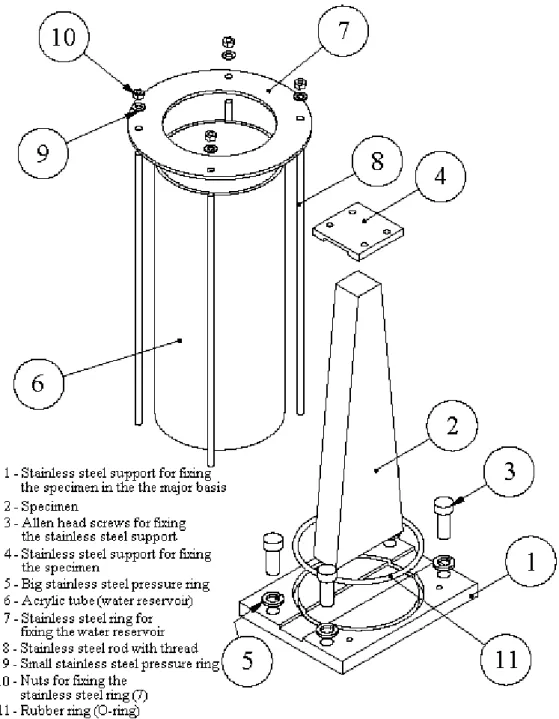
saturation degree of the air void content of each specimen. After this pre-conditioning stage, the specimens are immersed into water during the tests, in an apparatus speci ically designed for the placement of the water reservoirs (Figure 3).
Figure 1. Set of Pieces Involved in the Test Procedures
Figure 3. Overview of the environmental conditioning apparatus
A data acquisition system captures the electrical pulses sent by the loading cells and by the Hall effect sensors with a sample frequency of 640 Hz. A computerized terminal programmed in a platform language C++ converts these pulses into values of force and displacement to a
graphical interface in Excel sheet in real time, as for complex modulus (Figure 4) as for fatigue tests (Figure 5).
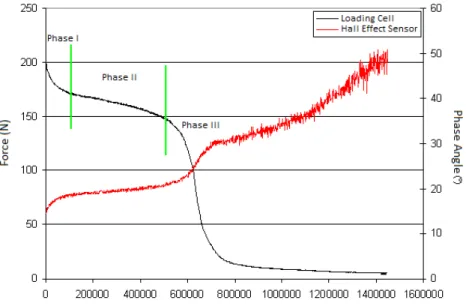
It is important to emphasize the sharpness of the signals captured by the loading cells and Hall effect sensors (Figures 4 and 5), demonstrated through good de inition of the curves, with low noise level, guaranteeing suitable accuracy of the measurements carried out.
However, it is perceivable the increase of the noise level in phase III of the fatigue tests (Figure 5), taking into account Hall effect sensor responses, because at this stage the specimens have reached the structural collapse, in which the displacement amplitude control becomes dis-ordered within the magnetic spectrum of the referred sensors.
Figure 4. Displacement and force amplitudes captured by the loading cells and Hall Effect sensors, evidencing the phase
angle (ϕ) during complex modulus tests
Figure 5. Evolution of the Force and Phase Angle (ϕ) captured by the loading cells and Hall Effect sensors during fatigue tests
3. VALIDATION PROCESS
In order to establish the accuracy of the tests carried out by FADECOM apparatus, a scienti ic cooperation agreement was signed in 2015 and renewed in 2017 between GDPPav, represent-ing UFSC, and IFSTTAR, from Nantes, France, to compare the results obtained by both research centres taking into account a laboratory campaign considering dynamic (complex) stiffness modulus and fatigue crossed-tests.
High modulus asphalt class 2 (EME2) mix with 0/12.7mm granitic crushed rock gradation and use of asphalt binder penetration 10/20 (0.1mm) was chosen to be tested. All trapezoidal specimens were produced in GDPPav laboratory premises, in order to avoid scattered proce-dures and to keep the homogeneity of the samples.
The planning of the tests followed the standardized French speci ications (Manuel LPC, 2007; AFNOR NF EN 12697-24, 2012), which determine that at least 18 specimens (distributed equally among 3 different strain levels of evaluation) must be tested in a laboratory campaign on the fatigue behavior of a given asphalt mix and at least 4 specimens for carrying out complex modulus tests (AFNOR NF EN 12697-26, 2012). They were carried out tests just in dry state.
In this particular research, 2 sets of 24 specimens were selected, distributed into 3 subsets of 8 units to be tested at each strain level for the fatigue tests, as well as 2 sets of 4 specimens for the complex modulus tests provided by the same asphalt mix slab.
However, to validate each set of specimens to be tested, they must comply with the limits de ined by the rigorous statistical criteria of the standardized speci ications. These criteria are the variation coef icient (≤1.0%), which is based on the results for the constant Kε related to the
geometric dimensions of each specimen, de ined in Equation 1, and the standard deviation (≤0.5) concerning the air void content of each set of specimens. If any specimen does not obey one of these criteria, it must be rejected before the beginning of the test and replaced by another suitable unit. + − − − = b B ln 2B b) b).(3B (B . 8.b.h b) (B K 2 2 2 ε
where Kε: constant related to the geometric dimensions of the specimens [mm-1];
h: is the height of the specimen [mm];
b: is the small base of the specimen [mm]; and
B: is the large base of the specimen [mm].
The displacement amplitude applied by the oscillator rods on the small base of the trapezoi-dal specimens is calculated through Equation 2, which is related to each strain level chosen ar-bitrarily by the designer.
ε max
K
ε
f
=
; being the displacement amplitude calculated by A=2.fwhere f: the half displacement amplitude applied to the small base of the specimen [x10-6];
Kε: constant related to the geometric values of the specimens [mm-1];
εmax: maximum strain level correspondent to a given displacement
amplitude [x10-6];
A: peak to peak displacement amplitude applied to the small base of the specimen [x10-6].
It must be remarked that 10-6 is the scienti ic notation for microstrains (µdef).
For fatigue tests, the adjustment of the displacement amplitude values calculated through Equation 2 (Table 1) was measured with an accuracy of 1.0 µm, using an analogical extensom-eter, which was placed on the top of the small base of the specimens.
For all complex modulus tests, the displacement amplitude was calculated using the same procedure considered for fatigue tests, but ixed at 40 x 10-6, respecting the standardized max-imum limit of 50 x 10-6 (AFNOR NF EN 12697-26, 2012). Besides, frequencies of 1Hz, 3Hz, 10Hz and 30Hz were applied. For each frequency, temperatures of -10ºC, 0ºC, 10ºC, 15ºC, 20ºC, 30ºC, 40ºC and 50ºC were simulated. The displacement amplitudes were gradually regulated by two Allen head screws connected to each eccentric axle (indication 2 in Figure 1).
As a result of this laboratory campaign, Figure 6 presents the rheological behavior of the dynamic stiffness modulus represented in complex plan so-called Cole-Cole, comprising its real (E1) and imaginary (E2) components, while Figure 7 presents the fatigue resistance tests.
(1)
Table 1 – Strain levels chosen for fatigue tests and air void content of the asphalt mixes
Asphalt Mix Temperature of Test
Strain Level (x10-6) Air Void Content (%) Sets of Specimens
8 8 8
10/20 10ºC 120 135 150 4.2
10/20 30ºC 95 115 135 4.3
Figure 6. Rheological behavior of the asphalt mix in complex plan Cole-Cole
Figure 7. Fatigue curves from tests carried out at 10ºC and 25Hz, and at 30ºC and 25Hz
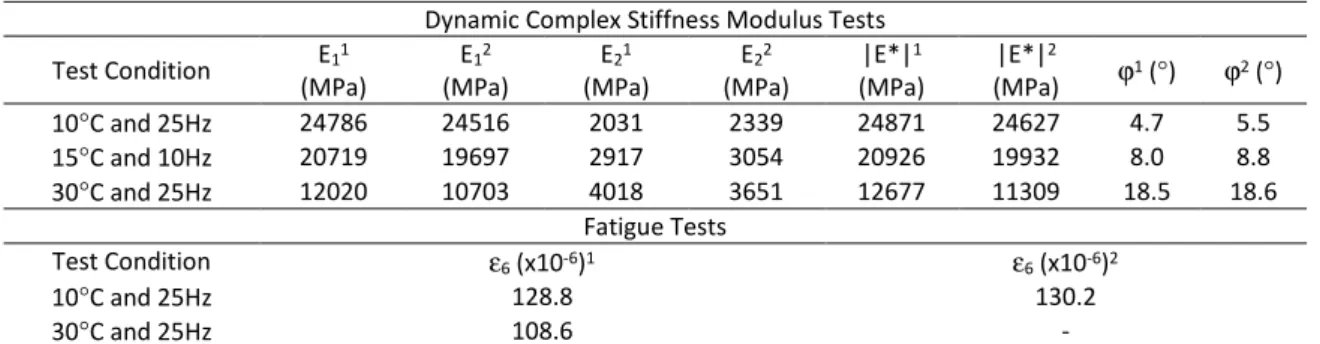
Table 2 summarizes the results obtained by the FADECOM and IFSTTAR apparatuses. Table 2 – Strain levels chosen for fatigue tests and air void content of the asphalt mixes
Dynamic Complex Stiffness Modulus Tests Test Condition E1 1 (MPa) E12 (MPa) E21 (MPa) E22 (MPa) |E*|1 (MPa) |E*|2 (MPa) ϕ1 (°) ϕ2 (°) 10°C and 25Hz 24786 24516 2031 2339 24871 24627 4.7 5.5 15°C and 10Hz 20719 19697 2917 3054 20926 19932 8.0 8.8 30°C and 25Hz 12020 10703 4018 3651 12677 11309 18.5 18.6 Fatigue Tests Test Condition ε6 (x10-6)1 ε6 (x10-6)2 10°C and 25Hz 128.8 130.2 30°C and 25Hz 108.6 -
4. CALCULUS OF THE ADMISSIBLE STRAIN
The results obtained in laboratory, more speci ically those of complex modulus and fatigue tests, are directly inserted in numerical simulations by using Huet-Sayegh rheological model (Figure 8, Equation3), as well as in the admissible strain calculus (Equation 4), with support of the computerized tools Viscoanalyse Ver. Beta and Viscoroute 2.0, considering cyclic loading applications.
Figure 8. Huet-Sayegh rheological model
h k 0 0 1 δ( ) ( ) E E E ) ( * E ∞− − + + − + = ωτ ωτ ω i i
where i: complex number de ined by i2 = -1, which indicates the imaginary
component of the complex modulus;
E∞: instantaneous modulus, obtained when ωτ tends to the in inite,
considering higher frequencies and lower temperatures in loading application conditions;
E0: static modulus, considering lower frequencies and higher temperatures
in loading application conditions; ‘τ’ concerns the relaxation time of the bumpers ‘h’ and ‘k’, thus, a parameter dependent of the time and resembling to a delay time, in which the value varies with the temperature τ = exp(A0 + A1.θ + A2. θ2), being θ the temperature and A0,
A1 and A2 constants determined experimentally;
h and k: parabolic elements of the model, where for asphalt mixes they comprise the range 0 < k < h < 1;
δ: dimensionless constant, which depends on the asphalt binder nature and on the aggregate gradation curve; and ω = 2πf, being f = loading application frequency (pulsation).
c s r b 6 0,5 eq 6
eq,f) ε (10ºC,25Hz).[E*(10ºC)/E*(θ )] .(NE/10 ) .k .k .k
θ
ε(NE, =
Where ε(NE, θeq, f): admissible strain of the asphalt mix regarding a given number
of loading cycles (NE), equivalent temperature (θeq)
and loading frequency (f);
ε6(θ, f): strain level at 106 cycles at a given temperature (θ) and
loading frequency (f), considered as 10ºC and 25Hz, respectively, in France;
(NE/106)b: number of loading cycles predicted to be applicated on the
(3)
asphalt mix during its service life, in relation to the standard criterion of 106 cycles and the slope ‘b’ concerning the fatigue
tests;
[E*(θ)/E*(θeq)]0,5: square root between complex moduli determined at a given
temperature (θ) and at a temperature considered as equivalent (θeq, 15ºC in France);
kr, ks, kc: failure risk, heterogeneity minority and adjust coef icients,
respectively (Equations 5 and 6).
ubδ 10 r k = − 0,5 2 2 2 2 (c /b )Sh ] [SN δ= +
where kr: failure risk coef icient;
δ: standard deviation associated to SN, b, Sh e c;
SN: standard deviation regarding the number of cycles supported by the
asphalt mix during fatigue tests log(N);
u: statistical factor (fractile) of the normal series associated to the assumed risk (logN/N50%);
b: fatigue exponent slope;
Sh: standard deviation concerning the thickness layer all over the pavement structure;
c: coef icient which correlates the strain (or strength) variation in the
pavement structure to alleatory thickness variation ∆h (logε = logε0-c.∆h), in which for ordinary pavement structures is
assumed as 0,02cm-1.
The parameters for de ining the fractile ‘u’ associated to a given percent of failure risk assu-med, as well as ‘Sh’, ‘ks’ and ‘kc’ are presented in Tables 3, 4, 5 and 6, respectively.
It is important to clarify that for calculating the admissible strain at 106 loading cycles ‘ε(NE,
θeq, f)’ with use of Equation 4, French design methodology considers negligible the direct
co-rrespondence between ield measurements taken normally at 10Hz in the bottom of the ield asphalt concrete layers and those determined at 25Hz in laboratory tests, taking into account usual temperatures of service (Guide Tecnhique, 1997).
Table 3 – Percent of failure risk assumed for asphalt concrete pavement structures regarding the fractile ‘u’ (Guide
Technique, 1997)
Fractile (u) -0,84 -1,04 -1,28 -1,65 -2,05
Risk (%) 20 15 10 5 2
Table 4 – Sh’ values assumed for asphalt concrete pavement structures regarding the entire bituminous thickness
de-signed (Guide Technique, 1997)
Stiffness Modulus (E) E < 50 MPa 50 MPa ≤ E < 120 MPa E ≥ 120 MPa
Ks 1/1.2 1/1.1 1
(5) (6)
Table 5 – Values assumed for the coefficient ‘ks’ (Guide Technique, 1997) Thickness (cm) e ≤ 10 10 < e < 15 15 ≤ e
Sh (cm) 1 1 + 0,3(e-10) 2,5
Table 6 – Values assumed for the coefficient ‘kc’ (Guide Technique, 1997)
Material kc
Road base asphalt concrete (GB) 1.3
Bituminous concrete (BB) 1.1
High modulus asphalt concrete (EME) 1.0
However, the coef icient ‘kc’ is predicted in the above-mentioned Equation 4, in order to adjust the mathematical model used in laboratory to the mechanical behavior evaluated in the
ield, since true-scale pavement section tests, which have been carried out over three decades with a fatigue carroussel framework, being responsible to assure a narrow ield/laboratory ra-tio (Table 6), thus, adjusting eventual scatters between measurements realized at 10Hz and at 25Hz (El Abd, 2006).
These technical procedures allowed determining the viscoelastic linear parameters and me-chanical behavior in pavement structure design regarding the asphalt mix tested.
5. NUMERICAL SIMULATIONS ON DESIGNING PAVEMENT STRUCTURE
For simulating the mechanical behavior of the asphalt mix formulated in this research (EME2), a pavement structure was designed based on French methodology concepts (Guide Technique, 1997) according to the following technical parameters: annual average daily traf ic low (MJA) of 6.000 heavy trucks (class TC8) with 130kN double-wheeling standard single axle load each, applying cyclic loadings at 72km/h.
A cumulative traf ic (NE) of 8.34 x 10⁷ was predicted to be supported along 30 years, con-sidering 15% of failure risk (kr = 0.887 at 10Q C and 25Hz), besides 1/1.1 related to heteroge-neity minority (ks) and 1.0 to adjust (kc) coef icients mentioned earlier in section 4.
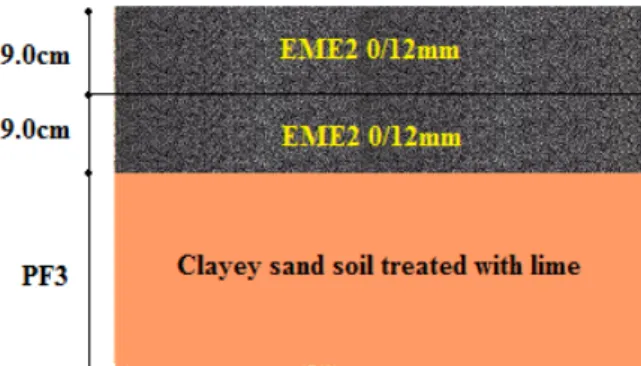
They were considered a foundation platform from class 3 (PF3) with a stiffness modulus of 100MPa and 30.0cm of subgrade reinforcement layer in soil treated with lime, while sub-base and base layers with high modulus asphalt mix or also so-called Enrobé Bitumineux à Module ETlevé class 2 (EME2), taking into account the formulation tested in the experimental campaign carried out and described in earlier sections. For EME2, thickness layers from 9.0cm to 13.0cm were simulated following standardized recommendations (Catalogue LCPC/SETRA, 1998).
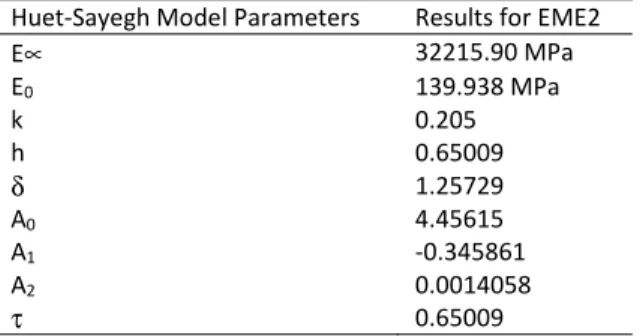
Table 7 – Rheological Parameters from Huet-Sayegh model for EME2
Huet-Sayegh Model Parameters Results for EME2
E∝ 32215.90 MPa E0 139.938 MPa k 0.205 h 0.65009 δ 1.25729 A0 4.45615 A1 -0.345861 A2 0.0014058 τ 0.65009
Rheological parameters of the asphalt mix EME2 were determined with use of Huet-Sayegh viscoelastic linear model (Eq. 3) simulated in the computerized tool so-called Viscoanalyse Ver. Beta (Table 7), considering results from complex modulus tests presented in Figure 4 and Table 2. Complex modulus and fatigue test results used in the numerical simulations are compiled in Table 8.
Table 8 – Complex Modulus and Fatigue Test Results for EME2.
Test Condition Complex Modulus Fatigue
|E*| (MPa) ε6 (x 10-6) SN 1/b
10°C e 10Hz 23612 - - -
15°C e 10Hz 20926 - - -
10°C e 25Hz - 128.8 0.039 0.14
Furthermore, according to Guide Tecnhique (1997), when it is being designed an asphalt concrete pavement structure able to support heavy traf ic lows, it must be evaluated not only the admissible tensile strain in the bottom of the deepest asphalt layer ‘ε(NE,θeq, f)’ calculated
by Equation 4, but also the admissible vertical compression strain ‘εz,ad’ on the top of the
foundation platform (PF), as de ined in Equation 7.
0,222 ad
z, 0,012(NE)
ε = −
where εz,ad: admissible vertical compression strain on the top of the foundation
platform (PF);
NE: cumulative traf ic concerning 130kN standard double-wheeling single axle load.
The development of numerical simulations interacting Huet-Sayegh rheological linear viscoelastic model and mechanical behavior at cyclic loading applications on the designed pavement structure was carried out with use of computerized tool so-called Viscoroute 2.0, in which the results are presented in Table 9 and illustrated in Figure 9.
Figure 8. Huet-Sayegh rheological model
The results presented in Table 9 indicate numerical simulation routine values of ‘εt’ and ‘εz’
minor than the admissible calculated limits ‘ε(NE,θeq,f)’ and ‘εz,ad’, considering initial asphalt
la-yer thicknesses of 9.0cm, as well as complex modulus ratio ‘[E*(θ)/E*(θeq)]0,5’ with E*(θ) = 10ºC
and E*(θeq) = 15ºC, both determined at 10Hz, and fatigue ‘ε6’ obtained at 10ºC and 25Hz, thus,
being in accordance to French traditional pavement design standard principles predicted in Guide Technique (1997).
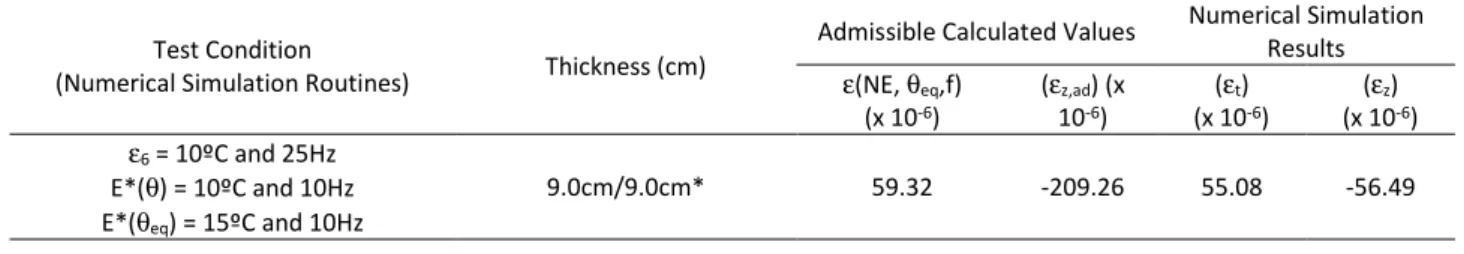
Table 9 – Results obtained in numerical simulations
Test Condition
(Numerical Simulation Routines) Thickness (cm)
Admissible Calculated Values Numerical Simulation Results ε(NE, θeq,f) (x 10-6) (εz,ad) (x 10-6) (εt) (x 10-6) (εz) (x 10-6) ε6 = 10ºC and 25Hz E*(θ) = 10ºC and 10Hz E*(θeq) = 15ºC and 10Hz 9.0cm/9.0cm* 59.32 -209.26 55.08 -56.49 Legend:
*Thickness (cm) in order: base/sub-base asphalt layers (2 layers).
εt: tensile strain in the bottom of the deepest asphalt layer.
ε(NE,θeq,f): admissible tensile strain in the bottom of the deepest asphalt layer calculated with use of Equation 3.
εz: compression strain on the top of the platform foundation.
εz, ad: admissible compression strain on the top of the platform foundation, calculated with use of Equation 4.
Sign convention of Viscoroute 2.0: (+) tensile and (-) compression.
4. CONCLUSIONS
Analyzing data presented in this research, it is possible to infer that the scattering of results is less than 5.0% for dynamic (complex) stiffness modulus (|E*|), less than 1.0% for phase angle (º) and 1.0% maximum for fatigue strain at 106 loading cycles (ε6), when compared the values
determined by the FADECOM and IFSTTAR apparatuses. These trends are strongly lower than the standard deviation tolerances established by the French methodology, i.e., around 10% maximum for stiffness modulus and 3.0 (x10-6) for ε6 (x10-6), demonstrating huge accuracy of
the FADECOM apparatus and its feasibility to be applied in pavement design researches. Furthermore, it was demonstrated that from a suitably validated apparatus, such as FADE-COM, it can be concluded that French pavement design methodology presents a versatile aspect, because it can be adaptated to the actual context of other regions or countries worldwide, even in South America, for instance, since the appropriated particular parameters related to each place be researched and inserted correctly in the constitutive equations presented, taking into account a narrow ield/laboratory rate, followed up by true-scale tests and deep knowledge on the mechanical and rheological behaviours of local materials.
ACKNOWLEDGEMENTS
We would like to thank to the Institut Français des Sciences et Technologies des Transports, de l’Aménagement et des Réseaux (IFSTTAR) from Nantes, France, by the continuous scienti ic cooperation agreement with our Group of Research and Develop-ment in PaveDevelop-ment (GDPPav), to Petrobrás for inancing the project concerning the developDevelop-ment of FADECOM apparatus (Coop-eration Agreement 0050.0075479.12.9 and SAP nº4600373381), as well as to Gustavo Momm by the decisive collaboration along the mechanical and logical conception of the FADECOM apparatus.
REFERENCES
AFNOR NF EN 12697-24 (2012) Mélanges Bitumineux: Méthode d’ETssai pour Mélange Hydrocarboné à Chaud - Partie 24: Essai par Flexion à Flèche Constante. 32p. Association Française de Normalisation. France.
AFNOR NF EN 12697-26 (2012) Mélanges Bitumineux: Méthode d’ETssai pour Mélange Hydrocarboné à Chaud - Partie 26: Module de Rigidité. 40p. Association Française de Normalisation. France.
Barra, B.; Momm, L.; Guerrero, Y.; Al-Qureshi, H. A.; Mikowski, A.; Michels, R. (2016) Temperature implications on rheological-mechanical behavior and design of high modulus dense asphalt mix. Construction & Building Materials, v. 125, p. 135-144, 2016. DOI: 10.1016/j.conbuildmat.2016.08.037.
Barra, B.; Momm, L.; Guerrero, Y.; Bernucci, L. L. B. (2012) Fatigue Behavior of Dense Asphalt Mixes in Dry and Environmental-Conditioning States. Construction & Building Materials, v. 29, p. 128-134. DOI: 10.1016/j.conbuildmat.2011.10.003. Barra, B. (2009) Avaliação da Ação da ATgua no Módulo Complexo e na Fadiga de Misturas Asfálticas Densas. PhD Thesis
Catalogue LCPC/SETRA (1994) Catalogue des Structures Types de Chaussées Neuves: Réseau Routière National. Laboratoire Central des Ponts et Chaussées (LCPC) en partenariat avec le Service d’ETtude Technique des Routes et Autoroutes (SETRA). Paris, France.
Domec, V. (2005) Endommagement par fatigue des enrobés bitumineux em condition de tra ic simulé et de température. Thèse de Docteur. Université de Bordeaux I. 426p.
Guide Technique (1997), French Design Manual for Pavement Structures (English Version). Published by Service d’ETtudes Techniques des Routes et Autoroutes (SETRA) and Laboratoire Central des Ponts et Chaussées (LCPC), 248 p. Paris, France.
Huet, C. (1963) ETtude par une méthode d’impédance du comportement viscoélastique des materiaux hydrocarbonés. Thèse de Docteur. Faculté des Sciences de l’Université de Paris. 58p.
Manuel LPC (2007) Manuel LPC d’aide à la formulation des enrobés. Groupe de Travail RST “Formulation des enrobés”. 320p. Laboratoire Central des Ponts et Chaussées. Paris, France.
Momm, L. (1998) Estudo dos Efeitos da Granulometria Sobre a Macrotextura Super icial do Concreto Asfáltico e Seu Compor-tamento Mecânico. PhD Thesis presented to Polytecnhical School of University of São Paulo (USP), 357p.
Rudensky, A. V. (1997) Asphalt concrete fatigue properties, in Proceedings of the 5th International RILEM Symposium. Me-chanical Tests for Bituminous Materials (MBTM): Recent Improvements and Future Prospects. Lyon, France, pp. 1058-1066.
Sayegh, G. (1965) Contribution à l’étude des propriètés viscoélastiques des bitumes purs et des bétons bitumineux. Thèse de Docteur Ingénieur. Faculté des Sciences de Paris. 206p.