2016
Assessment of the environmental impact of yeast waste
application to soil: an integrated approach
Ricardo Manuel Reis da Mata
Dissertation to obtain a master’s degree in
Environmental Engineering
Supervisor: Dr. David Paulo Fangueiro
Jury:
President: Dr. Elizabeth da Costa Neves Fernandes de Almeida Duarte, Professora Catedrática do Instituto Superior de Agronomia da Universidade de Lisboa
Examinators: Dr. David Paulo Fangueiro, Professor Auxiliar do Instituto Superior de Agronomia da Universidade de Lisboa
Dr. Rita do Amaral Fragoso, Professora Auxiliar do Instituto Superior de Agronomia da Universidade de Lisboa
i The intersection of Science and Art creates world wonders Ricardo Reis
iii Abstract
The yeast production industry (e.g. distillery, brewing, baking industries) has been growing globally over the last years generating a large amount of sub-products. Laboratory experiments, under controlled conditions, were performed to investigate the impact of yeast waste application to a sandy texture soil. Experimental treatments were: surface application of yeast and yeast (CMSs and CMSds), surface application of yeast and decanted-yeast followed by incorporation in the 0-5 cm soil layer (CMSm and CMSdm), surface application of ammonium nitrate (AN) (not applied in short-term experiment) and a control (soil only) (CTR). The amount of yeast applied was 2 g in the short-term experiment and equivalent to 170 kgN.ha-1 in the long-term experiment. A short-term (38-day period) leaching experiment
was performed with 5 weekly irrigation events (5 treatments × 3 replications) to assess N, P, K losses. Results showed that yeast application increased NH4+, PT and KT leaching relative
to control while decreased NO3- leaching relative to a high initial content of control, during first
irrigation events. Incorporation treatments increased NH4+, NO3- and PT losses earlier. KT
losses were higher in surface treatments. A long-term leaching experiment (73-day period) with 6 irrigation events every two weeks was then performed (6 treatments × 4 replicates) to assess N, P losses. A two parallel incubation experiment (6 treatments × 3 replicates) were simultaneously performed to measure GHG emissions (CO2, N2O, CH4) and to assess the N
mineralization in each treatment. Results showed that yeast application increased initial NH4+
concentration in leachates and soil relative to control and NO3- increased afterwards. N2O and
CO2 increased significantly relative to control on the first days after yeast application. AN
treatment emissions were very similar to control but had a small increase of N2O. CH4
emissions were insignificant. The global warming potential (GWP) of yeast and AN were 6× and 2× times higher than control, respectively.
iv Resumo
A indústria de produção da levedura (ex. indústrias de distilaria, cervejeira, panificação) tem vindo a aumentar globalmente nos últimos anos generando grandes quantidades de sub-produtos. Experiências laboratorais, sob condições controladas, foram realizadas para investigar o impacte da aplicação do resíduo de leveduras num solo arenoso. Os tratamentos experimentais foram: A aplicação à superfície da levedura e levedura-decantada (CMSs e CMSds), a aplicação à superfície da levedura e levedura-decantada seguida da incorporação na camada 0-5 cm (CMSm e CMSdm), a aplicação à superfície de NH4NO3 (AN) (não aplicado
na lixiviação curta-duração) e o controlo (CTR) sem aplicação. A quantidade de levedura aplicada foi 2 g (experiência de curta-duração) e 170 kgN.ha-1 (experiência de longa-duração).
Uma lixiviação de curta-duração (durante 38 dias) com 5 eventos de irrigação semanalmente foi realizada (5 tratamentos × 3 réplicas) para avaliar as perdas de N, P, K. Os resultados demonstraram que a aplicação da levedura aumentou a lixiviação de NH4+, PT e KT
relativamente ao controlo enquanto o NO3- desceu relativamente à elevada quantidade inicial
no controlo, durante os primeiros eventos de irrigação. Os tratamentos com incorporação aumentaram prematuramente as perdas de NH4+, NO3- e PT. Os tratamentos à superfície
aumentara as perdas de KT. Uma lixiviação de longa-duração (durante 73 dias) com 6 eventos
de irrigação de duas em duas semanas (6 tratamentos × 4 réplicas) para avaliar as perdas de N, P. Uma experiência paralela de incubação (6 tratamentos × 3 réplicas) foi simultaneamente feita para medir os GEE emitidos (CO2, N2O, CH4). Outra incubação (6 tratamentos × 3
réplicas) foi realizada para avaliar a mineralização do azoto em cada tratamento. Os resultados demonstraram que a aplicação da levedura aumentou inicialmente a concentração de NH4+ nos lixiviados e no solo relativamente ao controlo e o NO3- aumentou seguidamente.
N2O e CO2 aumentaram significativamente relativamente ao controlo nos primeiros dias depois
da aplicação da levedura. As emissões no tratamento AN foram semelhantes ao controlo, com um ligeiro aumento de N2O. As emissões de CH4 foram insignificantes. O Potencial de
aquecimento global (PAG) obtido com aplicação de levedura e com AN foram, respectivamente, 6× e 2× vezes maiores do que o valor registado no control.
v Resumo alargado
A Terra é um planeta dinâmico coberto com ar, água e solo sustentáveis à vida que estão em constante interação energética e material. A qualidade ambiental depende da gestão de resíduos como fonte de nutrientes para o solo, progredindo as suas propriedades físicas, químicas e biológicas. O impacte da gestão de nutrientes é mais direccionado para a qualidade da água devido à infiltração de poluentes (nitratos e fósforo) para as águas subterrâneas mas também para o compartimento atmosférico devido à emissão de gases com efeito de estufa.
A área Mediterrânea é caracterizada como tendo um solo degradado, exposto a grandes variações climáticas, um conteúdo pobre em P, N e matéria orgânica, principalmente na camada superficial, e consequentemente erodido. O uso intensivo de fertilizantes minerais na prática agrícola é responsável pela degradação ambiental bem como pelo decréscimo da MO e efeitos nefastos no crescimento das culturas.
Os resíduos orgânicos com elevado conteúdo orgânico são uma excelente fonte de nutrientes, particularmente K e N, e devem ser aplicados como correctivo orgânico, reduzindo a sua eliminação por aterro e assegurando o reciclo de nutrientes e a fertilidade do solo. No entanto, existe uma preocupação relativo ao impacte ambiental associado à aplicação deste tipo de resíduos caso estes contenham um elevado teor orgânico e baixo pH. Algumas substâncias não desejadas podem ser encontradas, como metais pesados e patogénicos, levando a um impacte negativo na qualidade dos produtos agrícolas, biodiversidade e saúde humana. Como o teor de N pode ser alto, na maior na forma orgânica e consequentemente indisponível para as plantas, a sua aplicação em grandes proporções leva à contaminação das águas subterrâneas por nutrientes não absorvidos.
O NO3- é altamente movél no solo devido à sua fraca interacção com a carga negativa da
matrix. De acordo com a Directiva dos Nitratos (91/676/CEE), as águas subterrâneas são consideradas poluídas se os níveis de nitrato atingirem valores de 50 mg.L-1. As
concentrações de NH4+ na solução do solo normalmente são pequenas devido à sua alta
retenção mas podem aumentar em solos com textura arenosa e fraca capacidade de retenção catiónica.
A preocupação das perdas de P por lixiviação nos solos arenosos tem vindo a aumentar, principalmente nos habitats marinhos, devido à eutrofização de sistemas de água doce, promovendo o crescimento de algas e plantas marinhas. No entanto, as perdas de P são neglegenciadas devido à sua elevada capacidade de retenção mesmo após grandes inputs
vi de água. A dinâmica do P depende altamente dos valores de pH. Para níveis baixos de pH, o fosfato pode ser adsorvido pelos óxidos de ferro (Fe) e alumínio (Al), partículas com capacidade de troca aniónica. Em solos alcalinos, este tende a formar compostos com Ca. O K é altamente móvel nos solos e consequentemente quantidades significativas podem ser perdidas por lixiviação. A suas perdas são frequentemente um problema em solos arenosos devido ao baixo conteúdo em argila e fraca interacção com a matriz e dependem maioritariamente da CTC, textura e pH do solo e concentrações de Ca2+. Uma baixa lixiviação
de potássio pode ser observada em níveis de pH entre 6 e 6.5, devido à sua substituição por Ca2+ pela competição nas águas lixiviadas.
Os GEE através das actividades humanas são os maiores condutores da alteração climática observada nos meados do século 20. CO2, N2O e CH4 são os três principais GEE que
contribuem para a alteração dos ecossistemas e aquecimento global, e a maioria das emissões são geradas pelo sector agro-pecuário devido ao uso de fertilizantes sintécticos e processos biológicos. De facto, os processos biológicos neste sector e noutras fontes (ex. gás de pântano) são os maiores responsáveis pelo elevado aumento dos níveis globais de metano na atmosfera. A prática agrícola é responsável por 1:3 dos GEE e a alteração climática provavelmente irá causar descidas dos rendimentos. Sob condições aeróbias, o N2O é
relevante nas actividades agrícolas devido à aplicação de residuos com alto teor de N que pode dar origem à formação de nitrato dependendo das condições ambientais.
O resíduo de levedura é obtido pelo processamento e separação da levedura do mosto, rico em proteínas, carbohidratos, vitaminas e alguns minerais, gerado durante a fermentação alcoólica. O melaço da beterraba ou cana é a principal matéria-prima usada para fornecer o açucar necessário para o desenvolvimento das células da levedura. Estudos anteriores concluíram que a aplicação da levedura no solo pode ser uma grande fonte de nutrientes para o crescimento das plantas, levando a uma mineralização dos compostos orgânicos. No entanto, devido ao seu alto conteúdo orgânico e carbono lábil, a levedura pode estimular a produção de CO2 e o aumento de nitrato e fósforo lixiviado. A CE também pode ser alta em
alguns resíduos de levedura e o seu uso indiscrimado pode afectar as propriedades físico-químicas do solo, como o aumento da pressão osmótica, consequentemente perdas de água, e toxicidade do solo.
O principal objectivo deste estudo é avaliar o impacte da aplicação de dois resíduos de levedura (CMS e CMSdecantado) a um solo ácido e arenoso, seguindo a lixiviação potencial de nutrientes nas águas subterrâneas em dois ensaios independentes (curta e longa duração), a mineralização do azoto no solo e a emissão de GEE na atmosfera num ensaio de incubação laboratorial.
vii A amostra de solo foi recolhida em Palmela, Portugal, numa parcela de solo agrícola não fertilizada há mais de 10 anos. A amostra de solo utilizada para a experiência de lixiviação curta-duração foi armazenada e considerada perturbada. Os tratamentos experimentais foram: A aplicação à superfície do CMS e CMSd, a aplicação à superfície do CMS e CMSd com posterior incorporação na camada 0-5 cm, a aplicação à superfície AN (não aplicado na lixiviação curta-duração) e o controlo (CTR) sem aplicação. A quantidade de levedura aplicada foi 2 g (experiência de curta-duração) e 170 kgN.ha-1 (experiência de longa-duração). O
programa estatístico utilizado foi o Statistix, de modo a estudar a variância entre tratamentos (ANOVA 1-factor), temporal (ANOVA 2-factores) e o erro padrão (teste de Tukey) num intervalo de confianção a 5%. No ensaio de lixiviação curta-duração (durante 38 dias), 15 tubos de PVC foram montados (5 tratamentos × 3 réplicas) para avaliar as perdas de N, P, K, durante 5 eventos de irrigação com 300 mL de água desionizada 3 dias após a aplicação. Os resultados demostraram que a aplicação da levedura aumentou a lixiviação de NH4+, PT e KT
enquanto que o NO3- desceu relativamente à elevada quantidade inicial no controlo, nas
primeiras irrigações. Os tratamentos com mistura aumentaram prematuramente as perdas de NH4+, NO3- e PT. Os tratamentos sem incorporação aumentaram as perdas de KT. No ensaio
de lixiviação longa-duração (durante 73 dias), 24 tubos de PVC foram montados (6 tratamentos × 4 réplicas) para avaliar as perdas de N, P, e foram feitos 6 eventos de irrigação em cada duas semanas com 300 mL de água desionizada 3 dias após a aplicação. Neste ensaio usaram-se colunas de solo não perturbado. Um ensaio de incubação (6 tratamentos × 3 réplicas) foi realizado para medir as emissões de GEE (CO2, N2O, CH4). Durante 78 dias
foram feitas 21 medições. Os gases N2O e CO2 aumentaram significativamente nos primeiros
dias depois da aplicação da levedura. As emissões no tratamento com AN foram semelhantes ao controlo mas com um ligeiro aumento de N2O. As emissões de CH4 foram insignificantes.
O Potencial de Aquecimento Global observado com aplicação de levedura e do nitrato de amónio foram, respectivamente, 6× e 2× vezes maiores que o valor observado no control. Outro ensaio de incubação (6 tratamentos × 3 réplicas) foi realizado durante 77 dias para avaliar a mineralização do azoto no solo. Os resultados demonstraram que a aplicação da levedura aumentou inicialmente o NH4+ lixiviado e no solo relativamente ao controlo e o NO3
-aumentou depois disso. O PT lixiviado foi semelhante em todos os tratamentos. Para solos
saturados ou períodos de irrigação intensos, o tratamento com incorporação aumentou a emissão de GEE e a lixiviação de P. Por outro lado, uma frequência menor de irrigação leva à diminuição da desnitrificação, permitindo um maior conteúdo de nitratos relativamente aos tratamentos à superfície. No ensaio de longa-duração, os valores de NO3- lixiviado (2ª
irrigação) foram maiores que o valor máximo admissível 50 mg.L-1. As emissões de N 2O
dependeram do tipo de resíduo, no qual a levedura não decantada teve maiores valores. Em ambos os resíduos houve um aumento da mineralização dos compostos orgânicos, para a
viii captação da planta, e do pH no solo. A aplicação de NH4NO3, relativamente às leveduras,
aumentou significativamente a lixiviação de nitratos, e a sua aplicação mesmo em pequenas quantidades pode facilmente poluir os cursos de água. Por outro lado, as emissões de GEE foram muito baixas. Neste estudo observou-se um balanço entre o tipo de fonte de nutrientes (levedura ou NH4NO3) e o tipo de compartimento poluído (atmosférico ou águas
subterrâneas). Acredita-se que a aplicação mais segura em solos arenosos e ácidos, seja a aplicação à superfície da levedura decantada, levando a uma maior retenção de amónio no solo acrescentado às menores emissões cumulativas de N2O entre os dois tipos de resíduo
ix Index
1. Context of the study ... 1
2. Introduction ... 2
2.1. Mediterranean soil and the use of fertilizers ... 2
2.2. Organic wastes, benefits and consequences ... 2
2.3. Nutrients leaching and water quality ... 4
2.4. GHG emissions ... 5
2.5. Nitrogen cycle ... 7
2.5.1. Atmospheric nitrogen fixation ... 7
2.5.2. Nitrogen mineralization ... 8
2.5.3. Nitrification ... 8
2.5.4. Denitrification ... 9
2.5.5. Ammonia volatilization ...10
2.5.6. Anammox (anaerobic ammonia oxidation) ...10
2.6. Carbon cycle ...12
2.6.1. The slow carbon cycle ...12
2.6.2. The fast carbon cycle ...13
2.7. Organic matter ...15
2.8. Decomposition and mineralization of organic compounds ...16
2.9. Yeast waste ...18
2.10. Bibliography ...19
3. Results and discussion: research article ...23
Abstract ...24
A. Introduction ...25
B. Materials and methods ...28
B.1. Soil and yeast waste ...28
B.2. Experimental design ...30
x
B.2.2. Long-term experiment ...31
B.2.2.1. Long-term leaching experiment ...31
B.2.2.2. GHG emissions and Nitrogen mineralization experiment ...32
B.2.3. Analytical techniques ...33
B.2.4. Statistical analyses ...33
C. Results ...34
C.1. Short-term experiment ...34
C.2. Long-term experiment ...41
C.2.1. Long-term leaching experiment ...41
C.2.2. Nitrogen mineralization experiment ...45
C.2.3. GHG emissions experiment ...49 D. Discussion ...55 D.1. Short-term experiment ...55 D.2. Long-term experiment ...56 D.2.1. Potential leaching...56 D.2.2. Nitrogen mineralization ...57 D.2.3. GHG emissions ...58 E. Conclusion ...59 References ...60
xi Figures index
Figure 1 - Effects of increasing soil organic matter content and overall soil fertility by soil carbon
improvement (Diacono and Montemurro, 2010)... 3
Figure 2 - Hydrological cycle - groundwater and surface water relationships along with and groundwater pollution risks (UNEP, 2001) ... 5
Figure 3 - Carbon dioxide levels in the atmosphere (NASA, 2016). ... 6
Figure 4 - Greenhouse gas emissions from agriculture activity (FAO, 2016). ... 7
Figure 5 - Model of the relationship between water-filled pore space of soils and the relative fluxes of nitrogen gases from nitrification. (Bouwman, 1998). ... 9
Figure 6 - Nitrogen cycle (Bernhard, 2010). ...11
Figure 7 - The processing and fluxes of reactive nitrogen in terrestrial and marine systems and in the atmosphere (Tg.yr-1), showing the dominant forms of the reactive N in the exchanges and the magnitude of the boundary fluxes, and approximate lifetimes, integrated over global scales (Fowler et al., 2013). ...11
Figure 8 - Fast carbon cycle (Bot and Benites, 2005). ...14
Figure 9 - Carbon cycling and biosequestration (U.S. DOE, 2008). ...14
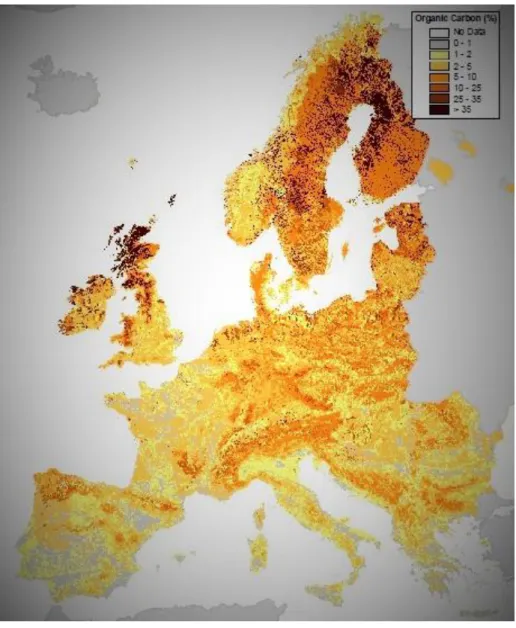
Figure 10 - Topsoil organic carbon in Europe (Jones et al., 2004). ...16
Figure A1 - pH of leachates observed during the 5 irrigation events performed in the short-term experiment (38-day period). Means of 6 replicates. Error bars represent the standard error used on each leaching event to assess significant (P<0.05) differences between mean values. ...34
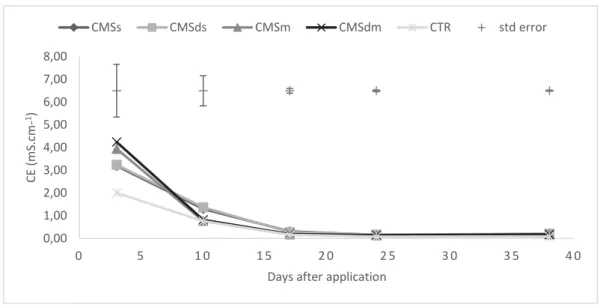
Figure A2 - EC of leachates observed during the 5 irrigation events performed in the short-term experiment (38-day period). Means of 6 replicates. Error bars represent the standard error used on each leaching event to assess significant (P<0.05) differences between mean values. ...35
Figure A3 - Ammonium concentration of leachates observed during the 5 irrigation events performed in the short-term experiment (38-day period). Means of 6 replicates. Error bars represent the standard error used on each leaching event to assess significant (P<0.05) differences between mean values. ...35
Figure A4 - Nitrate concentration of leachates observed during the 5 irrigation events performed in the short-term experiment (38-day period). Means of 6 replicates. Error bars represent the standard error used on each leaching event to assess significant (P<0.05) differences between mean values. ...36 Figure A5 - Phosphorus concentration of leachates observed during the 5 irrigation events performed in the short-term experiment (38-day period). Means of 6 replicates. Error bars
xii represent the standard error used on each leaching event to assess significant (P<0.05) differences between mean values. ...37 Figure A6 - Potassium concentration of leachates observed during the 5 irrigation events performed in the short-term experiment (38-day period). Means of 6 replicates. Error bars represent the standard error used on each leaching event to assess significant (P<0.05) differences between mean values. ...38 Figure A7 – Variation of the pH along the soil columns at the end of the short-term experiment. Means of 3 replicates. Error bars represent the standard error used on each leaching event to assess significant (P<0.05) differences between mean values. ...38 Figure A8 – Variation of the EC along the soil columns at the end of the short-term experiment. Means of 3 replicates. Error bars represent the standard error used on each leaching event to assess significant (P<0.05) differences between mean values. ...39 Figure A9 – Variation of the ammonium content along the soil column at the end of the short-term experiment. Means of 3 replicates. Error bars represent the standard error used on each leaching event to assess significant (P<0.05) differences between mean values. ...39 Figure A10 – Variation of the nitrate content along the soil column at the end of the short-term experiment. Means of 3 replicates. Error bars represent the standard error used on each leaching event to assess significant (P<0.05) differences between mean values. ...40 Figure A11 - pH of leachates observed during the 6 irrigation events performed in the long-term experiment (73-day period). Means of 4 replicates. Error bars represent the standard error used on each leaching event to assess significant (P<0.05) differences between mean values. ...41 Figure A12 - EC of leachates observed during the 6 irrigation events performed in the long-term experiment (73-day period). Means of 4 replicates. Error bars represent the standard error used on each leaching event to assess significant (P<0.05) differences between mean values. ...42 Figure A13 - Ammonium concentration of leachates observed during the 6 irrigation events performed in the long-term experiment (73-day period). Means of 4 replicates. Error bars represent the standard error used on each leaching event to assess significant (P<0.05) differences between mean values. ...43 Figure A14 - Nitrate concentration of leachates observed during the 6 irrigation events performed in the long-term leaching (73-day period). Means of 4 replicates. Error bars represent the standard error used on each leaching event to assess significant (P<0.05) differences between mean values. ...44 Figure A15 - Phosphorus concentration of leachates observed during the 6 irrigation events performed in the long-term leaching (73-day period). Means of 4 replicates. Error bars
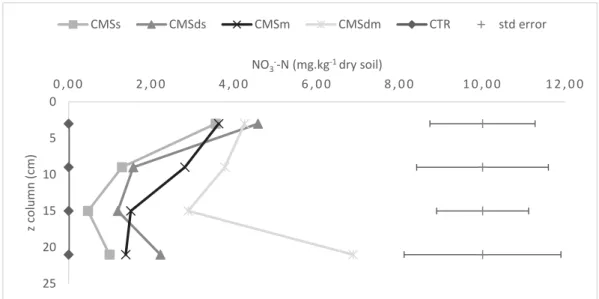
xiii represent the standard error used on each leaching event to assess significant (P<0.05) differences between mean values. ...44 Figure A16 – Evolution of soil pH during the long-term experiment (77-day period). Means of 3 replicates. Error bars represent the standard error used on each leaching event to assess significant (P<0.05) differences between mean values. ...45 Figure A17 – Evolution of soil EC during the long-term experiment (77-day period). Means of 3 replicates. Error bars represent the standard error used on each leaching event to assess significant (P<0.05) differences between mean values. ...46 Figure A18 – Evolution of soil ammonium content during the long-term experiment (77-day period). Means of 3 replicates. Error bars represent the standard error used on each leaching event to assess significant (P<0.05) differences between mean values. ...47 Figure A19 – Evolution of soil nitrate content during the long-term experiment (77-day period). Means of 3 replicates. Error bars represent the standard error used on each leaching event to assess significant (P<0.05) differences between mean values. ...48 Figure A20- Evolution of soil Net nitrogen mineralization during the long-term experiment (77-day period). ...48 Figure A21 - N2O-N emissions evolution during the long-term experiment (78-day period).
Means of 3 replicates. Error bars represent the standard error used on each leaching event to assess significant (P<0.05) differences between mean values. ...49 Figure A22 - N2O-N emissions evolution during the long-term experiment (78-day period).
Means of 3 replicates. ...50 Figure A23 - Cumulative N2O-N emissions during the long-term experiment (78-day period).
...50 Figure A24 - CO2-C emissions evolution during the long-term experiment (78-day period).
Means of 3 replicates. Error bars represent the standard error used on each leaching event to assess significant (P<0.05) differences between mean values. ...51 Figure A25 - CO2-C emissions evolution during the long-term experiment (78-day period).
Means of 3 replicates. ...51 Figure A26 - Cumulative CO2-C emissions during the long-term experiment (78-day period).
...52 Figure A27 - CH4-C emissions evolution during the long-term experiment (78-day period).
Means of 3 replicates. Error bars represent the standard error used on each leaching event to assess significant (P<0.05) differences between mean values. ...53 Figure A28 - Global Warming Potential based on a 100-year time frame of GHG emissions during incubation experiment (78-day period). ...54
xiv Table index
Table A1 - Physical-chemical analysis of soil sample ...28 Table A2 - Chemical analysis of yeast waste ...29
xv List of abbreviations, acronyms and chemical symbols
C - Carbon
CEC - Cation-exchange capacity CH4 - Methane
CMS - Yeast waste
CMSd - Decanted yeast waste CO2 - Carbon dioxide
EC - electrical conductivity
FAO - Food and Agriculture Organization GHG - Greenhouse gas
IPCC - Intergovernmental Panel on Climate Change K - Potassium
N - Nitrogen
NASA - National Aeronautics and Space Administration NH4NO3 (AN) - Ammonium nitrate
NH4+ - Ammonium NO3- - Nitrate N2O - Nitrous oxide OC - Organic carbon OM - Organic matter P - Phosphorus
UNEP - United Nations Environment Programme WFPS - Water-filled pore space
1
1. Context of the study
The yeast production industry (e.g. distillery, brewing, baking industries) has been growing globally over the last years and large amounts of yeast waste are produced during alcohol fermentation. In order to respect the quality of our environment that has suffered significant alterations along this century, the idea of the environmental sustainability has been a pathway for such industries. The reuse of generated wastes, particularly in agronomic and energetic sectors, minimizing the waste disposal is one step to decrease the anthropogenic pollution. In the present study, two independent experiments were performed, a short-term experiment where strong irrigation events were applied to soil columns amended with yeast waste, decanted yeast waste and ammonium nitrate, simulating an intensive rainfall. A long-term experiment was then performed with moderate irrigation events to assess potential leaching in a similar soil column experiment. Nitrogen mineralization in soil and greenhouse gases emissions were also assessed in an aerobic incubation, in order to assess the potential impact of yeast waste application to agricultural soils in two main environmental compartments, groundwater and atmosphere. The study will be presented as an article research, preceded by an introduction in which the main scientific concepts and the problematic about organic wastes application to soil are exposed.
2
2. Introduction
2.1. Mediterranean soil and the use of fertilizers
Soil is a dynamic ecosystem that supplies naturally organic matter and minerals for plants nutrition (Bot and Benites, 2005). However, its degradability is increasing at global level leading to a negative impact on living organisms and natural resources. Indeed, a new study reported that humans, probably, erode soil 100× faster than nature (Iacurci, 2015). The Mediterranean area is typically characterized as having a degraded soil exposed to fires and violent precipitation events by dries summers and excessive winter rains (Larchevêque et al., 2006; Yaalon, 1997), dramatically changing agriculture systems predictions. Furthermore, P, N and organic matter content are low, particularly in topsoil, leading to a disaggregation of soil particles and consequently erosion (Diacono and Montemurro, 2010). The intensive use of mineral fertilizers in agriculture practice is not only responsible for the environmental degradation but also by the decrease of organic matter and delirious effects on crop growth, such as weed competition and product’s quality loss. However, negative impacts associated with the use of mineral fertilizers are often suppressed due their importance for the increase of yields and food security. Ammonium nitrogen is a great nitrogen source with a high solubility that considerable changes chemical properties of soil and supplies immediately available nitrogen for plant uptake. Soil acidification, soil humus depletion and greenhouse emissions are often linked after the application of AN in agriculture (Kotschi, 2015).
2.2. Organic wastes, benefits and consequences
Organic wastes with high organic content are an excellent potential source of plant nutrients in agricultural soils, particularly potassium and nitrogen, which may be applied as a nutrients supplier/corrective organic thereby reducing landfill disposal and ensuring the recycling of nutrients by the increase of microbial biomass (Alvarenga et al., 2015; Rezende et al., 2004). Furthermore, they are essential for the recovery or replacement of degraded soil fertility, providing organic matter enough to improve physical (soil structure, energy exchange), chemical (nutrients regularization) and biological (energetic and nutritive support) properties (Figure 1).
On the other hand, the defective implementation of organic wastes, particularly with high organic content and low pH, can lead to the concern about the environmental pollution (Pita et
3 al., 2010). Undesired substances, such as heavy metals and pathogens, will lead to a greater negative impact on the quality of products, biodiversity and human health (Alvarenga et al., 2015). Sometimes nutrients, including the total nitrogen content, can be high in some of these wastes (Li et al., 1997), mostly organic and consequently unavailable to plants, its application at high rates may lead to contamination of water courses by nutrients not absorbed by plants. The optimization of organic wastes management is crucial in order to keep fluxes balance, maximizing benefits in agriculture practice to the lower environmental risk (gaseous emissions plus superficial, runoff and leaching of nutrients into water courses) according to the type of soil. Sandy soils, with low humus content and pH, rely heavily on organic matter in order to increase their cation-exchange and water holding capacities and thereafter reducing nutrients losses and increasing their availability for plants.
Figure 1 - Effects of increasing soil organic matter content and overall soil fertility by soil carbon improvement (Diacono and Montemurro, 2010).
4 2.3. Nutrients leaching and water quality
Nutrients leaching from the soil are highly dependent on the rainfall or irrigation events, therefore field capacity, and the permeability of the soil (Loehr, 1974; Lehmann and Schroth, 2003) and may lead to a groundwater contamination (Figure 2).
The majority concern about N applied in agriculture soils are the leaching of nitrate ions and the surface runoff of organic nitrogen. NO3- is highly mobile in soil due its insignificant
interaction to the negative charged matrix. On the contrary, ammonium concentrations in soil solution normally are very low due its high retention but can increase in soils with a sandy texture and low cation-exchange capacity (Fangueiro et al., 2014). Nitrogen fertilizers, such as AN, are the major source of nitrate pollution since they provide immediately N mineral forms in soil. In fact, Portugal showed a strongest decline in groundwater nitrate concentrations. Phosphorus losses by leaching have been neglected because their insignificant quantities (Fortune et al., 2005) due its high adsorption in the matrix soil even with a large amount of water input. Furthermore, phosphorus dynamics depend highly on pH levels. At low pH levels, phosphate can be adsorbed by iron (Fe) and aluminium (Al) oxides (particles with anion exchange capacity). On the other hand, in alkaline soils it tend to form compounds with Calcium (Ca). However, as arable soils have low clay content, its leaching is a concern, particularly in marine habitats, contributing to eutrophication of freshwater systems (Djodjic and Bergstrom, 2005) thereafter promoting algae and aquatic weed growth. One of the largest sources of P losses is the use of fertilizers in agricultural systems.
Potassium is a mobile ion in soils and consequently significant amounts can be lost by leaching, especially on sandy soils (low clay content) and poor retention. Losses of K+ depends
mainly on the CEC, soil texture, pH and Calcium concentrations (Ca2+). Normally, a low K
leached is observed at pH levels between 6-6.5 (Sparks, 2001) due to enhanced substitution of K for Ca by its competition in the leaching water and the amount of water that passes through the soil. Indeed, Kolahchi and Jalali (2007) described that high concentrations of cations such as Ca2+ on irrigation waters increase potassium leached.
5
Figure 2 - Hydrological cycle - groundwater and surface water relationships along with and groundwater pollution risks (UNEP, 2001)
2.4. GHG emissions
Greenhouse gases emissions from human activities are the most significant driver of observed climate change since the mid-20th century (IPCC, 2013). Gaseous emissions such as carbon dioxide, nitrous oxide and methane are the three of the main greenhouse gases (GHGs) contributing to ecosystems change and global warming (Fangueiro et al., 2012). At moment, current CO2 levels on atmosphere are approximately 400 ppm (NASA, 2016) (Figure 3), and
most of GHG emissions comes from the agropecuary sector due the use of synthetic fertilizers and biological processes (FAO, 2016) (Figure 4).
6
Figure 3 - Carbon dioxide levels in the atmosphere (NASA, 2016).
Indeed, biological processes from this sector and other sources (e.g. swamp gas) are the largest responsible for the strongly increase of global methane levels in atmosphere, especially in hot wet tropic areas. Furthermore, waste disposal increases methane emissions released from the organic matter decomposition in landfills (UNEP, 2001) and Landfill Gas-to-Energy projects are another attractive final destination. Gilbert (2012) published an article referring that agriculture practice, including food systems, is responsible for about one-third of GHG emissions, and climate change probably will cause yields drop. Under aerobic conditions, N2O
gets special attention in agricultural activities due the application of wastes with high nitrogen content and soil physical-chemical properties and environmental conditions. In fact, in this century, soil will absorb less carbon dioxide from atmosphere than expected and waiting for an uncertain or prolonged carbon sequestration cannot be an option. Depending on future emissions of GHG and how the climate responds, average global temperatures probably can increase by 0.5 °F to 8.6 °F by 2100 (IPCC, 2013).
7
Figure 4 - Greenhouse gas emissions from agriculture activity (FAO, 2016).
2.5. Nitrogen cycle
Ammonium (NH4+) and nitrate (NO3-) are the mainly inorganic forms available for plants. The
anthropogenic addiction of mineral nitrogen in soils can alter the natural interaction between ecosystems leading to various environmental impacts on water courses, carbon sequestration, etc. The organic nitrogen is an organic fraction of organic matter in soils, originated naturally by living organisms or applied by human activities (e.g. wastes discharge) (Figure 7). In fact, according to Bernhard (2010) the amount of nitrogen fixed by human activities probably will exceed that fixed by microbial processes in 2030.
2.5.1. Atmospheric nitrogen fixation
Dinitrogen gas (N2) is the largest nitrogen form in Earth and is the final stable form of all
nitrogen compounds. Atmospheric nitrogen fixation is the process of converting biologically (or industrially) dinitrogen into ammonium (or ammonia) mainly by living organisms (or non-biological materials e.g. industrial activities, lightning) and a large amount of energy is required to break down N bonds.
8 or
𝑁2+ 8𝐻++ 8𝑒− ⟶ 2𝑁𝐻3+ 𝐻2
2.5.2. Nitrogen mineralization
Mineralization is the conversion of organic to inorganic nitrogen forms. The first step is aminization, the breakdown of complex nitrogen molecules (e.g. proteins) to simple organic forms (R-NH2) by primarily heterotrophs microorganisms.
𝑁 𝑐𝑜𝑚𝑝𝑙𝑒𝑥 𝑐𝑜𝑚𝑝. ⟶ 𝑅 − 𝑁𝐻2+ 𝐶𝑂2+ 𝑒𝑛𝑒𝑟𝑔𝑦 + 𝑏𝑦𝑝𝑟𝑜𝑑𝑢𝑐𝑡𝑠
Ammonification is the final step of mineralization realized by primarily autotrophic microorganisms, in which simple organic forms are converted to ammonia.
𝑅 − 𝑁𝐻2+ 𝐻2𝑂 ⇌ 𝑁𝐻3+ 𝑅 − 𝑂𝐻 + 𝑒𝑛𝑒𝑟𝑔𝑦
and (if reacted with water)
𝑁𝐻3 (𝑎𝑞)+ 𝐻20 ⟶ 𝑁𝐻4++ 𝑂𝐻−
2.5.3. Nitrification
Nitrification has two steps and different pathways: The first step is the oxidation of ammonium (or ammonia, via the intermediate hydroxylamine) into nitrite by aerobic ammonia oxidizers (e.g. nitrosomonas) followed by a possible oxidation of nitrite to nitrate through nitrite oxidizing bacteria (e.g. Nitrobacter). Nitrification depends mainly on pH, temperature, aeration and moisture. 2𝑁𝐻4++ 3𝑂2 ⟶ 2𝑁𝑂2−+ 4𝐻++ 2𝐻2𝑂 and 2𝑁𝑂2−+ 𝑂 2 ⟶ 2𝑁𝑂3− or
9 𝑁𝐻3+ 𝑂2+ 2𝑒− ⟶ 𝑁𝐻2𝑂𝐻 + 𝐻2𝑂 𝑁𝐻2𝑂𝐻 + 𝐻2𝑂 ⟶ 𝑁𝑂2−+ 5𝐻++ 4𝑒− and 𝑁𝑂2−+ 1 2𝑂2 ⟶ 𝑁𝑂3 − 2.5.4. Denitrification
Under anaerobic or anoxic conditions, denitrifying bacteria (e.g. Pseudomonas) reduce nitrate in the presence of carbon (e.g. organic matter) to nitrogen gas forms (nitric oxide, nitrous oxide, dinitrogen). The percentage of gas emissions depends on many factors, including soil moisture (Figure 5), temperature and soil properties.
𝑁𝑂3− ⟶ 𝑁𝑂2− ⟶ 𝑁𝑂 + 𝑁2𝑂 ⟶ 𝑁2
or (anoxic conditions)
2𝑁𝑂3−+ 10𝑒−+ 12𝐻+ ⟶ 𝑁2+ 6𝐻20
Figure 5 - Model of the relationship between water-filled pore space of soils and the relative fluxes of nitrogen gases from nitrification. (Bouwman, 1998).
10 2.5.5. Ammonia volatilization
Ammonia volatilization is the ammonia loss to the atmosphere by the conversion of ammonium ions to ammonia gas form, due soil conditions after the ammonification (e.g. poor water content, high pH levels) or the application of products that contain urea (e.g. fertilizers), particularly not mixed with soil.
𝑁𝐻3+ 𝑅 − 𝑂𝐻 ⟶ 2𝑁𝐻3 (𝑔)+ 𝐶𝑂2
or
𝑁𝐻4++ 𝑂𝐻− ⟶ 𝑁𝐻3 (𝑎𝑞)+ 𝐻2𝑂
𝑁𝐻3 (𝑎𝑞) ⟶ 𝑁𝐻3 (𝑔)
or (after the application of urea)
𝐶𝑂(𝑁𝐻2)2+ 𝐻++ 2𝐻20 ⟶ 2𝑁𝐻4++ 𝐻𝐶𝑂3−
𝑁𝐻4++ 𝑂𝐻− ⟶ 𝑁𝐻4𝑂𝐻 + 𝑁𝐻3 (𝑔)+ 𝐻2𝑂
2.5.6. Anammox (anaerobic ammonia oxidation)
Under anoxic conditions, anammox bacteria (e.g. Brocadia Anammoxidans) oxidize ammonium by using nitrite as the electron accepter.
11
Figure 6 - Nitrogen cycle (Bernhard, 2010).
Figure 7 - The processing and fluxes of reactive nitrogen in terrestrial and marine systems and in the atmosphere (Tg.yr-1), showing the dominant forms of the reactive N in the exchanges and the magnitude of the boundary
12 2.6. Carbon cycle
Lithosphere is the greatest source of carbon, followed by hydrosphere, atmosphere and biosphere (Figure 9). Carbon is naturally flowed between reservoirs maintaining Earth’s carbon balance. However, human activities (e.g. burn of fossil fuels) are altering carbon flows leading to negative impacts such as the global increase of temperature. According to the time-line movement of carbon, carbon cycles are classified as slow and fast.
2.6.1. The slow carbon cycle
The slow carbon cycle is the movement of carbon between lithosphere, hydrosphere and atmosphere that can take hundreds of millions of years.
Atmospheric carbon reacts with rain water, forming acid carbonic that falls to the surface: 𝐶𝑂2 (𝑎𝑞)+ 𝐻2𝑂 ⇌ 𝐻2𝐶𝑂3 (𝑎𝑞)
Rocks are dissolved by the acid carbonic, a process designed as chemical weathering (e.g. carbonation), forming bicarbonate and chemical components, such as ions, that are possible carried to water compartments:
𝐶𝑎𝐶𝑂3+ 𝐻2𝐶𝑂3 ⟶ 𝐶𝑎2++ 2𝐻𝐶𝑂3−
Carbonate ions are released by dissociation (liberation of hydrogen ions), thereafter forming other possible compounds (e.g. water, carbon dioxide).
𝐻𝐶𝑂3− ⇌ 𝐶𝑂32−+ 𝐻+
On oceans, carbonate ions react with calcium to form calcium carbonate by living organisms (e.g. corals and plankton) particularly in hard waters:
𝐶𝑂32−+ 𝐶𝑎2+ ⟶ 𝐶𝑎𝐶𝑂3
The death of these organisms will release their carcases into seafloor, thereafter cemented by the time, generating rocks such as limestone.
The organic carbon on land from living organisms are split in the mud and if exposed to a considerable amounts of heat and pressure, can generate carbon sedimentary rocks. On the
13 other hand, if the decay of the dead plant matter is lower than its accumulation, can lead to the formation of oils, coal or natural gas.
The return of the carbon to the atmosphere as carbon dioxide is made particularly through volcanoes. The collision of carbon rocks generates a large amounts of heat and pressure, causing its melting and recombination into silicate minerals (e.g. metamorphic decarbonation).
𝐶𝑎𝐶𝑂3 + 𝑆𝑖𝑂2 ⟶ 𝐶𝑎𝑆𝑖𝑂3+ 𝐶𝑂2
2.6.2. The fast carbon cycle
The exchange of carbon between living organisms is called the fast carbon cycle, and its time-line depends on the type of organisms associated (Figure 8).
Plants and Phytoplankton (microscopic ocean organisms) absorb carbon dioxide from the atmosphere and, using sun-light as energy, combines CO2 and water to form oxygen and
carbohydrates (e.g. formaldehydes) (photosynthesis):
𝐶𝑂2+ 𝐻2𝑂 + 𝑒𝑛𝑒𝑟𝑔𝑦 ⇌ 𝐶𝐻2𝑂 + 𝑂2
The inverse process is made by auto/heterotrophic organisms, microorganisms or even fire events, releasing carbon dioxide to the atmosphere (cellular respiration):
𝐶𝐻2𝑂 + 𝑂2 ⇌ 𝐶𝑂2+ 𝐻2𝑂 + 𝑒𝑛𝑒𝑟𝑔𝑦
Photosynthesis is the primarily process for soil carbon sequestration (Ontl, 2012) by removing CO2 from the atmosphere, stored in the form of soil organic carbon and contribute to soil organic matter.
Some anthropogenic activities, such as the substitution of natural ecosystems to croplands, are knowing as agents of natural biomass removal and accelerate organic material decomposition, leading to an unbalanced carbon cycle and the depletion of SOC.
14
Figure 8 - Fast carbon cycle (Bot and Benites. 2005).
15 2.7. Organic matter
Organic matter is a diverse organic material including decaying material from living organisms (plants and animals), soil microorganisms (e.g. bacteria and fungi) and soil humus (e.g. non-living material) that affects soil properties (e.g. soil structure), increases water and plant nutrients retention, minimizing negative impacts such as soil erosion and water courses contamination. Organic carbon is the largest component of organic matter. Humus is an amorphous and complex material produced by a delay decomposition and modified organic matter over the time. Humus is constituted by humic substances (e.g. polysaccharides, fluvic acids), and around 20-40% are non-humic compounds (Brady and Weil, 2002). While humus is associated as having a dark brown colour, colloidal nature, large organic carbon content and very low minerals, non-humic fraction can be a great source of nutrients and soil stability. Soil temperature and moisture conditions are the two major natural factors for OM accumulation followed by soil physical-chemical properties, biomass production and topography (Figure 10). In general, the increase of temperature leads to an increase of biomass net primary productivity and soil organic matter decomposition rate (Kirshbaum, 1995). On the other hand, annual precipitation is positively linked to a biomass and OM accumulation if soil moisture do not reached saturation conditions and thus poor aeration for microbial activity. Sandy texture soils and poor clay content are related to the decline of organic matter due low particles aggregation and poor formation of bonds, thereafter decreasing cation-exchange capacity and the ability of nutrients retention. Extreme pH levels, salinity and toxicity in soils lead to a reduction of biomass and O.M. production (Bot and Benites, 2005).
16
Figure 10 - Topsoil organic carbon in Europe (Jones et al., 2004).
2.8. Decomposition and mineralization of organic compounds
The decomposition of organic matter is made by soil organisms (e.g. microorganisms) that break down and biochemical transform complex organic molecules of dead material, releasing simple organic and mineral compounds. According to Ĉerný et al., (2003), the use of nitrogen fertilizers increase the decomposition rate therefore decrease the easily decomposable fraction of organic matter and microbial biomass in soil. The contribution of waste organic carbon to organic matter in agriculture soils depends on many factors such as its physical-chemical properties and environmental conditions. Neutral pH, good aeration and water content (optimum values about 60% of WFPS) and temperatures between 25-30 °C are great conditions for almost microbial activities and therefore decomposition/mineralization
17 processes. The incorporation of waste, relative to the surface application, can lead to a greater organic decomposition due its immediately contact by soil microorganisms and water content but increases nutrient losses by runoff or emissions (e.g. nitrogen volatilization).
According to Brady and Weil (2002), one year after the waste application, under aerobic conditions, around 60-80% of waste is emitted to atmosphere as carbon dioxide, 3-8% contributes for biomass (soil microorganisms) and 15-35% for humus (3-8% of non-humic and 10-30% of complex humic compounds):
𝑅 − (𝐶, 4𝐻) + 2𝑂2 ⟶ 𝐶𝑂2+ 2𝐻2𝑂 + 𝑒𝑛𝑒𝑟𝑔𝑦
C:N ratio is a parameter mainly used for a nitrogen mineralization-immobilization turnover prediction and is influenced by several factors like soil moisture, environmental conditions, waste and soil characteristics and composition. In general, critical values are between 20 and 30 but can change according to organic material composition of waste. Lowest C:N ratio leads to an increase of organic mineralization therefore a significant release of mineral nutrients, particularly mineral nitrogen, for plant uptake. A high C:N ratio causes microbial competition and nitrogen deficiency for plant leading to an immobilization of nutrients that are incorporated into organic molecules within living cells. Furthermore, the decomposition rate of organic carbon (or organic matter) is related to the type of organic molecules. Amide and sugars are the simplest carbon constituents readily decomposed by microorganisms and their humus contribution is lower compared to recalcitrant compounds such as lignin and waxes. Under anaerobic conditions the decomposition is made by anaerobic bacteria (e.g. methanogenic bacteria) and after precipitation events, the accumulation of OM tends to be greater in a partially decomposed process (Brady and Weil, 2002). Different products are released such as methane and alcohols (e.g. acetate):
4𝐶2𝐻5𝐶𝑂𝑂𝐻 + 2𝐻2𝑂 ⟶ 4𝐶𝐻3𝐶𝑂𝑂𝐻 + 𝐶𝑂2+ 3𝐶𝐻4
𝐶𝐻3𝐶𝑂𝑂𝐻 ⟶ 𝐶𝑂2+ 𝐶𝐻4
𝐶𝑂2+ 4𝐻2 ⟶ 2𝐻2𝑂 + 𝐶𝐻4
Organic fraction represents about 20-80% of total phosphorus in the soil (Curtin et al.,, 2003). The mineralization converts organic P into inorganic forms H2PO4– and HPO4-
(orthophosphates) and depends on the same factors than OM (e.g. temperature, moisture, aeration). Phosphorus dynamics in soil are also related to the organic carbon content (Zhang et al., 2014) and high amounts of OM thereafter its mineralization can release P-fixed into soil
18 solution. C:P ratio is other parameter calculated in order to estimate phosphorus mineralization-immobilization turnover. High C:P values, normally greater than 300, leads to a net immobilization of phosphorus and subsequently decreases P available for plant uptake. On the other hand, C:P values lower than 200 increases P mineralization and the activity of P-fixed bacteria.
𝑂𝑟𝑔𝑎𝑛𝑖𝑐 𝑃 𝑐𝑜𝑚𝑝. ⟶ 𝐻2𝑃𝑂4−
𝐻2𝑃𝑂4− ⇌ 𝐻𝑃𝑂4−2+ 𝐻+ ⇌ 𝑃𝑂4−2+ 𝐻+
Organic wastes can easily provide great amounts of readily K forms (exchangeable and soluble K) due the non-incorporation of K into organic compounds, remaining in the ionic form (K+). Only, approximately, 1-2% of total soil K are in the readily form due the high persistent to
weathering of minerals (e.g. micas and feldspar crystals) that are the greatest source of potassium.
𝑛𝑜𝑛𝑒𝑥𝑐ℎ𝑎𝑛𝑔𝑒𝑎𝑏𝑙𝑒 𝐾 ⇌ 𝑒𝑥𝑐ℎ𝑎𝑛𝑔𝑒𝑎𝑏𝑙𝑒 𝐾 ⇌ 𝑠𝑜𝑖𝑙 𝑠𝑜𝑙𝑢𝑡𝑖𝑜𝑛 𝐾
2.9. Yeast waste
Lallemand Ibéria, S.A. is a biotechnology company with specialization in the production of yeast, live microorganisms of the species Saccharomyces cerevisiae. Liquid, pressed and dry yeast are the final products and around 70% are exported over the world. Yeast is produced by pure cultures of the Saccharomyces cerevisiae strain (Lallemand Ibéria, S.A., 2016). Beet or cane molasses are the main raw material used to supply the necessary sugar for the yeast cell growth. Pure culture of yeast are introduced into a fermenter containing sterilized molasses and other nutrients such as ammonia, diammonium phosphate, magnesium sulphate and vitamins. The developed culture is introduced into a principal fermenter and fed with molasses and nutrients. Adequate conditions such as aeration, temperature and pH are required. Water is used in order to keep the optimum range temperature for the fermentation process. During the alcohol fermentation, yeast waste (CMS) is obtained from the processing and separation of yeast from must, rich in proteins, carbohydrates, vitamins and some minerals. Decanted yeast waste (CMSd) is obtained by the decantation of yeast waste.
Previous studies concluded that yeast applied in soil can be a great source of nutrients for plant growth (Pita et al., 2010) leading to a mineralization of organic compounds. However, due its high organic content and labile carbon, yeast can stimulated CO2 production (Rezende
19 et al., 2004) and increase nitrate and phosphorus leaching. Electrical conductivity can also be high in some yeast wastes and its indiscriminate use may affect the physical and chemical properties of soil (Hati et al., 2007) as the increase of osmotic pressure, consequently water loss available and soil toxicity.
There are a few reports about other possible destinations beyond the nutrient management of yeast waste. Neira and Jeison (2010) showed that the anaerobic co-digestion of surplus yeast and brewery wastewater is feasible due high organic matter content of yeast. AD has become an attractive sustainable treatment for biodegradable organic wastes (Zupančič and Grilc, 2012), producing biogas, composed mainly by methane and dioxide carbon, for renewable energy production. In fact, one of Union European energetic and climatic objectives for 2020 is the obtaining of 20% of energy through renewable sources (Union European, 2016).
2.10. Bibliography
Alvarenga, P., Mourinha, C., Farto, M., Palma, P., Sengo, J., Morais, M.C., Cunha-Queda, C., 2015. Ecotoxicological assessment of the potential impact on soil porewater, surface and groundwater from the use of organic wastes as soil amendments. Ecotoxicology and Environmental Safety, 126, 102-110.
Bernal, M.P., Sánchez-Monedero, M.A., Paredes, C., Roig, A., 1998. Carbon mineralization from organic wastes at different composting stages during their incubation with soil. Agriculture, Ecosystems & Environmental, 69(3), 175-189.
Bernhard, A., 2010. The nitrogen cycle: processes, players, and human impact. Nature Education Knowledge, 3(10), 25.
Bot, A., Benites, J., 2005. The importance of soil organic matter – Key to drought-resistant soil and sustained food and production. Food and Agriculture Organization of the U.S. publications. Bouwman, A.F., 1998. Environmental science: Nitrogen oxides and tropical agriculture. Nature, 392, 866-867.
Brady, Nyle C., Weil, Ray R., 2002. The nature and properties of soils. 13th Ed.
Ĉerný, J., Balík, J., Pavlíková, D., Zitková, M., Sýkora, K., 2003. The influence of organic and mineral nitrogen fertilizers on microbial biomass nitrogen and extractable organic nitrogen in long-term experiments with maize. Plant Soil Environment, 49(12), 560-564.
20 Curtin, D., McCallum, F.M., Williams, P.H., 2003. Phosphorus in light fraction organic matter separated from soils receiving long-term applications of superphosphate. Biology and Fertility of Soils, 37, 280-287.
Diacono, M., Montemurro, F., 2010. Long-term effects of organic amendments on soil fertility. A review. Agronomy for Sustainable Development, 30, 401-422.
Djodjic, F., Bergstrom, L., 2005. Phosphorus losses from arable fields in Sweden: effects of field specific factors and lon-term trends. Environmental Monitoring and Assessment, 102(1), 103-117.
DOE, U.S., 2008. Carbon cycling and biosequestration: Integration biology and climate through systems science. Carbon cycling and biosequestration workshop.
EPA, 2016. Climate change science. Overview of climate change science.
Fangueiro, D., Coutinho, J., Cabral, F., Fidalgo, P., Bol, R., Trindade, H., 2012. Nitric oxide and greenhouse gases emissions following the application of different cattle slurry particle size fractions to soil. Atmospheric Environmental, 47, 373-380.
Fangueiro, D., Surgy, S., Napier, V., Menaia, J., Vasconcelos, E., Coutinho, J., 2014. Impact of slurry management strategies on potential leaching of nutrients and pathogens n a sandy soil amended with cattle slurry. Journal of Environmental Management, 146, 198-205.
FAO, 2016. FAOSTAT emissions database, agriculture, agriculture total.
Fortune, S., Lu, J., Addiscott, T.M., Brookes, P.C., 2005. Assessment of phosphorus leaching losses from arable land. Plant and Soil, 269, 99-108.
Fowler, D. et al, 2013. The global nitrogen cycle in the twenty-first century. Phil Trans R Soc B.
Gilbert N., 2012. One-third of our greenhouse gas emissions come from agriculture. Nature News.
Hati, K.M., Biswas, A.K., Bandyopadhyay, K.K., Misra, A.K., 2007. Soil properties and crop yields on a vertisol in India with application of distillery effluent. Soil & Tillage Research, 92, 60-68.
Iacurci, J., 2015. Humans erode soil 100 times faster than nature. Nature World News, Environment.
21 IPCC, 2007. Climate Change 2007: Mitigation. Contribution of working group III to the fourth assessment report of the intergovernmental panel on climate change [B. Metz, O.R. Davidson, P.R. Bosch, R. Dave, L.A. Meyer (Ed.)]. Cambridge University Press, Cambridge, United Kingdom and New York, NY, USA.
Jones, R.J.A., Hiederer, R., Rusco, E., Loveland, P.J., Montanarella, L., 2004. Estimating organic carbon in the soils of Europe for policy support. European Journal of Soil Science, 56, 655-671.
Kirshbaum, M.U.F., 1995. The temperature dependence of soil organic matter decomposition and the effect of global warming on soil organic storage. Soil Biology and Biochemistry, 27(6), 753-760.
Kotschi, J., 2015. A soiled reputation: Adverse impacts of mineral fertilizers in tropical agriculture. Heinrich Böll Foundation and WWF Germany, 1-58.
Kolahchi, Z., Jalali, M., 2007. Effect of water quality on the leaching of potassium from sandy soil. Journal of Arid Environments, 68(4), 624-639.
Larchevêque, M., Baldy, V., Montès, N., Fernandez, C., Bonnin, G., Ballini, C., 2006. Short-term effects of sewage-sludge compost on a degraded Mediterranean soil. Soil Science Society of America Journal, 70, 1178-1188.
Lehmann J., Schroth G., 2003. Nutrient leaching. Trees, crops and soil fertility: concepts and research methods, 151-166.
Li, Y.C., Stoffella, P.J., Alva, A.K., Calvert, D.V., Graetz, D.A., 1997. Leaching of Nitrate, Ammonium, and Phosphate From Compost Amended Soil Columns. Compost Science & Utilization, 5(2), 63-67.
Loehr, R.C., 1974. Environmental impact. Agricultural waste management: problems, processes and approaches, 46-94.
Neira K., Jeison D., 2010. Anaerobic co-digestion of surplus yeast and wastewater to increase energy recovery in breweries. Water Science and Technology, 61, 1129-1135.
Ontl, T.A., Schutle, L.A., 2012. Soil carbon storage. Nature Education Knowledge 3(10), 35. Pita V., Vasconcelos E., Fangueiro D., Cabral F., Ribeiro H.M., 2010. Carbon and nitrogen mineralization of organic wastes from sugarcane distilleries: vinasse and yeast waste. Treatment and use of non-conventional organic residues in agriculture, UTL Repository.
22 Rezende, L.A., Assis, L.C., Nahas, E., 2004. Carbon, nitrogen and phosphorus mineralization in two soils amended with distillery yeast. Bioresource Technology, 94, 159-167.
Riebeek H., 2011. The carbon cycle. Feature articles, NASA.
Rosolem, C.A., Sgariboldi, T., Garcia, R.A., Calonego, J.C., 2010. Potassium leaching as affected by soil texture and residual fertilization in tropical soils. Communications in soil science and plant analysis, 41(16), 1934-1943.
Shen, J., Yuan, L., Zhang, J., Li, H., Bai, Z., Chen, X., Zhang, W., Zhang, F., 2011. Phosphorus dynamics: from soil to plant. American Society of Plant Biologists, 156, 997-1005.
Sparks, D.L., 2001. Dynamics of K in Soils and Their Role in Management of K Nutrition. Advances in Soil Science: Potassium Dynamics in Soils, 6, 1-63.
UNEP-IETC/ILEC, 2001. Groundwater: Water flowing under the land surface. Lakes and reservoir: The watershed: Water from mountains into the sea, 2, 26-30.
Yaalon, D.H., 1997. Soils in the Mediterranean region: what makes them different?. CATENA, 28(3-4), 157-169.
Zhang, L., Ding, X., Chen, S., He, X., Zhang, F., Feng, G., 2014. Reduction carbon: phosphorus ratio can enhance microbial phytin mineralization and lessen competition with maize for phosphorus. Journal of Plant Interaction, 9(1), 850-856.
Zupančič, G.D., Grilc, V., 2012. Anaerobic treatment and biogas production from organic waste. Management of organic waste, Dr. Sunil Kumar (Ed.).
23
24
Assessment of the environmental impact of yeast waste application to soil: an integrated approach
Ricardo Mata1, Sandro Ratinho2, David Fangueiro1*
1LEAF, Instituto Superior de Agronomia, Universidade de Lisboa, Tapada da Ajuda, 1349-017
Lisboa, Portugal
2Lallemand Ibéria, S.A.
*corresponding author: [email protected]
Abstract
The yeast production industry (e.g. distillery, brewing, baking industries) has been growing globally over the last years generating a large amount of sub-products. Laboratory experiments, under controlled conditions, were performed to investigate the impact of yeast waste application to a sandy texture soil. Experimental treatments were: surface application of yeast and yeast (CMSs and CMSds), surface application of yeast and decanted-yeast followed by incorporation in the 0-5 cm soil layer (CMSm and CMSdm), surface application of ammonium nitrate (AN) (not applied in short-term experiment) and a control (soil only) (CTR). The amount of yeast applied was 2 g in the short-term experiment and equivalent to 170 kgN.ha-1 in the long-term experiment. A short-term (38-day period) leaching experiment
was performed with 5 weekly irrigation events (5 treatments × 3 replications) to assess N, P, K losses. Results showed that yeast application increased NH4+, PT and KT leaching relative
to control while decreased NO3- leaching relative to a high initial content of control, during first
irrigation events. Incorporation treatments increased NH4+, NO3- and PT losses earlier. KT
losses were higher in surface treatments. A long-term leaching experiment (73-day period) with 6 irrigation events every two weeks was performed (6 treatments × 4 replicates) to assess N, P losses. A two parallel incubation experiment (6 treatments × 3 replicates) were simultaneously performed to measure GHG emissions (CO2, N2O, CH4) and to assess the N
mineralization in each treatment. Results showed that yeast application increased initial NH4+
concentration in leachates and soil relative to control and NO3- increased afterwards. N2O and
25 treatment emissions were very similar to control but had a small increase of N2O. CH4
emissions were insignificant. The global warming potential (GWP) of yeast and AN were 6× and 2× times higher than control, respectively.
Keywords: Yeast, soil, groundwater, pollution, greenhouse gases
A. Introduction
Earth is a dynamic planet covered with life-sustaining air, water and soil that are in constant energetic and material interaction. The environmental quality depends on the waste management as a source of nutrients for soil, leading to improvement of their physical, chemical and biological properties. The impact of nutrient management is more focused in the area of water quality (Brady and Weil, 2002) due to runoff and infiltration to groundwater of pollutions such as nitrates and phosphorus, but also in the atmospheric compartment due to the issue of greenhouse gaseous effects.
The Mediterranean area is typically characterized as having a degraded soil exposed to large climatic variations, low content of P, N and organic matter, particularly in topsoil, and consequently eroded. (Larchevêque et al., 2006; Diacono and Montemurro 2010). The intensive use of mineral fertilizers in agricultural practice is not only responsible for the environmental degradation but as well as by the decrease of organic matter and deleterious effects on crop growth. Organic wastes with high organic content are an excellent potential source of plant nutrients, particularly potassium and nitrogen, which may be applied as an organic fertilizer thereby reducing landfill disposal and ensuring the recycling of nutrients and soil fertility (Alvarenga et al., 2015; Rezende et al., 2004). On the other hand, there is a concern about environmental pollution on the defective implementation of this type of waste in the environmental due to its high organic content and low pH (Pita et al., 2010). Sometimes undesired substances can be found in these wastes, such as heavy metals and pathogens, which will lead to a greater negative impact on the quality of agricultural products, biodiversity and human health (Alvarenga et al., 2015). As nutrients contents can be high in some of these wastes (Li et al., 1997), its application at high rates may lead to contamination of groundwater by nutrients not absorbed by plants. Nitrate is highly mobile in soil due its insignificant interaction to the negative charged matrix. According to the Nitrate Directive (91/676/CEE), groundwater courses are considered polluted if nitrate levels reached 50 mg.L-1, corresponding
to the maximum allowable value. Ammonium concentrations in soil solution normally are very low due its high retention but can increase in soils with a sandy texture and low
cation-26 exchange capacity (Fangueiro et al., 2014). The concern about phosphorus losses from arable soils has increased, particularly in marine habitats, due the eutrophication in freshwater systems, promoting algae and aquatic weed growth. However, P losses by leaching are neglected due to the large retention capacity of P of most soils, and even with large amounts of water’s input (Fortune et al., 2005). Furthermore, phosphorus dynamics depend highly on pH levels. At low pH levels, phosphate can be adsorbed by iron (Fe) and aluminum (Al) oxides (particles with anion exchange capacity). On the other hand, in alkaline soils tend to form compounds with Calcium (Ca). Potassium is a mobile ion in soils and consequently significant amounts can be lost by leaching. Leaching of K is often a problem on sandy soils due its low clay content and poor interaction of K+ with the soil matrix. Losses of K+ depends mainly on
the CEC, soil texture, pH and Calcium concentrations. Normally, a low potassium leaching is observed at pH levels between 6-6.5 (Sparks, 2001) due to enhanced substitution of K for Ca by its competition in the leaching water and the amount of water that passes through the soil. Greenhouse gases from human activities are the most significant driver of observed climate change since the mid-20th century (IPCC, 2013). Gaseous emissions such as carbon dioxide, nitrous oxide and methane are the three of the main greenhouse gases contributing to ecosystems change and global warming (Fangueiro et al., 2012) and most of emissions comes from the agricultural and livestock sector due the use of synthetic fertilizers and biological processes (FAO, 2016). Indeed, biological processes these sectors and other sources (e.g. swamp gas) are the largest responsible for the strongly increase of global methane levels in atmosphere. Agriculture practice, including food systems, is responsible for about one-third of GHG emissions, and climate change probably will cause yields drop (Gilbert, 2012). Under aerobic conditions, N2O gets special attention in agricultural activities due the application of
wastes with high nitrogen content plus environmental conditions.
Yeast waste is obtained from the processing and separation of yeast from must, rich in proteins, carbohydrates, vitamins and some minerals, generated during the alcoholic fermentation. Molasses from beet or cane is the main raw material used to supply the necessary sugar to the development of yeast cells. Previous studies concluded that yeast applied in soil can be a great source of nutrients for plant growth (Pita et al., 2010) leading to a mineralization of organic compounds. However, due its high organic content and labile carbon, yeast can stimulated CO2 production (Rezende et al., 2004) and increase nitrate and
phosphorus leaching. Electrical conductivity can also be high in some yeast wastes and its indiscriminate use may affect the physical and chemical properties of soil (Hati et al., 2007).
27 The main objective of this study was to assess the impact of two yeast wastes (CMS and decanted CMS) application to an acidic sandy textured soil sandy, the potential leaching of nutrients through soil columns in two independent experiments (short and long-term), as well as the nitrogen mineralization in soil and greenhouse gas emissions in an aerobic incubation. A secondary objective was to compare the difference between the surface application of yeast waste and the surface application followed by incorporation in the 0-5 cm soil layer.
28 B. Materials and methods
B.1. Soil and yeast waste
The soil was collected in Palmela, Portugal, in an agricultural field not fertilized since more than ten years, classified according to World Reference Base (WRB) as Haplic arenosol, equivalent to regosol in ‘Serviço de reconhecimento e ordenamento agrário (SROA)’ classification, with coarser texture than sandy loam to at least 100 cm, without fluvic or ‘ândicas’ properties. Disturbed soil columns were used for the short-term leaching experiment while undisturbed soil columns were used in the long-term leaching experiment. The soil used in the aerobic incubation and short-term leaching experiment was air dried, sieved at 2 mm and then stored until used. The main characteristics of the soil are presented in Table 1.
Table A1 - Physical-chemical analysis of soil sample
Characteristic Unit Value
Soil particle size Clay g.kg-1 33 Silt g.kg-1 45 Sand g.kg-1 922 Organic C g.kg-1 8.8 Bulk density g.cm-3 1.49 Porosity cm3.cm-3 0.48 WFPS g.kg-1 220 pH H2O 5.71 CEC Cmolc.kg -1 2.94 Base saturation % 93.6 EC g.kg-1 74.5 Total N g.kg-1 0.92 NH4+-N mg.kg-1 7.5 NO3--N mg.kg-1 43.38 Corg:N 9.57