UNIVERSIDADE DO ALGARVE
FACULDADE DE CIÊNCIAS DO MAR E DO AMBIENTE
POLYCYCLIC AROMATIC HYDROCARBONS AND OXIDATIVE STRESS
MARKERS IN THE CLAM Ruditapes decussatus FROM THE RIA
FORMOSA (PORTUGAL)
(Tese definitiva para a obtenção do grau de doutor no ramo de Ciências e Tecnologias do Ambiente, especialidade de Ambiente Aquático)
LUÍSA PAULA VIOLA AFONSO BARREIRA
Orientador: Doutora Maria João da Anunciação Franco Bebianno
Constituição do Júri:
Presidente: Doutor João Pinto Guerreiro Vogais: Doutora Michèle Roméo
Doutora Maria Ana Dias Monteiro Santos
Doutora Maria João da Anunciação Franco Bebianno Doutora Ana Maria de Lima Viegas Gonçalves Crespo Doutora Maria Antónia Santos Mendes Salgado Doutora Alexandra Maria Francisco Cravo Engenheira Ana Maria Alves Ferreira
FARO
2007
ACKOWLEDGEMENTS
Este trabalho beneficiou da contribuição de várias pessoas, às quais gostaria de agradecer.
Em primeiro lugar, à minha orientadora a Professora Doutora Maria João Bebianno (Universidade do Algarve – Portugal) agradeço ter-me iniciado em áreas de investigação tão fascinantes como a Ecotoxicologia e a Química Ambiental. As suas ideias e correcções foram imprescindíveis ao bom termo deste trabalho.
To Professor Stephen Mudge (University of Wales – United Kingdom) for the scientific advisement, the encouragement, the most helpful statistical discussions and for always being available.
À Doutora Cinta Porte (CSIC – Spain) pelo apoio científico nas análises químicas e bioquímicas efectuadas neste trabalho.
À Professora Doutora Paz García Martínez (Universidade de Santiago de Compostela – Spain) pelo apoio na determinação das actividades de enzimas antioxidantes.
Ao Sr. José Magro pelo imprescídivel apoio nas amostragens. A sua boa disposição, mesmo nas piores condições metereológicas, ajudou a superar as mais variadas complicações surgidas.
Aos meus colegas e amigos do Grupo de Ecotoxicologia e Química do Ambiente (Ângela Serafim, Rui Company, Alexandra Cravo, Alexandra Marques, Cristina Ferreira, Belisandra Lopes, Denise Fernandes, Ana Paulino e Helena Felícia) agradeço as muitas discussões científicas, o imenso apoio, amizade e sobretudo a alegria que é trabalhar ao seu lado.
Aos meus amigos e colegas de gabinete, Dina Simes e Pedro Rodrigues pelo carinho e preocupação demonstrados e sobretudo pela sua boa disposição. O seu apoio foi fundamental para o bom encaminhamento deste trabalho.
Finalmente à minha família e amigos agradeço o apoio e a certeza de que eu seria capaz de acabar. Ficarei para sempre em dívida com o meu marido, Carlos e a minha filha, Beatriz, aos quais dedico este trabalho, pela sua compreensão, infinita paciência e encorajamento sempre que foram necessários.
NOME: Luísa Paula Viola Afonso Barreira
FACULDADE: Faculdade de Ciências do Mar e do Ambiente
ORIENTADOR: Maria João Bebianno
DATA: 10/04/2007
TÍTULO DA TESE: Polycyclic Aromatic Hydrocarbons and Oxidative Stress Markers in
the clam Ruditapes decussatus from the Ria Formosa (Portugal)RESUMO
Este trabalho envolveu o estudo de hidrocarbonetos aromáticos policíclicos (PAHs) na amêijoa Ruditapes decussatus da Ria Formosa, bem como a sua relação com marcadores de stress oxidativo. A variação espacial e sazonal da concentração e possíveis fontes de PAHs foi avaliada nos sedimentos superficiais e na parte edível da amêijoa, tendo as variações sazonais sido as mais importantes. A actividade de enzimas antioxidantes e a peroxidação lipídica (LPO) na glândula digestiva da amêijoa foram também mais afectadas por factores sazonais do que espaciais. A Superóxido Dismutase (SOD) e a Catalase (CAT) não apresentaram qualquer relação com a concentração de PAHs, parecendo a CAT estar particularmente relacionada com o ciclo reprodutivo da amêijoa. Por outro lado, as Glutationo Peroxidases (GPx) e LPO apresentaram uma relação inversa com a concentração destes compostos, o que pode estar relacionado com um estado precário dos organismos associado a toxicidade dos PAHs, embora não se tenham observado danos oxidativos.
De modo a clarificar a relação entre os PAHs e os parâmetros de stress oxidativo procedeu-se ao transplante de amêijoas entre diferentes locais, tendo-se observado uma acumulação significativa de PAHs nestes organismos. As actividades da Benzo[a]pireno Hidroxilase (BPH) e Glutationo S-Transferase (GST) na glândula digestiva aumentaram em resposta ao aumento da concentração de PAHs nos tecidos da amêijoa confirmando a metabolização de PAHs neste tecido. A exposição e o metabolismo de PAHs levaram também à indução de stress oxidativo com o consequente aumento na actividade de SOD citosólica e T GPx nas brânquias e da actividade da SOD mitocôndrial e da CAT na glândula digestiva juntamente com um aumento de peroxidação lipídica.
Assim, conclui-se que as enzimas antioxidantes não são bons biomarcadores de exposição a PAHs em R. decussatus, enquanto que a BPH, a GST e LPO revelam algum potencial devendo no entanto ser estudada a sua variação sazonal.
Palavras-chave: Hidrocarbonetos aromáticos policíclicos; enzimas antioxidantes;
biomarcadores; Ruditapes decussatus; Ria Formosa; transplante.Polycyclic Aromatic Hydrocarbons and Oxidative Stress Markers in the clam
Ruditapes decussatus from the Ria Formosa (Portugal)
ABSTRACT
Polycyclic aromatic hydrocarbons (PAHs) were studied in clams Ruditapes decussatus from the Ria Formosa lagoon as well as their relationship with oxidative stress markers. Both the seasonal and spatial variations of PAHs levels and their sources were assessed in surface sediments and clam whole soft tissues. PAHs concentrations and sources were seasonal rather than spatial dependent in the two compartments as well as antioxidant enzymes activities and lipid peroxidation levels (LPO) in the clam digestive glands. Superoxide dismutase (SOD) and Catalase (CAT) were not related to the PAHs concentrations, instead, CAT was probably more related to the clam reproductive cycle. Glutathione peroxidases (GPxs) and LPO were negatively related to PAHs concentrations which may indicate a precarious state of the exposed clams associated with PAHs toxicity although not causing membrane oxidative damage. A transplant experiment was planned to clarify PAHs metabolism and effects on these parameters. Significant PAHs accumulation was observed accompanied by inductions of Benzo[a]pyrene Hydroxylase (BPH) and Glutathione S-Transferase (GST) in the digestive gland of clams, indicating PAHs metabolisation by clams. PAHs exposure and metabolisation induced also oxidative stress in both the gills and digestive gland which caused increases in Cyt SOD and T GPx activities in the gills and Mit SOD and CAT activities and in LPO products in the digestive gland.
Therefore, antioxidant enzymes were not considered effective biomarkers of PAHs exposure in R. decussatus while BPH, GST and LPO reveal some potential although their seasonal variation should be studied in this species.
Keywords: Polycyclic aromatic hydrocarbons; antioxidant enzymes; Ruditapes decussatus;
biomarkers; Ria Formosa; transplantation.INDEX
ACKOWLEDGEMENTS ________________________________________________________________ III RESUMO_______________________________________________________________________________ V ABSTRACT ___________________________________________________________________________VII INDEX ________________________________________________________________________________VII FIGURE INDEX________________________________________________________________________XIITABLE INDEX_______________________________________________________________________ XVII
ABBREVIATIONS AND ACRONYMS_____________________________________________________ XX
1. GENERAL INTRODUCTION _________________________________________________________1
1.1. POLYCYCLIC AROMATIC HYDROCARBONS______________________________________________3
1.1.1. Physico/chemical properties______________________________________________________3
1.1.2. Formation and sources __________________________________________________________3
1.1.3. Polycyclic Aromatic Hydrocarbons in seawater ______________________________________9
1.1.4. Polycyclic Aromatic Hydrocarbons in sediments _____________________________________12
1.1.5. Polycyclic Aromatic Hydrocarbons in marine organisms ______________________________13
1.2. BIOTRANSFORMATION____________________________________________________________17
1.3. OXIDATIVE STRESS ______________________________________________________________22
1.3.1. Reactive Oxygen and Nitrogen Species ____________________________________________23
1.3.2. Oxidative Damage ____________________________________________________________25 A. Protein Oxidation ______________________________________________________________________ 26 B. DNA Oxidation ________________________________________________________________________ 26 C. Lipid Peroxidation _____________________________________________________________________ 26 1.3.3. Antioxidant Defences __________________________________________________________29 A. Superoxide Dismutases __________________________________________________________________ 30 B. Catalase ______________________________________________________________________________ 31
C. Glutathione Peroxidases _________________________________________________________________ 34 1.4. BIOMARKERS __________________________________________________________________ 35
1.5. THE RIA FORMOSA LAGOON_______________________________________________________ 40
1.6. THE CLAM Ruditapes decussatus ___________________________________________________ 45
1.7. OBJECTIVE ____________________________________________________________________ 47
2. POLYCYCLIC AROMATIC HYDROCARBONS IN THE SEDIMENTS ___________________ 51
2.1. INTRODUCTION_________________________________________________________________ 53
2.2. MATERIALS AND METHODS _______________________________________________________ 55
2.2.1. Sampling ___________________________________________________________________ 55
2.2.2. PAHs sediment analysis _______________________________________________________ 57
2.2.3. Organic carbon content________________________________________________________ 61
2.2.4. Statistical Analysis____________________________________________________________ 61
2.3. RESULTS______________________________________________________________________ 63
2.4. DISCUSSION ___________________________________________________________________ 75
3. POLYCYCLIC AROMATIC HYDROCARBONS IN THE CLAM Ruditapes decussatus _______ 81
3.1. INTRODUCTION_________________________________________________________________ 83 3.2. MATERIALS AND METHODS _______________________________________________________ 85
3.2.1. Sampling ___________________________________________________________________ 85
3.2.2. PAHs tissue analysis __________________________________________________________ 85
3.2.3. Tissue lipid content ___________________________________________________________ 88
3.2.4. Statistical Analysis____________________________________________________________ 88
3.3. RESULTS______________________________________________________________________ 88 3.3.1. PAHs concentrations in the clams whole soft tissues _________________________________ 88 3.3.2. Relationship between PAHs concentrations in clam whole soft tissues and sediments ______ 103
3.4. DISCUSSION __________________________________________________________________ 110
4. OXIDATIVE STRESS IN THE DIGESTIVE GLAND OF THE CLAM Ruditapes decussatus __ 119
4.1. INTRODUCTION________________________________________________________________ 121
4.2.1. Sampling ___________________________________________________________________123 4.2.2. Tissues preparation __________________________________________________________124 4.2.3. Biochemical Analysis _________________________________________________________125 A. Superoxide Dismutase__________________________________________________________________ 125 B. Catalase _____________________________________________________________________________ 126 C. Glutathione Peroxidases ________________________________________________________________ 126 D. Total protein _________________________________________________________________________ 127 E. Lipid Peroxidation ____________________________________________________________________ 127 4.2.4. Statistical Analysis ___________________________________________________________127 4.3. RESULTS______________________________________________________________________128 4.3.1. Antioxidant Enzymes__________________________________________________________128 A. Superoxide Dismutase__________________________________________________________________ 128 B. Catalase _____________________________________________________________________________ 132 C. Total Glutathione Peroxidase ____________________________________________________________ 135 D. Se dependent Glutathione Peroxidase______________________________________________________ 137 E. Lipid Peroxidation ____________________________________________________________________ 139
4.3.2. Relationship between antioxidant enzymes and lipid peroxidation in Ruditapes decussatus digestive gland _____________________________________________________________________140
4.3.3. Relationship between Oxidative Stress and PAHs ___________________________________141
4.4. DISCUSSION___________________________________________________________________145
5. POLYCYLIC AROMATIC HYDROCARBONS ACCUMULATION AND RELATED
OXIDATIVE STRESS BIOMARKERS IN A TRANSPLANT EXPERIMENT IN THE RIA FORMOSA LAGOON _____________________________________________________________________________153
5.1. INTRODUCTION_________________________________________________________________155 5.2. MATERIALS AND METHODS_______________________________________________________157
5.2.1. Experimental design __________________________________________________________157
5.2.2. Physiological status of transplanted organisms _____________________________________158
5.2.3. Tissue preparation ___________________________________________________________158
5.2.4. Chemical analysis ____________________________________________________________159
5.2.5. Biochemical Analyses _________________________________________________________159
5.2.7. Glutathione S-transferase _____________________________________________________ 160 5.2.8. Statistical Analysis___________________________________________________________ 160 5.3. RESULTS_____________________________________________________________________ 161 5.3.1. Physiological status__________________________________________________________ 161 5.3.2. PAH concentrations__________________________________________________________ 162 A. Transplant Experiment _________________________________________________________________ 162 B. Backtransplant Experiment _____________________________________________________________ 170 5.3.3. Biochemical Parameters ______________________________________________________ 176 A. Transplant Experiment _________________________________________________________________ 176 B. Backtransplant Experiment _____________________________________________________________ 182
5.3.4. Relationship between PAHs concentrations and biochemical parameters ________________ 187
A. Transplant Experiment _________________________________________________________________ 187 B. Backtransplant Experiment _____________________________________________________________ 190 5.4. DISCUSSION __________________________________________________________________ 192
5.4.1. Transplant Experiment _______________________________________________________ 192
5.4.2. Backtransplant Experiment ____________________________________________________ 197
6. GENERAL DISCUSSION AND CONCLUSIONS ______________________________________ 201
REFERENCES ________________________________________________________________________ 215
FIGURE INDEX
1. Introduction
Figure 1.1 – Overview of benzo[a]pyrene detoxification. Adapted from Sheehan et al. (2001) 18
Figure 1.2 – Benzo[a]pyrene hydroxylation by the cit P450 oxygenase system. Benzo[a]pyrene binds first to oxidized cytochrome P450 (Fe3+) and iron is reduced in the resulting complex to cytochrome P450 (Fe2+) which than interacts with oxygen producing 3-hydroxybenzo[a]pyrene, and regenerating the oxidized cytochrome P450. The reduction of the substrate-oxidized cytochrome P450 complex involves the donation of two electrons from NADPH and is carried by NADPH cytochrome P450 reductase. The superoxide anion (O2-) is formed during this reaction participating in the hydroxylation of the substrate. Adapted from Lee (1981) 19
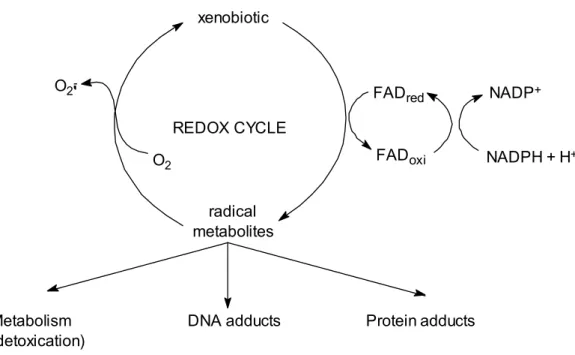
Figure 1.3 – Redox cycling of xenobiotic compounds. Adapted from Di Giulio et al. (1995) 22
Figure 1.4 – Scheme of arachidonic acid lipid peroxidation (C20:4). Initial abstraction of an allylic H from at one of three (C-13) positions is shown. H can also be abstracted at C-10 or C-7, giving several other peroxide end-products. R1 = CH2-CH-CH-(CH2)3COOH, R2 = C5H11, R3 = (CH2)3COOH. Adapted from Halliwell &
Gutteridge (1999) 27
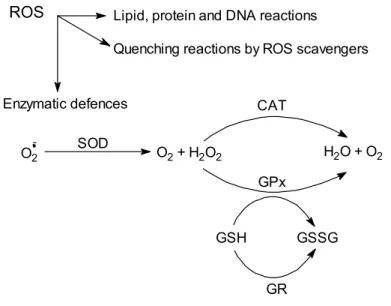
Figure 1.5 – Scheme of free radical defence mechanisms. Adapted from Di Giulio et al. (1995) 30
2. Polycyclic Aromatic Hydrocarbons in sediments
Figure 2.1 – Sample locations in the Ria Formosa 56
Figure 2.2 – Eluent gradient 58
Figure 2.3 – Chromatogram of standard composed of the 16 PAHs. Co-elution of acenaphthene and fluorene
is marked 58
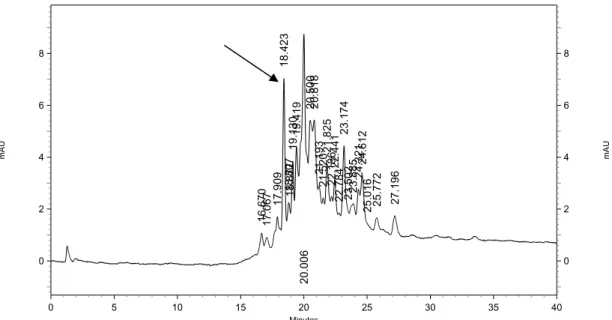
Figure 2.4 – Chromatogram of a representative sediment sample. Phenanthrene peak is marked 59
Figure 2.5 – Seasonal and spatial variation (mean ± standard deviation) of tPAH concentrations in sediments from different sites from the Ria Formosa. Bars labelled with the same letter are not statistically different (p <
0.05). n.a. – data not available 64
Figure 2.6 – Sediment distribution pattern of individual PAHs grouped by number of aromatic rings. n.a. –
Figure 2.7 – Relationship between sediment tPAH concentration (ng g-1 d.w.) and their organic content,
OC (%) 67
Figure 2.8 – PCA of the individual PAH (as a proportion of tPAH) in the sediments, showing the loadings on PC1 and PC2. PC1 represents 41.7% of the variance and PC2 26.9% of the total variance of the data, both being significant (p<0.05; n = 36). Data were log transformed and autoscaled 68
Figure 2.9 – PCA of the individual PAHs as a proportion of the tPAH, in the sediments, showing the data
scores labelled as month of sampling 69
Figure 2.10 – PCA of the individual PAH as a proportion of the tPAH, in the sediments, showing the data scores labelled as sampling site number. Colours indicate sampling month 70
Figure 2.11 – P/A versus Fluo/Py ratio for the sediment samples 72
Figure 2.12 – Partial Least Squares analyses of the PAH signatures in the sediment data (15 observations; 91
variables). Nineteen different PAHs source signatures, taken from the literature were used to develop the
X-block 73
3. Polycyclic Aromatic Hydrocarbons in the clam Ruditapes decussatus
Figure 3.1 – Chromatogram of a representative clam sample (from Site 5). Phenanthrene peak is marked 86
Figure 3.2 – Spatial and seasonal variation of tPAH concentrations (ng g-1 w.w.) in clam whole soft tissues. Bars labelled with the same letter are not statistically different(p<0.05) (n.a. – data not available) 89
Figure 3.3 – Distribution pattern of the individual PAHs grouped by number of aromatic rings in the clam
whole soft tissues (n.a. – data not available). 92
Figure 3.4 – Monthly mean lipid content (%) in the clam whole soft tissues from all sites. Error bars are standard deviation. Bars labelled with the same letter are not statistically different(p<0.05) 94
Figure 3.5 – PCA of the individual PAH as a proportion of the tPAH, in the whole soft tissue of the clams
Ruditapes decussatus, showing the loadings on PC1 and PC2. PC1 represents 33.5% and PC2 24.7% of the total
variance in the data, both being significant (p<0.05; n = 65). Data was centred and log transformed 95
Figure 3.6 – PCA of the individual PAH as a proportion of the tPAH, in the clams Ruditapes decussatus,
showing the data scores labelled by month 96
Figure 3.7 – PCA of the individual PAH as a proportion of the tPAH accumulated in the clams Ruditapes
decussatus, showing the data scores labelled by site number. Different colours were attributed to the sampling
Figure 3.8 – Partial Least Squares analyses of the PAH signatures in the clams whole soft tissues (15
observations; 92 variables). Nineteen different PAH signatures, taken from the literature were used to develop
the X-block (see Section 2.2 for further details) 100
Figure 3.9 – Benzo[a]pyrene equivalents obtained for PAHs in clams tissues. The broken line represents the safety level for human consumption of shellfish (10 ng g-1 w.w.) and the upper line the maximum allowed (45
ng g-1 w.w.) 102
Figure 3.10 – Relationship between log tPAH concentrations in the sediments versus log tPAH concentrations in the clam whole tissues. The circle indicates the August II data (not included in the
relationship) 103
Figure 3.11 – Relationships between log BSAF and log Kow in the different sampling months. A – Jan, Mar,
May and Jul; B – Jun; C – Aug 105
Figure 3.12 – Partial Least Squares analysis using the sediments PAHs signature as X-block (15
observations; 71 variables). Bars show the amount of variance within the clam data explained (grey) and
predicted (white) by the sediments. Data were not transformed 106
Figure 3.13 – PLS XY score plots for Principal Component 1 107
Figure 3.14 – PLS XY score plots for Principal Component 1 excluding Ch and BaA data 108
Figure 3.15 – Partial Least Squares analysis using the clams PAH signature as X-block and sediments as Y-block (15 observations; 71 variables). Bars show the amount of variance within the sediments data explained (grey) and predicted (white) by the clams. Data were not transformed 109
4. Oxidative Stress in the digestive gland of the clam Ruditapes decussatus
Figure 4.1 – Spatial and seasonal variation of mitochondrial (grey) and cytosolic (open) SOD activity (mean±standard deviation) in the digestive gland of Ruditapes decussatus (bars labelled with the same letter are not statistically different). n.a. – data not available 129
Figure 4.2 – Spatial and seasonal variation of CAT activity (mean±standard deviation) in the digestive gland of Ruditapes decussatus (bars labelled with the same letter are not statistically different). n.a. – data not
available 133
Figure 4.3 – Spatial and seasonal variation of T GPx activity (mean±standard deviation) in the digestive gland of Ruditapes decussatus (bars labelled with the same letter are not statistically different). n.d. – not
detected; n.a. – data not available 136
Figure 4.4 – Spatial and seasonal variation of Se GPx activity (mean±standard deviation) in the digestive gland of Ruditapes decussatus (bars labelled with the same letter are not statistically different). n.d. – not
Figure 4.5 – LPO in the digestive gland of Ruditapes decussatus (bars labelled with the same letter are not
statistically different) 140
Figure 4.6 – PLS weights plot of the individual PAHs concentrations (X-variables) and the stress related parameters (Y-variables). The first component explained 43.2% and the second component 10.9% of the
variance in the data (n = 65 observations) 143
Figure 4.7 – Overview plot showing the individual cumulative R2 (explained variation –grey bars) and Q2
(predicted variation – open bars) for the Y-variables, using the individual PAHs concentrations as the
X-variables 144
Figure 4.8 – PLS weights plot of the individual PAHs proportions (X-variables) and the stress related
parameters (Y-variables) (n = 65) 145
5. Polycyclic Aromatic Hydrocarbons accumulation and related biomarkers
in transplantation experiments
Figure 5.1 – Variation (mean ± SD) of tPAH concentration (ng g-1 w.w.) in the whole soft tissues of the clams from site 5 and transplanted to site 7. Significant differences between sites are marked with * 163
Figure 5.2 – Variation (mean ± SD) of PAH concentrations (ng g-1 w.w.) according to aromatic ring number in the whole soft tissues of clams from site 5 and transplanted to site 7. Significant differences between sites are
marked with * 164
Figure 5.3 – Variation (mean ± SD) of individual PAH concentrations (ng g-1 w.w.), in whole soft tissue of the clams from site 5 and transplanted to site 7. Significant differences between sites are marked with * 166
Figure 5.4 – Variation (mean ± SD) of tPAH concentration (ng g-1 w.w.) in clams from site 5 and those backtransplanted from site 7 to site 5. Significant differences between sites are marked with * 170
Figure 5.5 – Variation (mean ± SD) of PAH concentrations (ng g-1 w.w.) according to aromatic ring number in the whole soft tissues of clams from site 5 and backtransplanted from site 7 to site 5. Significant differences
between sites are marked with * 172
Figure 5.6 – Variation (mean ± SD) of individual PAH concentrations (ng g-1 w.w.), in the whole soft tissue of clams from site 5 and backtransplanted from site 7 to site 5. Significant differences between sites are marked
with * 174
Figure 5.7 – Antioxidant enzymes activity (mean ± SD) in the gills (G) and digestive gland (DG), of clams from site 5 and transplanted to site 7. Significant differences between activity in clams from both sites are
marked with * (p<0.05) 177
Figure 5.8 – BPH and GST activities and LPO (mean ± SD) in the gills (G) and digestive gland (DG), of clams from site 5 and transplanted to site 7. Significant differences between activity in clams from both sites are
Figure 5.9 – Antioxidant enzymes activity (mean ± SD) in the gills (G) and digestive gland (DG), of clams from site 5 and backtransplanted from site 7 to site 5. Significant differences between activity in clams from
both sites are marked with * (p<0.05) 183
Figure 5.10 – BPH and GST activities and LPO (mean ± SD) in the gills (G) and digestive gland (DG), of clams from site 5 and backtransplanted from site 7 to site 5. Significant differences between activity in clams
from both sites are marked with * (p<0.05) 186
Figure 5.11 – PLS weights plot of the individual PAHs as concentrations (X-variables) and biochemical parameters (Y-variable) of clams from both sites during the transplant experiment (11 observations; 26
variables). The first component explained 40.2% and the second component 24.7% of the variance in the data
(both significant) 188
Figure 5.12 – Partial Least Squares analysis using the PAH concentrations as X-block. Bars show the amount of variance within the biochemical parameters data explained (dark grey) and predicted (open bars) by
the PAHs in the transplant experiment 189
Figure 5.13 – PLS weights plot of the individual PAHs as concentrations (X-variables) and biochemical parameters (Y-variable) of clams from both groups during the backtransplant experiment (10 observations; 26
variables). The first component explained 34.4% and the second component 32.5% of the variance in the data
(both significant) 190
Figure 5.14 – Partial Least Squares analysis using the PAH concentrations as X-block. Bars show the amount of variance within the biochemical parameters data explained (dark grey) and predicted (open bars) by the PAHs
TABLE INDEX
1. Introduction
Table 1.1 – Physico/chemical properties of PAHs 4
Table 1.2 – Range of PAH concentrations in the dissolved phase of seawater in different areas of the world (ng l-1). 11
Table 1.3 – PAHs concentrations in the sediments from different locations in Europe. 12
Table 1.4 – tPAH concentrations in bivalve molluscs from several places worldwide 14
Table 1.5 – BCF, BAF and BSAF for PAHs in several organisms 16
Table 1.6 – Benzo[a]pyrene hydroxylase activity range in different bivalve species 20
Table 1.7 – Glutathione S-transferase activity range in different bivalve species 21
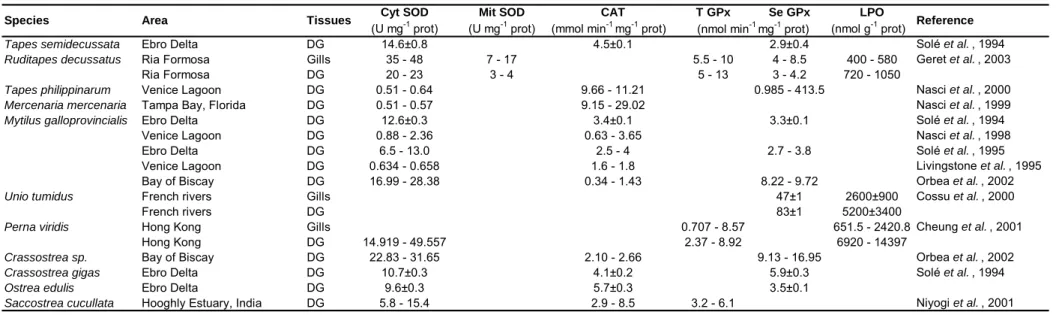
Table 1.8 – Antioxidant enzyme activities and LPO levels in different bivalve species 33
Table 1.9 – Antioxidant enzymes, BPH, GST and LPO in the gills and digestive gland of different bivalves as a response to organic contamination 38
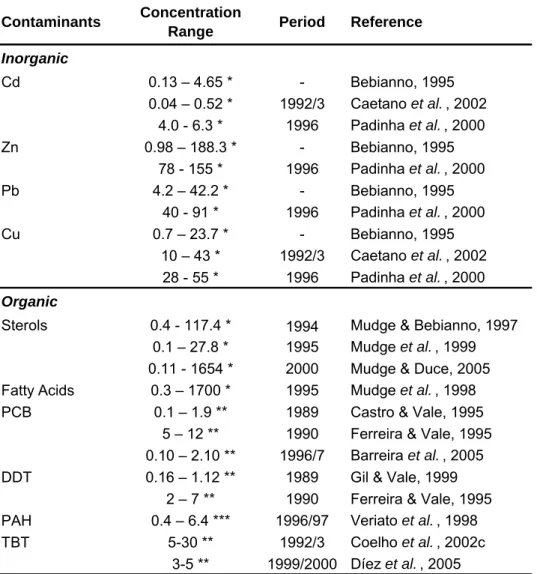
Table 1.10 – Inorganic and organic contaminants in the sediments of the Ria Formosa lagoon 43
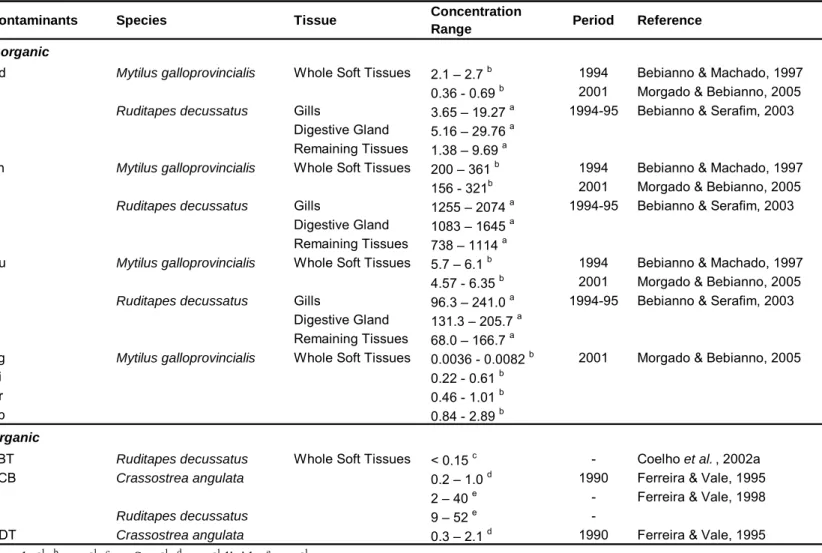
Table 1.11 – Inorganic and organic contaminants in bivalves from the Ria Formosa lagoon 44
2. Polycyclic Aromatic Hydrocarbons in Sediments
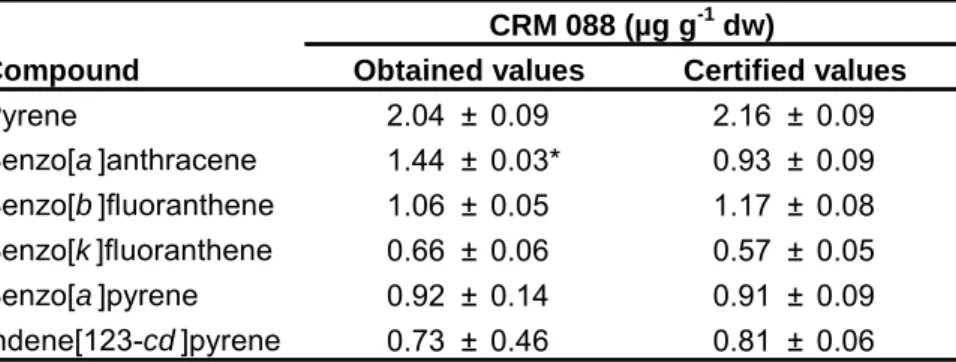
Table 2.1 – Calibration curves for quantification of the 16 PAHs 59Table 2.2 – PAH concentrations in CRM 088 (sewage sludge). Significantly different values are marked 60
Table 2.3 – Detection limits of individual PAHs 61
Table 2.5 – Phenanthrene/Anthracene (P/A), Fluoranthene/Pyrene (Fluor/Py) and Low/High molecular weight
ratios for the sediment samples 71
Table 2.6 – Proportion of PAHs in samples or averages of samples that define the major PAHs sources
analysed 74
3. Polycyclic Aromatic Hydrocarbons in the Clam Ruditapes decussatus
Table 3.1 – PAH concentrations in NIST 2977 (mussel tissue). Significant differences values are marked
with * 87
Table 3.2 – Benzo[a]pyrene (BaP) equivalents for polycyclic aromatic hydrocarbons (PAH). Adapted from
Gilroy (2000) 87
Table 3.3 – Phenanthrene/Anthracene (P/A), Fluoranthene/Pyrene (Fluo/Py) and Low/High molecular weight
PAHs ratios in clam whole soft tissues 98
4. Oxidative Stress in the Digestive Gland of the Clam Ruditapes decussatus
Table 4.1 – Spearman Rank Order Correlation coefficients between antioxidant enzyme activities and MDA concentrations. Significant coefficients (p<0.05) are marked with * 141
5. Polycylic Aromatic Hydrocarbons Accumulation and related oxidative
stress biomarkers in a transplant experiment in the ria formosa lagoon
Table 5.1 – Condition Index (mean ± SD) of the clams 162
Annexe
Table A1 – Water temperature (ºC) 247
Table A2 – Total and individual Polycyclic Aromatic Hydrocarbons (PAHs) concentrations (ng g-1 d.w.) in the sediments from different sites in the Ria Formosa lagoon 249
Table A3 – Ecotoxicological Assessment Criteria 250
Table A4 – PAHs concentrations (ng g-1 w.w.) in the clam whole soft tissues 252
Table A5 – BSAF values of individual PAHs 254
Table A6 – Superoxide dismutase activity (U mg-1 prot) in the digestive gland of Ruditapes decussatus 256
Table A7 – Catalase activity (µmol min-1 mg-1 prot) in the digestive gland of Ruditapes decussatus 257
Table A8 – Total Glutathione Peroxidase (T GPx) and Se dependent Glutathione Peroxidase (Se GPx) activities (nmol min-1 mg-1 prot) in the digestive gland of Ruditapes decussatus 258
Table A9 – Spearman by Ranks Correlation coefficients between antioxidant enzymes activity and lipid peroxidation in the digestive gland of Ruditapes decussatus and PAHs content in the whole soft tissues of clams.
Significant coefficients are marked with * 259
Table A10 – Polycyclic aromatic hydrocarbon (PAH) concentrations (mean±standard deviation) (ng g-1 w.w.), in the edible part of clams at site 5 and transplanted to site 7 260
Table A11 – Polycyclic aromatic hydrocarbon (PAH) concentrations (mean±standard deviation) (ng g-1 w.w.), in the edible part of clams remaining at site 5 and backtransplanted from site 7 to site 5 261
Table A12 – Antioxidant enzyme activities (mean±SD), in the gills and digestive gland of clams from site 5 and transplanted to site 7. Values significantly different from day 0 are marked with * (p<0.05) 262
Table A13 – BPH and GST activities and LPO (mean±SD), in the gills and digestive gland of clams from site 5 and transplanted to site 7. Values significantly different from day 0 are marked with * (p<0.05) 263
Table A14 – Antioxidant enzyme activities (mean±SD), in the gills and digestive gland of clams from site 5
and backtransplanted from site 7 to site 5 264
Table A15 – BPH and GST activities and LPO (mean±SD), in the gills and digestive gland of clams from site
ABBREVIATIONS AND ACRONYMS
4- HNE 4-hydroxyalkenals
A Anthracene
Ac Acenaphthene
Ace Acenaphthylene
AChE Acetyl Cholinesterase
AsPx Ascorbate peroxidase
BaA Benzo[a]anthracene
BAF Bioaccumulation Factor
BaP Benzo[a]pyrene BbF Benzo[b]fluoranthene BCF Bioconcentration Factor BkF Benzo[k]fluoranthene BPer Benzo[g,h,i]perylene BPH Benzo[a]pyrene Hydroxylase
BSA Bovine serum albumin
BSAF Biota-sediment Accumulation Factor
CAT Catalase
CDNB 1-chloro-2,4-dinitrobenzene
Ch Chrysene
CI Condition Index
Cu/Zn SOD Copper and zinc containing superoxide dismutase Cyt P450 Cytochrome P450
Cyt SOD Cytosolic SOD
DBA Dibenzo[a,h]anthracene
DCM Dichloromethane
DDT Dichlorodiphenyltrichloroethane
DG Digestive Gland
DNA Deoxyribonucleic acid
DTD DT-diaphorase
EDTA Ethylenediaminetetraacetic acid EPA Environmental Protection Agency
Eq Equivalent
F Fluorene
FAD Flavin Adenine Dinucleotide Fe-SOD Iron containing superoxide dismutase FID Flame Ionization Detector
Fluor Fluoranthene G Gills GC Gas Chromatography GPx Glutathione Peroxidase GR Glutathione Reductase GSH Reduced glutathione GSSG Glutathione disulphide GST Glutathione S-transferase H Hexane
HPLC High Performance Liquid Chromatography
IP Indene[123-cd]pyrene
KDa Kilodaltons
Kow Octanol/water coefficient
Log Logarithm
LPO Lipid peroxidation
MDA Malondialdehyde
Mit SOD Mitochondrial SOD
MFO Mixed Function Oxygenase System
Mn-SOD Manganese containing superoxide dismutase
MT Metallothionein
N Naphthalene
NADH Nicotinamide Adenine Dinucleotide NADPH Nicotinamide Adenine Dinucleotide Phosphate
OC Organic Carbon
OM Organic Matter
PAH Polycyclic Aromatic Hydrocarbons
PC Principal Component
PCA Principal Components Analyses
PCB Polychlorinated Biphenyls
PLS Partial Least Squares
PUFA Polynunsaturated Fatty Acids
Py Pyrene
ROS Reactive Oxygen Species
SD Standard Deviation
Se-GPx Selenium dependent Glutathione Peroxidase
SOD Superoxide Dismutase
TBT Tributyltin
T GPx Glutathione Peroxidase Total fraction tPAH Total Polycyclic Aromatic Hydrocarbons Tris Tris (hydroxymethyl) aminomethane
UDP Glucoronyl Transferase
1. GENERAL INTRODUCTION
POLYCYCLIC AROMATIC HYDROCARBONS AND OXIDATIVE
STRESS MARKERS IN THE CLAM Ruditapes decussatus
FROM THE RIA FORMOSA (PORTUGAL)
1.1. P
OLYCYCLICA
ROMATICH
YDROCARBONS1.1.1. Physico/chemical properties
Polycyclic Aromatic Hydrocarbons (PAHs) constitute a class of organic compounds composed of two or more fused aromatic rings. Naphthalene (C10H8), with two fused aromatic
rings, is the lowest molecular weight PAH. PAHs with nine or more aromatic rings have been identified in the resin-asphaltene fractions of petroleum (Neff, 2002). PAH molecules have a flat structure without substituent groups although some derivatives containing nitrogen, sulphur and oxygen heteroatoms may be included in this class of contaminants.
PAHs present generally high melting and boiling points, low vapour pressure and very low water solubility. They are very lipophilic, a characteristic measured by their high octanol/water partition coefficient, and chemically rather inert. However, these characteristics vary according to their number of rings and molecular weight. Table 1.1 shows the structure and physico/chemical characteristics of some PAHs usually found in the environment.
1.1.2. Formation and sources
PAHs may be formed by a variety of mechanisms (Neff, 2002):
− incomplete combustion or pyrolysis at high temperature (e.g. 700°C) of organic materials (pyrogenic PAHs), which is a very fast mechanism;
− rearrangement and transformation of biogenic organic materials at moderate temperatures of 100-300°C to form fossil fuels (petrogenic PAHs), which is a very slow process (e.g., millions of years);
− transformation of certain organic compounds in soils and sediments (diagenic PAHs), which is a relatively rapid process (days to years);
− direct biosynthesis by organisms (biogenic PAHs).
From these, combustion of organic matter, including fossil fuels, is thought to be the major source of PAHs to the environment (Laflamme & Hites, 1978; Wakeham et al., 1980; Gschwend & Hites, 1981; Simcik et al., 1999; Slater et al., 2002). It generates a wide variety of PAHs ranging from naphthalene to complex PAH polymers, particularly if combustion takes place in an oxygen-deficient environment (fuel-rich combustion mixture). During combustion in an oxygen-deficient atmosphere, organic matter is oxidized to low molecular weight organic molecules that condense as the combustion mixture cools to form complex new molecular structures, including aromatic and polycyclic aromatic hydrocarbons, a process called pyrolysis/pyrosynthesis (Neff, 2002).
Table 1.1 – Physico/chemical properties of PAHs.
Naphthalene* 128.2 2.4 x 10⁻¹ 3.37
Acenaphthylene* 152.2 1.1 x 10⁻¹ 4
Acenaphthene* 154.2 2.5 x 10⁻² 3.92
Fluorene* 166.2 1.1 x 10⁻² 4.18
Name Structure Molecular
Weight Log Kow
Solubility (mmol l-1)
Table 1.1 (Cont.) Phenanthrene* 178.2 2.6 x 10⁻² 3.24 Anthracene* 178.2 2.5 x 10⁻⁴ 4.54 Fluoranthene* 202.3 1.3 x 10⁻³ 5.22 Pyrene* 202.3 6.5 x 10⁻⁴ 5.18 Benzo[a ]anthracene* 228.3 4.8 x 10⁻⁵ 5.91 Chrysene** 228.3 1.3 x 10⁻⁵ 5.84 Benzo[b ]fluoranthene* 252.3 6 x 10⁻⁶ 5.8 Benzo[k ]fluoranthene* 252.3 3.2 x 10⁻⁶ 6 Benzo[a ]pyrene* 252.3 1.5 x 10⁻⁵ 6.04 Dibenzo[a,h ]anthracene** 278.4 1.8 x 10⁻⁵ 7.11 Benzo[g,h,i ]perylene* 276.3 9.7 x 10⁻⁷ 6.05 Indene[123-cd ]pyrene** 276.3 6.9 x 10⁻⁷ 7.04 Log Kow
Name Structure Molecular
Weight
Solubility (mmol l-1)
Pyrogenic PAH sources include: exhaust gases and ashes produced in organic matter combustion (Simcik et al., 1999; Oda et al., 2001, Slater et al., 2002; Kristensson et al., 2004); soot particles (Prahl & Carpen, 1983; Mitra et al., 1999; Fernandes & Brooks, 2003; Vardar et
al., 2004); waste incineration (Johansson & von Bavel, 2003; Sul et al., 2003); coke and asphalt
production (Margarido, 1999); aluminium production (Jongeneelen, 2001); heat and electricity generation in power plant facilities and in domestic furnaces (Kjällstrand & Olsson, 2004; Kakareka et al., 2005); forest fires (Bouloubassi & Saliot, 1993; Gabos et al., 2001); tobacco smoke (Baek & Jenkins, 2004); coal tar, creosote and related wood preservatives (Hyötyläinen & Olkari, 1999; Zhurinsh et al., 2005), among others.
PAHs resulting from incomplete combustions may be transported as gases or aerosols or adsorbed to atmospheric particles (Manoli & Samara, 1999). Airborne PAHs are relatively short-lived, in the order of a few tens of hours (Golomb et al., 2001). Thus in dry air, PAHs will not travel very far from the emission sources, and usually are deposited a few to tens of kilometres away from the emission source by a process which is known as dry deposition. Dry deposition includes also the direct impact on land or water of particulate PAHs (Manoli & Samara, 1999). The total amount of PAH atmospheric inputs through dry deposition in Chesapeake Bay was about 4400 Kg per year (Arzayus et al., 2001). Atmospheric fallout includes also wet deposition of particles and vapours. Wet deposition enters the water surface by precipitating hydrometeors (raindrops and snow flakes). Rainwater has on numerous occasions been shown to contain many organic compounds including PAHs, in concentrations sometimes much higher than in the receiving water body (Ollivon et al., 1999; Polkowska et al., 2000; Grynkiewicz et al., 2002). Wet deposition of PAHs may also originate from regional urban/industrial sources. PAH inputs to the New England coastal areas, for example, determined by Golomb (2001) were much higher by wet deposition (720 – 831 ng/m2cm of precipitation) than by dry deposition (9.3 – 95 ng/m2h).
Coal and petroleum are rich sources of petrogenic PAHs (Neff, 2002). Most of the PAHs in coal are tightly bound in the coal structure and cannot be easily leached out. However, coal dust and particles may contribute to the total extractable PAHs in sediments of bays and estuaries (French, 1998; Walker et al., 2005). Crude usually contains much higher concentrations of extractable PAHs than coals do (Page et al., 1998). However, the PAH composition of coal and crude oil is usually similar (Neff, 2002). Petrogenic PAHs enter the marine environment from natural oil seeps, erosion of coal, peat, and oil shale deposits, oil and coal spills, discharges of treated and untreated ballast and bilge water from oil tankers and other ships, and effluents from oil refineries, oil/water separations on production platforms, coal-fired power plants, and municipal sewage treatment plants (Blumer & Sass, 1972; Bouloubassi & Saliot, 1993; Ali et al., 1995; Lee & Page, 1997; Porte et al., 2000; Medeiros et al., 2005).
Municipal wastewaters are a relevant PAH source to surface waters. PAH concentrations in raw municipal wastewaters may vary considerably, depending on the amount of industrial effluents possibly co-treated with domestic wastewaters (Harrison et al., 1975). Treated wastewaters generally contain much lower concentrations (<1 µg/l) due to their removal by adsorption to particles, biodegradation or volatilisation (Richards & Shieh, 1986; Marttinen et
al., 2003). A significant amount of PAHs carried to surface waters by sewers derives also from
urban runoff (Manoli & Samara, 1999; Murakami et al., 2005). Urban runoff consists of the storm water from impervious areas, such as roads, motorways, paved parking lots, roofs, sidewalks, etc. As a consequence, urban runoff contains PAHs deposited on these surfaces, as well as mobile related PAHs from gasoline and oil drips or spills, exhaust products, tyre particles, and bitumen from road surfaces (Maltby et al., 1995; Manoli & Samara, 1999; Dickhut
et al., 2000; Menzie et al., 2002). The relative contribution of urban-runoff to receiving waters is
site-specific, dependent on the relative magnitudes of the wet and dry weather discharges (Manoli & Samara, 1999).
Although specific sources are known to be responsible for the introduction of PAHs in surface waters, their occurrence in the environment cannot always be related to just one particular source. Instead, the PAHs found in the environment are, generally, the result of a mixture of different PAHs from a large variety of origins. However, each PAHs source usually originates a specific molecular pattern of individual parent or modified (alkylated) aromatic hydrocarbons (Lake et al., 1979; Baumard et al., 1999a; Page et al., 1999; Savinov et al., 2000; Guinan et al., 2001). In this way, PAH sources identification generally relies on chemical analyses, which generate hydrocarbon “fingerprints” based on the individual hydrocarbon analytes that are diagnostic of the source (Boehm et al., 1997). Petrogenic PAHs are characterized by homologous families of related PAHs (naphthalenes, fluorenes, phenanthrenes, dibenzothiophenes and chrysenes), where the unsubstituted parent PAHs for each family are more abundant than the alkylated homologues; biogenic PAHs generated by biologic processes or by the early stages of diagenesis in marine sediments are generally enriched in perylene (a 4-ring unsubstituted PAHs); and pyrogenic PAHs, are dominated by the parent compounds of the 3-, 4- and 5-ring PAHs (Page et al., 1999). In this way, differences in ratios of parent to alkyl substituted PAH congeners can be used to distinguish between petrogenic and various types of pyrogenic PAH assemblages in environmental samples (Bence et al., 1996; Zeng & Cherrir, 1997)
Ratios between some individual parent PAHs may also be used to identify PAHs originating processes (Wang et al., 1999; Woodhead et al., 1999). For example, phenanthrene (P) is thermodynamically more stable than anthracene (A), so high P/A ratios are observed in petrogenic pollution and low (<10) in pyrolytic pollution (Soclo et al., 2000). Also, fluoranthene (Fluo) and pyrene (Py) are often associated and considered typical pyrogenic products generated from high temperature condensation of low molecular weight compounds. During the combustion process, however, pyrene is more stable than fluoranthene hence pyrolytic products
are usually characterized by a predominance of fluoranthene over pyrene (Fluo/Py ratio >1) (Baumard et al., 1999a). These ratios, however, are not conclusive in the analysis of petrogenic and pyrogenic origin and the analysis of alkylated PAHs are generally required to further substantiate their use.
1.1.3. Polycyclic Aromatic Hydrocarbons in seawater
After entering the aquatic environment, the behaviour and fate of PAHs depend on their physicochemical properties (Witt, 1995; Dabestani & Ivanov, 1999; Kirso et al., 2001). Volatilisation, dissolution, photodegradation, adsorption onto suspended solids and subsequent sedimentation, biotic and abiotic degradation, uptake by aquatic organisms and accumulation, are all major processes to which water PAHs are subjected (Witt, 2002). PAHs solubility is very low and decreases with increasing molecular weight (see Table 1.1), thus, concentration of dissolved PAHs in water is very low. Conversely, PAHs associate easily with particulate matter and are finally deposited in the sediments (Witt, 2002).
Table 1.2 shows the concentration of dissolved PAHs in marine waters worldwide. PAH concentrations vary widely, being usually low or undetectable at offshore sites (Baltic Sea, Eastern Mediterranean, for example) or very high in many coastal and estuary sites (Bouloubassi & Saliot, 1993; Burt & Ebell, 1995; Gustafson & Dickhut, 1997; Law et al., 1997).
Due to their lipophilic behaviour, PAHs have a natural tendency to adsorb to particles. The sorption process can be represented as an equilibrium between the aqueous phase and the non-aqueous (e.g. octanol) as described by a partition coefficient, Kow (Kirso et al., 2001;
Tremblay et al., 2005). Likewise, the degree to which a particular PAH will sorb to a particular sorbant is strongly influenced by the organic carbon content of the sorbant (Borglin et al., 1996) and also by temperature and salinity (Tremblay et al., 2005).
Dissolved organic matter (DOM) has been postulated to increase the solubility of PAHs in seawater (Haitzer et al., 1999; Akkanen & Kukkonen, 2001). Colloids are considered as a part of DOM, and show a great capacity to sorb hydrophobic contaminants in general, and PAHs in particular (Wijayaratne & Means, 1984). Temperature has a small influence, increasing PAHs solubility by a factor of two to five depending on the specific PAH (Whitehouse, 1984). Salinity, however, has the opposite effect. The effect of salinity is even less pronounced than of the temperature, being at most a factor of 2 over a salinity range of 0 to 36‰ (Whitehouse, 1984; McElroy et al., 1989).
Table 1.2 – Range of PAH concentrations in the dissolved phase of seawater in different areas of the world (ng l-1). Local England and Wales1 Tamar
Estuary2 Baltic Sea
3
Baltic Sea4 Eastern
Mediterranean5 Tyrrhenyan Sea6 Alexandria Coast7 Western Xiamen Sea8 Chesapeake Bay Estuaries9 Nova Scotia10 NY-NJ Harbour Estuary11 N 6 – 6850 13.9 0.13 – 1.77 98 120 – 1400 5.13 – 18.8 Ace 607 270 – 4180 0.102 – 0.21 Ac 1 – 1740 0.09 – 0.45 32 110 – 5700 0.206 – 0.977 14 – 22 F 1 – 1400 0.30 – 1.26 0.24 26 1.0 – 175 130 – 2290 0.607 – 0.979 10 – 18 0.76 – 2.6 P 3 – 1170 8.8 0.38 – 1.31 0.11 – 2.7 0.47 22 32 – 143 200 – 1370 0.963 – 1.09 10 – 25 0.92 – 5.6 A 1 – 157 4.9 0.03 – 0.08 0.06 17 16 – 76 170 – 1020 0.064 – 0.069 14 0.20 – 1.6 Fluo 1 – 940 10.4 1.49 – 3.93 0.33 – 6.97 0.21 19 11 – 62 90 – 2870 0.337 – 0.632 14 – 19 0.45 – 14 Py 1 – 1090 18 0.41 – 2.00 0.26 – 2.87 0.17 43 11 – 52 220 – 2660 0.103 – 0.264 12 – 41 0.40 – 16 BaA 1 – 609 15.2 0.08 – 0.25 0.06 2 280 – 1800 0.0016 – 0.016 13 0.02 – 1.6 Ch 1 – 726 3.5 0.14 – 0.37 0.14 2 13 – 83 0 – 1070 0.008 0.10 – 2.4 BbF 1 – 621 9.3 0.09 – 0.22 41 130 – 1820 0.0016 – 0.024 BkF 1 – 250 4.2 0.04 – 0.09 19 210 – 2190 – BaP 1 – 909 9.1 0.02 – 0.12 0.03 – 1.50 5 16 – 82 560 – 3320 0.011 0.01 – 0.01 DBA 1 – 126 0.01 – 0.02 4 370 – 6030 0.033 0.01 – 0.01 Bper 1 – 627 83.4 0.04 – 0.12 2 410 – 1930 – 0.00 – 0.00 IP 0.05 – 0.13 960 – 5420 – 0.02 – 0.02 tPAH 1 – 10724 3.32 – 11.04 0.74 – 13.58 1.35 937 128 – 642 9090 – 26900 8.90 – 21.75 10 – 134
1Law et al., 1997; 2Readman et al., 1982; 3Witt, 2002; 4Witt & Siegel, 2000; 5Tsapakis et al., 2003; 6Cincinelli et al., 2001; 7Nemr & Abd-Allah, 2003; 8Maskaoui et al.,
1.1.4. Polycyclic Aromatic Hydrocarbons in sediments
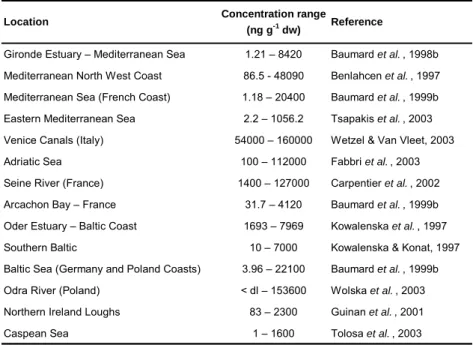
The PAH concentrations in the sediments are generally much higher than in the surrounding water body (Herbes, 1976; McGroddy et al., 1996; Lun et al., 1998; Kowalewska, 1999; Kirso et al., 2001). The importance of sediments as PAH reservoirs is well documented in natural as well as experimental systems (Baumard et al., 1998a; Narbonne et al., 1999). Sediment PAH concentrations in several locations in Europe are presented in Table 1.3.
Table 1.3 – PAHs concentrations in the sediments from different locations in Europe.
Location Concentration range
(ng g-1 dw) Reference
Gironde Estuary – Mediterranean Sea 1.21 – 8420 Baumard et al. , 1998b Mediterranean North West Coast 86.5 - 48090 Benlahcen et al. , 1997 Mediterranean Sea (French Coast) 1.18 – 20400 Baumard et al. , 1999b Eastern Mediterranean Sea 2.2 – 1056.2 Tsapakis et al. , 2003 Venice Canals (Italy) 54000 – 160000 Wetzel & Van Vleet, 2003 Adriatic Sea 100 – 112000 Fabbri et al. , 2003 Seine River (France) 1400 – 127000 Carpentier et al. , 2002 Arcachon Bay – France 31.7 – 4120 Baumard et al. , 1999b Oder Estuary – Baltic Coast 1693 – 7969 Kowalenska et al. , 1997 Southern Baltic 10 – 7000 Kowalenska & Konat, 1997 Baltic Sea (Germany and Poland Coasts) 3.96 – 22100 Baumard et al. , 1999b Odra River (Poland) < dl – 153600 Wolska et al. , 2003 Northern Ireland Loughs 83 – 2300 Guinan et al. , 2001 Caspean Sea 1 – 1600 Tolosa et al. , 2003
Small-scale physical processes such as local turbulence, and large-scale physical forces such as currents, which redistribute particulate material, will also affect PAHs distribution, as well as sediment mixing by burrowing organisms (bioturbation), especially near the sediment-water interface (Klamer et al., 1990; Cousins et al., 1999; Grossi et al., 2002; Nickell et al., 2003; Wheatcroft & Drake, 2003).
1.1.5. Polycyclic Aromatic Hydrocarbons in marine organisms
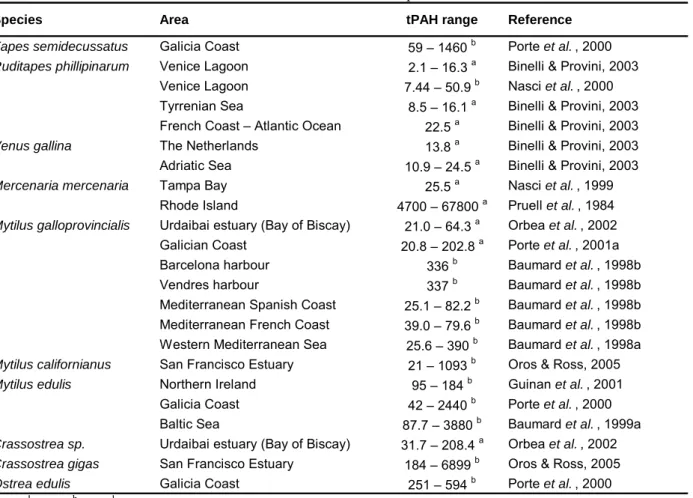
PAHs accumulation may occur in most marine organisms in a wide range of concentrations (Meador et al., 1995). Table 1.4 presents PAH concentrations in several marine bivalve molluscs. It may be seen there that bivalves are able to accumulate high amounts of PAHs. In general, mussels (Mytilus sp.) and oysters (Crassostrea gigas and Ostrea edulis) present the highest PAH concentrations. Still, high concentrations were also reported for some clams, namely Tapes semidecussata from the Galicia Coast (1460 ng/g d.w.) and Mercenaria
mercenaria from Rhode Island (4700 – 67800 ng/g w.w.). The wide range of concentrations seen
in Table 1.4 may be the result of several variables, including different environmental PAH concentrations, time of exposure, their feeding behaviour and ability to metabolise these compounds (Meador et al., 1995; Okay et al., 2000).
In invertebrates, highest concentrations are generally found in lipid rich organs as the hepatopancreas (Neff, 2002). Tissue concentrations, however, appear to follow seasonal cycles, which may be related to variations in lipid content or spawning cycles (Meador et al., 1995; Baumard et al., 1999a).
Uptake of hydrophobic contaminants by marine organisms may proceed via several sources: water filtration through the gills, filtration of overlying or pore-water, direct contact with sediment, or ingestion of sediment and/or food particles (Spacie et al., 1995). PAHs route of uptake is generally governed by their Kow (Farrington, 1989; Neff & Burns, 1996). For the
more soluble PAHs, the major route of uptake is generally ventilation of water through the gills (Meador et al., 1995; Neff, 2002), which may, however, be affected by the water-phase composition: as stated before (section 1.1.3), a large fraction of the total “dissolved” PAHs in the
Table 1.4 – tPAH concentrations in bivalve molluscs from several places worldwide.
Species Area tPAH range Reference
Tapes semidecussatus Galicia Coast 59 – 1460 b Porte et al. , 2000 Ruditapes phillipinarum Venice Lagoon 2.1 – 16.3 a Binelli & Provini, 2003
Venice Lagoon 7.44 – 50.9 b Nasci et al. , 2000
Tyrrenian Sea 8.5 – 16.1 a Binelli & Provini, 2003
French Coast – Atlantic Ocean 22.5 a Binelli & Provini, 2003
Venus gallina The Netherlands 13.8 a Binelli & Provini, 2003
Adriatic Sea 10.9 – 24.5 a Binelli & Provini, 2003 Mercenaria mercenaria Tampa Bay 25.5 a Nasci et al. , 1999
Rhode Island 4700 – 67800 a Pruell et al. , 1984 Mytilus galloprovincialis Urdaibai estuary (Bay of Biscay) 21.0 – 64.3 a Orbea et al. , 2002 Galician Coast 20.8 – 202.8 a Porte et al. , 2001a Barcelona harbour 336 b Baumard et al. , 1998b Vendres harbour 337 b Baumard et al. , 1998b Mediterranean Spanish Coast 25.1 – 82.2 b Baumard et al. , 1998b
Mediterranean French Coast 39.0 – 79.6 b Baumard et al. , 1998b
Western Mediterranean Sea 25.6 – 390 b Baumard et al. , 1998a
Mytilus californianus San Francisco Estuary 21 – 1093 b Oros & Ross, 2005
Mytilus edulis Northern Ireland 95 – 184 b Guinan et al. , 2001 Galicia Coast 42 – 2440 b Porte et al. , 2000 Baltic Sea 87.7 – 3880 b Baumard et al. , 1999a Crassostrea sp. Urdaibai estuary (Bay of Biscay) 31.7 – 208.4 a Orbea et al. , 2002 Crassostrea gigas San Francisco Estuary 184 – 6899 b Oros & Ross, 2005 Ostrea edulis Galicia Coast 251 – 594 b Porte et al. , 2000
a ng g-1 w.w.; b ng g-1 d.w.
water column are actually sorbed or complexed to DOM or colloids, reducing their bioavailability to some species. In fact, several experiments of non-ionic hydrophobic compounds, as the PAHs, accumulation by organisms have demonstrated decreases in bioconcentration in the presence of DOM and humic-like material (Farrington, 1989; Haitzer et al., 1999; Akkanen & Kukkonen, 2001; Akkanen & Kukkonen, 2003; Gourlay et al., 2003). Conversely, accumulation of the more hydrophobic PAHs is thought to proceed mainly through the ingestion of contaminated sediment or food particles (Meador et al., 1995). Bioaccumulation from sediments or food usually involves an intermediate step in which PAHs desorb or are released into solution from the solid matrix (Neff, 2002). Thus, the environmental compartment in which PAHs exist will be determinant on its bioavailability (Spacie et al., 1995).
PAHs sorbed to dissolved and particulate organic matter in water and sediments may still desorb from these substrates, maintaining water PAH concentrations at an equilibrium (Meyers & Qujnn, 1973; Readman et al., 1982). However, during long-term contact between PAHs and sediment particles, PAHs become tightly bound to the organic phase in the sediment, reducing their bioavailability. Bioaccumulation from sediments may also be affected by sediment characteristics such as particle size and organic matter content (OM) (Borglin et al., 1996; Kukkonen & Landrum, 1996; Baumard et al., 1999a; Bi et al., 2002). Usually, organisms preferentially ingest the smaller sediment particles (more enriched in OM), which may result in an increased contaminant uptake (Van der Oost et al., 2003).
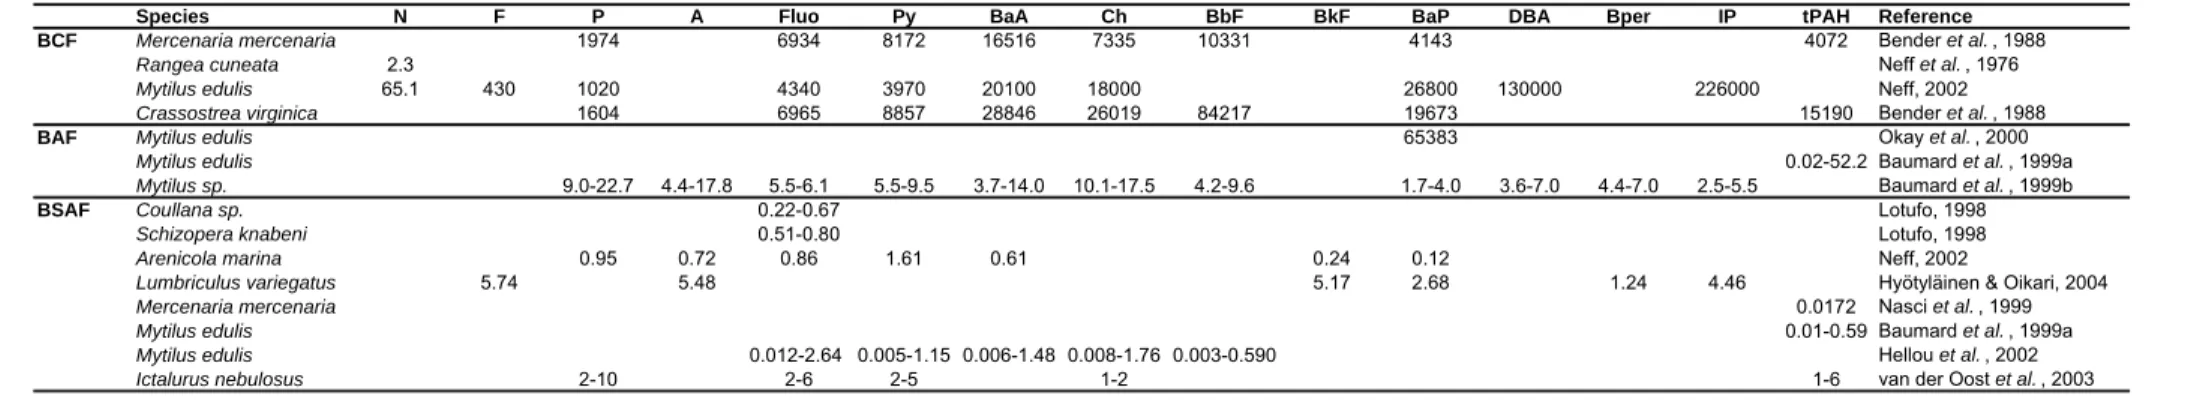
Different methods have been used to study contaminants bioaccumulation. The bioconcentration factor (BCF = ratio of the organism concentration of a compound versus its water concentration) is a useful first order approach for estimating biological uptake and accumulation of organic chemicals. The bioaccumulation factor (BAF = ratio of the organism concentration versus the sediment concentration) is calculated to estimate the contaminant accumulation by an organism from the sediment; and the biota sediment accumulation factor (BSAF = ratio of the lipid-normalized concentration in the tissue to the carbon-lipid-normalized sediment concentration) is based on the partitioning of the contaminant between the sediment organic carbon and the organism lipids (Spacie et al., 1995). Table 1.5 presents bioconcentration and bioaccumulation factors of PAHs for several organisms. BCF values are much higher than BAF or BSAF, ranging from 2.3 for naphthalene in Rangea cuneata to 226000 for indene[123-cd]pyrene in Mytilus edulis. For the low molecular weight hydrocarbons (with lower log Kow values), BCFs were similar for all
species. However, for the higher molecular weight PAHs (higher than chrysene), Mytilus and
Crassostrea presented higher BCFs than clams. Contrary to BCF, BAF and BSAF values were
Table 1.5 – BCF, BAF and BSAF for PAHs in several organisms.
Species N F P A Fluo Py BaA Ch BbF BkF BaP DBA Bper IP tPAH Reference
BCF Mercenaria mercenaria 1974 6934 8172 16516 7335 10331 4143 4072 Bender et al. , 1988
Rangea cuneata 2.3 Neff et al. , 1976
Mytilus edulis 65.1 430 1020 4340 3970 20100 18000 26800 130000 226000 Neff, 2002
Crassostrea virginica 1604 6965 8857 28846 26019 84217 19673 15190 Bender et al. , 1988
BAF Mytilus edulis 65383 Okay et al. , 2000
Mytilus edulis 0.02-52.2 Baumard et al. , 1999a
Mytilus sp. 9.0-22.7 4.4-17.8 5.5-6.1 5.5-9.5 3.7-14.0 10.1-17.5 4.2-9.6 1.7-4.0 3.6-7.0 4.4-7.0 2.5-5.5 Baumard et al. , 1999b
BSAF Coullana sp. 0.22-0.67 Lotufo, 1998
Schizopera knabeni 0.51-0.80 Lotufo, 1998
Arenicola marina 0.95 0.72 0.86 1.61 0.61 0.24 0.12 Neff, 2002
Lumbriculus variegatus 5.74 5.48 5.17 2.68 1.24 4.46 Hyötyläinen & Oikari, 2004
Mercenaria mercenaria 0.0172 Nasci et al. , 1999
Mytilus edulis 0.01-0.59 Baumard et al. , 1999a
Mytilus edulis 0.012-2.64 0.005-1.15 0.006-1.48 0.008-1.76 0.003-0.590 Hellou et al. , 2002
Several studies have demonstrated the existence of a relationship between log BCF and log Kow, based on different groups of chemicals, species and exposure conditions (McElroy et
al., 1989; Neff, 2002). In fact, BCF/Kow relationships may be affected by both biotic and abiotic
factors. Biotic factors include those that are dependent on the organism, generally varying with species. These include lipid content and distribution within the animal tissues (which often varies with age, sex and phase of the reproductive cycle), feeding type, metabolic rate of the animal (which varies also with age and nutritional status of the animal), and behavioural effects of experimental exposures (Jimenez et al., 1987; Meador et al., 1995). Abiotic factors include temperature, salinity, and the physical form of the chemical in the water.
1.2.
B
IOTRANSFORMATIONOrganisms have two ways of eliminating chemicals: excretion in its original form (the parent compound) or biotransformation (Van der Oost et al., 2003). Release of bioaccumulated PAHs by molluscs may occur by passive elimination through equilibrium partitioning between body lipids and the external water (Neff, 2002). However, though passive elimination may be a fast process for the low molecular weight and thus more soluble PAHs, it is very slow for the less soluble compounds (Meador et al., 1995). If active metabolism and excretion do not occur, these compounds may accumulate in the tissues of marine organisms (Neff, 2002). Most marine organisms are, however, able to metabolize some PAHs converting them to polar, more soluble by-products that are readily excreted (Anderson, 1985; Snyder, 2000).
Overall, PAHs metabolism involves three major steps or phases acting in a tightly integrated manner (Sheehan et al., 2001). Phases I and II involve the conversion of the lipophilic, non-polar xenobiotic into a more water-soluble metabolite, which can then be eliminated more easily from the cell in Phase III (Figure 1.1).
Phase II Cell O2 P450 O H2O Epoxide Hydratase OH O H P450 O2 OH O H O Phase I GSH OH O H OH GS OH O H OH GS Phase III
Figure 1.1 – Overview of benzo[a]pyrene detoxification. Adapted from Sheehan et al. (2001).
Phase I involves the oxidation of the organic chemical with molecular oxygen, catalysed by monooxygenases (Lee, 1981; Livingstone et al., 1985; Goksøyr & Förlin, 1992; Solé et al., 1994). These transformations rely on the action of enzymatic systems such as the cytochrome P450-dependent monooxygenase or mixed-function oxygenase (MFO) system, flavoprotein monooxygenase system, and epoxide hydratase and flavoprotein reductases.
The enzymes responsible for phase I metabolism are generally associated with the membrane of the endoplasmic reticulum of the liver (vertebrates) or hepatopancreas (invertebrates) cells (Michel et al., 1993). Phase I biotransformation products are however more hydrophilic than the parent ones and move to the cytosol, where the enzymes responsible for phase II metabolism are located.
The MFO system is present in many marine invertebrate species, as arthropods (crustaceans), annelids (polychaetes), cnidarians, molluscs, porifera, platyhelminths, and echinoderms (Snyder, 2000). However, it appears to be much less inducible by xenobiotics in these organisms than in marine vertebrates including fish (Solé et al., 1994).
Phase I mechanism is illustrated in more detail in Figure 1.2, for benzo[a]pyrene, where the microsomal electron transport reactions involved in the metabolism are shown (Lee, 1981).
BaP - Oxi cit P450
BaP - Red cit P450 Oxi cit P450
NADPH Cit P450 reductase e -O2 H2O 3-Hydroxybenzo(a)pyrene O2 -BaP - cit P450 Benzo(a)pyrene OH
Figure 1.2 – Benzo[a]pyrene hydroxylation by the cit P450 oxygenase system. Benzo[a]pyrene binds first to oxidized cytochrome P450 (Fe3+) and iron is reduced in the resulting complex to cytochrome P450 (Fe2+) which than interacts with oxygen producing 3-hydroxybenzo[a]pyrene, and regenerating the oxidized cytochrome P450. The reduction of the substrate-oxidized cytochrome P450 complex involves the donation of two electrons from NADPH and is carried by NADPH cytochrome P450 reductase. The superoxide anion (O2-) is formed during this reaction participating in the hydroxylation of the substrate. Adapted from Lee (1981).
Benzo[a]pyrene hydroxylase (BPH) is one of the Cyt P450 enzyme families involved in the PAHs metabolism phase I (Buhler & Williams, 1989; Shaw et al., 2004). BPH, which is also called aryl hydrocarbon hydroxylase (AHH), catalyzes the formation of arene oxides that can be auto-oxidized to form phenols or quinones (Michel et al., 1993). This oxidation results in the production of metabolites with mutagenic and carcinogenic properties (Buhler & Williams, 1989). Several studies (Table 1.6) have demonstrated the occurrence of BPH in bivalves as the mussel M. galloprovincialis (Michel et al., 1993; Michel et al., 1994; Porte et al., 2001) and M.
edulis (Solé et al., 1998) and in clams M. mercenaria (Nasci et al., 1999) and T. phillipinarum
(Nasci et al., 2000).
Table 1.6 – Benzo[a]pyrene hydroxylase activity (fluorescence units mg-1 prot) range in different bivalve species. BPH
(fu mg-1prot)
Tapes philippinarum Venice Lagoon DG 0.7 - 1.5 Nasci et al. , 2000
Mercenaria mercenaria Tampa Bay, Florida DG 0.069 - 0.242 Nasci et al. , 1999
Mytilus galloprovincialis Mediterranean Sea DG 2.5 - 24.5 Michel et al. , 1994
Galician Coast DG 44.7 - 63.2 Porte et al. , 2001
Species Area Tissues Reference
Phase II metabolism is conducted by conjugative enzymes, such as glutathione S-transferase (GST), UDP-glucoronyl S-transferase, UDP-glucosyl S-transferase, sulphoS-transferase and amino acid conjugases, which will attach a large polar moiety (glutathione, sulphate, glucoronide, amino acid, etc.) to the functional group introduced into the xenobiotic in Phase I metabolism.
GST is a multigene superfamily of dimeric, multifunctional, primarily soluble enzymes, found mainly in the cytosol (Sheehan et al., 2001; Van der Oost et al., 2003). It catalyzes the conjugation of electrophilic compounds (or phase I metabolites) with GSH (Sheehan et al., 2001). Although it may also have peroxidase and isomerase activities, GST can inhibit the Jun N-terminal kinase (thus protecting cells against H2O2-induced cell death), and they are able to
bind non-catalytically to a wide range of endogenous and exogenous ligands (Sheehan et al., 2001). GST activity is present in different bivalves (Table 1.7) such as mussels M. edulis (Lyons
et al., 2003) and M. galloprovincialis (Akcha et al., 2000) and clams Ruditapes decussatus