The Main Portuguese SAD´s
Comparative Study between the Economic and
Financial Viability and the Success of their
Sports Clubs
Miguel Henriques Félix da Silva#, José António Filipe*
# Instituto Universitário de Lisboa (ISCTE-IUL)
Lisboa Portugal
miguelfelix_@hotmail.com
* Department of Mathematics
Instituto Universitário de Lisboa (ISCTE-IUL), BRU – IUL Lisboa Portugal
jose.filipe@iscte.pt
Abstract - The object of this paper is to assess the
profitability of the four leading Portuguese Sociedades Anónimas Desportivas (SADs)1 by comparing the
economic and financial data of each SAD with the respective sports results of the clubs attached to these SADs. The methodology followed the various steps inherent to this type of paper, all the while adopting both a qualitative and quantitative approach, i.e. a hybrid approach. Initially, we took on an interpretative paradigm, as the elements necessary for research arise from the observation and analysis of data. We began by increasing our scientific knowledge on the subject of analysis: SADs, sports results and balanced financial structures. This was followed by a characterisation of the sector and a thorough analysis of both the accounts and the sports results of the SADs and the clubs. Thereafter, we crossed the data from these two analyses and completed the project with a number of key measures to achieve both financial and sporting success. Finally, it was possible to conclude that a Sociedade Anónima Desportiva can, in fact, achieve satisfactory economic, financial and sporting levels if a number of guiding principles are adopted. Principles that, when interconnected through a virtuous cycle, generate greater revenue and consequently profits, contributing to a balanced financial structure, conducive to more victories and naturally titles, which in turn provide increased revenue, thereby bestowing coherence to the virtuous cycle.
Keywords: Sociedade Anónima Desportiva, sporting
success, balanced financial structure
1. Introduction
1.1. Thematic Context
1
A Sociedade Anónima Desportiva (SAD) is a limited liability company operating in the sports industry.
Europe currently lives a fairly sharp economic and social crisis. These times are of containment at European, national and regional level. It seems a consensus that, for the time being, the core of the sovereign debt crisis, which sprouted after the financial crisis started September 15, 2008 with the bankruptcy of U.S. Investment Bank Lehman Brothers, being basically geographically concentrated in part of the periphery of the Euro Zone, where Portugal is included.
Portugal is, for the time being, dependent on its creditors and is now a country forced to austerity plans, which are a condition of foreign aid for its survival. Then, in this national and European context, it is urgent the creation of policies that contribute simultaneously to the increase of competitiveness and to the reduction of the external account imbalance.
As we can see in the portrait of country´s situation, the situation of the clubs and SAD´s is very dependent on external revenues and exports. In other words, the weight that the sale of players and bonuses from UEFA has in the accounts of SAD´s is massive. These, in order to get these recipes, can not in any way detract from the sporting results aimed and reached.
Therefore, the theme proposed for this article consists on the research about the profitability of the main national SAD´s, comparing this profitability with the success of their sports clubs. We will investigate if there is the possibility of simultaneous achieving sports success and being cost-effective.
1.2. Characterization of the Sector
The recent evolution of sport in Portugal can be qualified as fairly satisfactory. Combined with the sports scores, positively significant at European level, the number of federated practitioners increased increase annually. In 2011 there are 523,168
____________________________________________________________________________________ International Journal of Latest Trends in Finance & Economic Sciences IJLTFES, E‐ISSN: 2047‐0916
federated athletes (Figure No. 18). This has been another positive aspect for the development of sport in Portugal, as well as the development of infrastructures, like the new stadiums built for the Euro 2004 or the high performance centres built strategically on the national territory; not forgetting the passion and enthusiasm that the sport generates in the majority of the Portuguese population, as a key factor in the development of the national sport.
After this brief general characterization of the sports sector, we now characterize particularly the domain area of this article, namely, the football sector.
As we know, football is the most popular sport in Portugal and also the one with the largest number of federated athletes. According to numbers from the database Pordata in 2011 there were already more than 150.000 federated athletes in football in Portugal, while in 2006 there were nearly 136.000 (Figure No. 19). This increase, which has been gradual over the last five years, appears at the same time that the sports scores of the major Portuguese clubs across borders have improved. In the last ten seasons (2002/2012) the Portuguese teams won for once the Champions League (FC Porto in 2003/2004), two to the Europa League (FC Porto in 2002/2003 and 2010/2011), having been still present in two finals of the Europa League (Sporting CP in 2004/2005 and S.C.Braga in 2010/2011), two quarter-finals of the Champions League (SL Benfica in 2005/2006 and 2011/2012) and three semi-finals of the Europa League (Boavista FC in 2002/2003, SL Benfica in 2010/2011 and Sporting CP in 2011/2012). These are notable facts, not forgetting, of course, the fact that, for many people, Portugal is the country of origin of the best player and the best coach in the world today, namely Jose Mourinho and Cristiano Ronaldo. However, these facts do not guarantee economic and financial health for the Portuguese SAD´s. And that is the main subject on which will focus our research in this article.
2. Research problem definition and
general and specific objectives
In order to develop further this study and after the selection of the theme, we have, since then, exposed the problem of research by a question where we explain strictly what we want to know. The research question that we defined appears to be crucial to understand if it is plausible to a sporting institution to achieve successful results in sports and business at the same time.
Is it possible to a SAD to have both sport
success and to be economically profitable?
In order to guide the research and development of this project in a focused and competent way, it is
essential to identify the objectives that we want to achieve on our approach to the subject.
General objective:
a) The main objective of this study is to
understand the financial structures of the SAD´s combining the interpretation of these structures with the sports scores obtained by the respective clubs, drawing conclusions.
Specific objectives:
Understand what a SAD is and how it acts on the market.
Understand clearly which characteristics define a balanced financial structure.
Interpret in a clear and concise manner the accounts published by the SAD´s.
Analyze the results of sports clubs and confront them with their budgets.
Propose solutions and measures to be taken for a profitable SAD and provide at the same time sports scores positively significant.
3. Methodology
Concerning the quantification of the study, we can consider adopting a hybrid method, that is, quantitative, particularly when they are addressed issues related to the accounts of SAD´s, where reality is objective and independent. But it is also qualitative, because the analysis of sports scores has a subjective component as it is, a historical analysis of certain events held qualitatively.
The methodology of this project went through various stages and methods of research. At an early stage, we had the choice of topic and the definition of the objectives that we set ourselves to achieve. Later we did a literature search on the topic under discussion, which allowed us to “find, analyze, synthesize and interpret prior research related to the study area. The literature review is an indispensable role in the project, as it allows you to define the research problem under study, such as having a clear idea about the current level of knowledge about the subject" Bento (2012). We have also a characterization of the sector, followed by the analysis of the accounts and of the sports results of SAD´s. Finishing with a reflection on the key measures to achieve success in both parameters.
With regard to information gathering, it was made by primary sources, namely, books and articles relevant to the study, Annual reports; and also by secondary sources, such as summaries or encyclopedias, whether they are written by authors
who interpret the works of other authors and that demonstrate relevance by agglomerating, filtering and compiling knowledge from various primary sources.
4. Review of Literature
4.1. SAD´S
At this stage of our project, we started to understand the concepts that support a SAD. A SAD, according to the website www.portaldaempresa.pt is generally, a privately held company consisting of shareholders, whose purpose is to participate in sports competitions, as well as the promotion and organization of sports shows and/or development of activities related to professional sports.
It is relevant to point out that the creation of Anonymous Sports Societies (SADs) was imposed by law, in order to maintain the equity in tax terms, between the procedures due to sports clubs and citizens in general. Until then all sports business passed on the margins of social contributions, since most players ' salaries were not declared and, consequently, also there were no discounts for social security.
4.2. Sport Success
The concept of sport success is intrinsically linked to the objectives outlined by each institution/club within the framework of its activity. This concept is measured by sports results obtained. Succeed is having satisfactory results, that is, having victories in games, and competitions. Surely to achieve this success work, dedication, talent and capital cannot be missed. However the victories and titles are desired by all major institutions, then we need to find competitive advantages so that clubs will be able to overcome their rivals.
Having said that, we understand that to achieve sporting success, it is essential to have the ability to get the most out of each resource and for this to happen, it is of course imperative that the club has a highly competent leadership. According to Jack Welch (2005: 65), "leaders constantly improve the level of his team, making each encounter an opportunity to evaluate, guide and build self-confidence. Evaluate, in order to ensure that the right people have the appropriate functions; Guide, criticizing and helping employees to improve their performance in the best possible way and building self-confidence, encouraging, giving attention and appreciation". In this way, the leaders are respected within the club or company, generate trust and transmitting positive energy and optimism that will take the club or the company to glory.
As Crespo de Carvalho (2004: 23), "the company works based on three fronts: the motivation of its employees; the knowledge or information that the company acquired and which can benefit; and the ability to make it happen something we want to happen".
4.3. Balanced financial structure
Generally, the main purpose of business is to maximize profits looking to increase revenues and decrease costs maintaining the stakeholder’s satisfied. However, the policy pursued by the football clubs is somehow different. More than profits, responsible leaders, members and supporters want to maximize victories and titles. This line of thought is due fundamentally to the emotion that football awakens and repeatedly goes beyond rationality in the decision-making process of sports agents. In turn, the rivalry felt between clubs in the pursuit of these objectives is a critical factor and justifies the desire of people to prefer titles then profits in the "world of football".
For these reasons, the clubs are a different kind of companies and, therefore, managed by a distinct business model. Although, logically, in the clubs as in business, no one wants to lose money, and the victories and titles are also very important to generate revenue.
Not disregarding the differences highlighted between the economic models of football clubs and tout court companies, we will now focus on the investigation of how the financial structure of an enterprise should be addressed.
It is important to start by understanding what financial analysis is. According to Borges, Rodrigues and Morgado (2004: 294), we can define financial analysis as "a set of techniques to raise awareness of the economic, monetary and financial situation of organizations, from accounting and financial documents. Studying information related to the financial situation, through the analysis of financial stability, solvency, debt, among others; with the economic situation through the analysis of the results and of the factors that influence, such as the productivity or cost structure and the monetary situation".
We start with the fundamental principle that the financial stability happens when the permanent capital is at least equal to the net, or otherwise, that the net working capital is greater than or equal to the working capital. This means that there is liquidity, soon it will be possible to meet short-term commitments. The continuity of this liquidity is ensured by a succession of positive results. That, in turn, is generating ability, that is, ability to satisfy the medium/long term commitments.
We will center our analysis in the annual reports of SAD´s. We will focus mainly on understanding
financial analysis of accounting documents essential to assess the performance of the business: the balance sheet and the profit and loss account. Also in some key performance indicators as the net working capital, working capital, the treasury, the return on equity, return on assets, the solvency and financial autonomy.
According to Esperança & Matias (2009: 59-60) "the balance sheet is the accounting document that expresses the assets and liabilities of a company on a particular date. The asset consists of the set of possessions and rights that we have, while the liabilities are characterized by the debts incurred to finance the asset". The asset, in SAD´s consists primarily by the fixed asset, or tangible assets, such as the stadiums or training centers, intangible assets where they consider the sporting rights of players and financial investment. "The difference between what we have (assets) and what we owe (liabilities) is called equity, representing the value of the net wealth of third party debts" (Esperança & Matias 2009: 60).
To better understand the advantages of the use of these financial instruments, Borges, Rodrigues and Morgado (2004: 318) presents us with a set of very clear definitions of them. Indicating us that "the net working capital expressed the difference between stable resources and lasting applications, and if the difference is positive represents a safety margin of financing on the permanent applications. Working capital reflects the impacts of regulatory aspects related to business, constituting one of the major determinants of the financial policy of the company. The treasury is the indicator of financial stability; The return on equity allows us to relate the level of net profit generated depending on the amount invested. The profitability of the asset business capacity assesses the economic results in relation to its variable costs. The solvency and financial autonomy provide indications about the company's funding structure, assessing respectively the company's ability to meet its commitments with third parties and the level of total equity funding ".
Now we have clear definitions of financial instruments which will enable us to make a coherent analysis about the annual reports, it is important to apply and compare them between each SAD´s, in financial terms.
4.4. Financial Fair play
As is public knowledge, the three major Portuguese football clubs are faced with the possibility of lack of control of its indebtedness. In this way, reduce the wage bill will be one of the paths to the balance, so much so that UEFA has implemented ratios of "financial fair play" that force the clubs to manage the wage bill indicators on operating income around 75%, so, if the clubs want to increase their wage bill also need to increase operating profits.
The concept of "financial fair play" unanimously approved by the UEFA Executive Committee (2009), has as main objectives:
“- To introduce more discipline and rationality in the finances of football clubs;
- Encourage clubs to compete only with the values of their recipes;
- Encourage long-term investments in youth soccer and in infrastructure;
- Protect the viability of European football;
- Ensure that clubs address their financial problems in time”.
In this way, the clubs feel obliged to balance their accounts and cannot repeatedly spend more than the revenue they generate. Under penalty of being punished with freezing of revenue from the performance in European competitions.
5. Analysis of economic-financial results
and sports scores from each of the
SAD´s
5.1. Economic and Financial Results
In this chapter we shall proceed to the economic and financial analysis of the four main Portugal SAD´s, with effects on the consolidated accounts for the last five financial years, starting in season 2007/2008 and ending in 2011/2012. We will study and assess the viability, stability and profitability, including a set of instruments and methods that enable us to perform diagnostics on the financial situation of a company. In this way, we will be able
to evaluate the profitability of the business, and check if revenues exceed the investment and operating costs.
5.1.1 Futebol Clube do Porto – Futebol, SAD
- Operating and Net Results
Analyzing the FC Porto SAD results, in 2011/2012, an atypical year in terms of net results, as it was the only one in the last five to present losses. Mainly due to the significant reduction of operating profit resulting from a cost increase and decrease revenue.
Figure nº 1 - Operating and Net Results FC Porto SAD
(Source: author, based on the FCP SAD Annual Report)
-
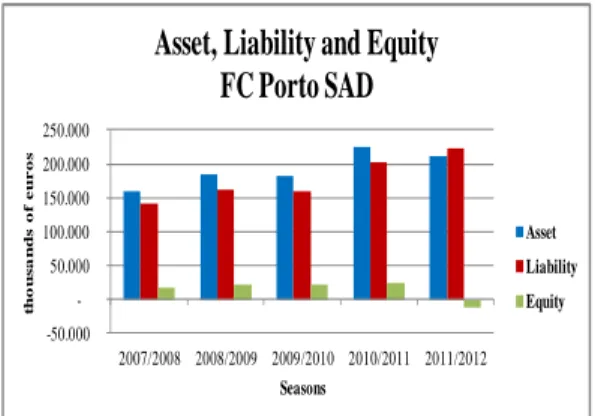
Asset, Liability and EquityStudying the data on the asset in the last year, we observed that this decreased compared to the same period of the previous year, although there was an increase in the caption intangible assets that represents the value of the squad. There has been a decline even sharper in customers, which demonstrates that the SAD, despite having increased value in its assets, was not able or did not want to sell them at the level of the previous year and this had repercussions on the final values of the asset. On the FC Porto SAD equity trends there was, in the last financial year, a clear reversal in the trend of increase of these values over the last four years. This deficit is the result of a significant increase in liabilities that was not accompanied by the increase in the assets.
Figure No. 2- Asset, Liability and Equity FC Porto SAD
(Source: author, based on the FCP SAD Annual Report)
- Economic and financial indicators
Except for the last year, all economic and financial indicators analyzed are quite positive. The only exception was the return on equity in 2009/2010, offset by solvability ratios and financial autonomy
always above 11% and 10% respectively. This demonstrates that for several years there has been financial stability in the SAD. The 2011/2012 season was opposite to the four previous reasons. In 2011/2012, the FC Porto SAD presents either negative equity or net income, which consequently led to negative values for the solvency ratios and financial autonomy. However, it leads us to conclude that the economic and financial results of FC Porto SAD over the past five years are, on balance, positive.
Figure No. 3- Economic and financial indicators FC Porto SAD
(Source: author, based on the FCP SAD Annual Report)
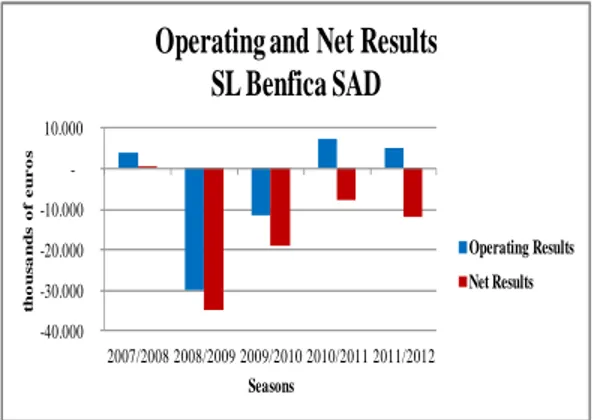
Sport Lisboa e Benfica – Futebol, SAD
-
Operating and Net ResultsAnalyzing the SL Benfica SAD results in the last five years, we observe that in the lasts four years the net results were negative. Despite being the only Portuguese club mentioned in the last three "Football Money League" reports of Deloitte consulting and audit, which evaluates the ability of clubs from major European leagues to generate revenue in day-to-day operations, such as: game tickets, television rights, awards, contests, sponsorships, merchandising and other commercial operations. SL Benfica was the club with more revenues out of those who were considered, until 2011/2012, from the five major European Leagues (England, Spain, Germany, Italy and France). -40.000 -30.000 -20.000 -10.000 -10.000 20.000 2007/2008 2008/2009 2009/2010 2010/2011 2011/2012 t h o u s a n d s o f eu ro s Seasons
Operating and Net Results
FC Porto SAD
Operating Results Net Results -50.000 -50.000 100.000 150.000 200.000 250.000 2007/2008 2008/2009 2009/2010 2010/2011 2011/2012 t h o u s a n d s o f eu ro s SeasonsAsset, Liability and Equity
FC Porto SAD
Asset Liability Equity unit.: k€ ITEMS 2007/2008 2008/2009 2009/2010 2010/2011 2011/2012 Asset 158.800 183.600 182.901 225.323 210.727 Liability 141.100 160.800 160.072 202.030 223.385 Non-Current Liabilities 42.270 36.151 45.264 61.159 53.068 Equity 17.704 22.776 22.829 23.293 12.658 Ongoing Capitals 59.974 58.927 68.093 84.452 65.726 Fixed Assets 83.305 88.679 93.915 129.238 135.567 Working Capital - 23.331 - 29.752 - 25.822 - 44.786 - 69.841 Cyclical Requirements 70.363 86.407 79.815 72.739 72.785 Cyclical Resources 27.881 33.454 33.279 42.461 51.420Working Capital Requirements 42.482 52.953 46.536 30.278 21.365
Treasury - 65.813 - 82.705 - 72.358 - 75.064 - 91.206
Operating Results 12.700 11.200 2.854 6.977 - 26.441
Net Results 8.000 5.100 83 534 - 35.763
Return on Equity 46% 22% 0% 2% Ratio not applicable
Return on Economic Asset 10,1% 7,9% 2,0% 4,4% -16,8%
Solvency 12,4% 14,2% 14,3% 11,5% -5,7%
Financial Autonomy 11,0% 12,4% 12,5% 10,3% -6,0%
Figura nº 1 – Resultados Operacionais e Líquidos SL Benfica SAD
(Source: author, based on the SLB SAD Annual Report)
- Asset, Liability and Equity
The asset values of Sport Lisboa e Benfica SAD have evolved much like the passive values, increasing from year to year. However, not always the values of the asset outweigh liabilities as recommended. It is positive that the asset values are growing, this effect is void if the liabilities grow more and we are facing negative equity.
In the SL Benfica SAD´s case, this is an evolution of oscillating capital between positive and negative values in the last five years, unlike for example the great rival FC Porto, as we saw earlier.
Figure No. 5-Asset, Liability and Equity SL Benfica SAD
(Source: author, based on the SLB SAD Annual Report)
- Economic and financial indicators
About the SL Benfica SAD´s economic and financial indicators for the last five seasons, it is observed that the financial framework of the SL Benfica SAD, is not at all the best. Combined to the inability to have positive equity annually we can see, for example last season, that both the treasury or the return on own funds, the solvency or financial autonomy presents negative values. These data demonstrate that the SAD may not be able to meet all its commitments with third parties. However, as a good example, we should pay attention to the 2007/2008 season where all the ratios and indicators were positive, something that won´t happens again since then. It is noted that the SL Benfica has not been able to present a positive return on equity over the past four years. It has been quite negative although being able, as a rule, to sell its assets at good prices, like in the summer of 2012 with Axel Witsel and Javi Garcia whose only capital gains will be reflected in the next financial year of Benfica SAD.
Figure No. 6 – Economic and financial indicators SL Benfica SAD
(Source: author, based on the SLB SAD Annual Report)
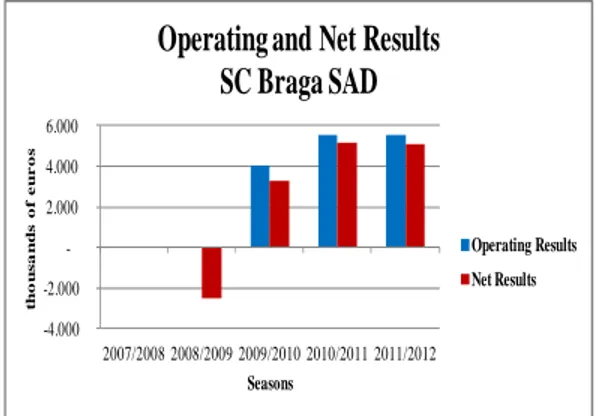
Sporting Clube de Braga – Futebol, SAD
- Operating and Net Results
Before starting the analysis to the accounts of SC Braga SAD, it is relevant to say that in some cases it has not been possible to establish economic and financial data relating to the seasons of 2007/2008 and 2008/2009 for not having been published annual reports of Sporting Clube de Braga SAD in this period.
So, we found that, of all the SAD´s analyzed, just SC Braga SAD managed to have positive net results in the last financial year, and there are three seasons
-40.000 -30.000 -20.000 -10.000 -10.000 2007/2008 2008/2009 2009/2010 2010/2011 2011/2012 t h ou s a n d s of e u r o s Seasons
Operating and Net Results
SL Benfica SAD
Operating Results Net Results -100.000 -100.000 200.000 300.000 400.000 500.000 2007/2008 2008/2009 2009/2010 2010/2011 2011/2012 t h o u s a n d s o f eu ro s SeasonsAsset, Liability and Equity
SL Benfica SAD
Asset Liability Equity unit.: k€ ITEMS 2007/2008 2008/2009 2009/2010 2010/2011 2011/2012 Asset 148.082 166.846 381.232 382.079 411.921 Liability 125.051 178.636 373.793 379.629 426.073 Non-Current Liabilities 53.975 36.058 204.461 210.993 167.398 Equity 23.031 - 11.825 7.439 2.450 - 14.152 Ongoing Capitals 77.006 24.233 211.900 213.443 153.246 Fixed Assets 100.013 102.424 306.553 309.885 315.497 Working Capital - 23.007 - 78.191 - 94.653 - 96.442 - 162.251 Cyclical Requirements 37.649 40.997 50.277 46.557 78.846 Cyclical Resources 62.537 27.001 54.948 59.829 74.201Working Capital Requirements - 24.888 13.996 - 4.671 - 13.272 4.645
Treasury 1.881 - 92.187 - 89.982 - 83.170 - 166.896
Operating Results 3.996 - 29.911 - 11.304 7.317 5.125
Net Results 116 - 34.856 - 18.998 - 7.663 - 11.690
Return on Equity 1% Ratio not applicable -255% -313% Ratio not applicable
Return on Economic Asset 5,3% -25,7% -3,7% 2,5% 1,6%
Solvency 18,4% -6,6% 2,0% 0,6% -3,3%
Financial Autonomy 15,6% -7,1% 2,0% 0,6% -3,4%
in positive ground. This fact is supported by the increased sales in game tickets and by the UEFA revenues, as well as by the results with athletes whose passes transactions last year, for example, generated a net gain of 13.65 million Euros and in 2009/2010 of approximately 9 million Euros (Figure No. 20).
Figure No. 7 - Operating and Net Results SC Braga SAD
(Source: author, based on the SCB SAD Annual Report)
- Asset, Liability and Equity
The asset of SAD Braga reached its peak in the most recent season (2011/2012), supported at about two-thirds by "third-party debts" that correspond to the amounts receivable as a result of the sale of sports rights of certain athletes.
In relation to liabilities, there was a doubling of the previous financial year to the latest, explained by a need to ask for bank credit.
The SAD of SC Braga presents itself as the only SAD of the four main Portuguese clubs to show a positive development and increasing equity over the past three years. For such an occurrence, contributed the excellent net results achieved in the last three seasons, which put the SC Braga on a very promising growth cycle at the economic and financial level.
Figure nº 8-Asset, Liability and Equity SC Braga SAD
(Source: author, based on the SCB SAD Annual Report)
-
Economic and financial indicatorsAs for other economic and financial indicators, the SC Braga, in seasons where we have data to analyze, presents positive results that translate into a return on equity of above 50% always, economic assets up 19% and solvency ratios which in the last two seasons were around 30% and 24% respectively. A true example of success in what concerns to economic and financial policy in this area of activity.
Concluding, SC Braga holds the SAD with the highest growth tendency, showing a significant economic and financial stability.
Figure No. 9 – Economic and financial indicators SC Braga SAD
(Source: author, based on the SCB SAD Annual Report)
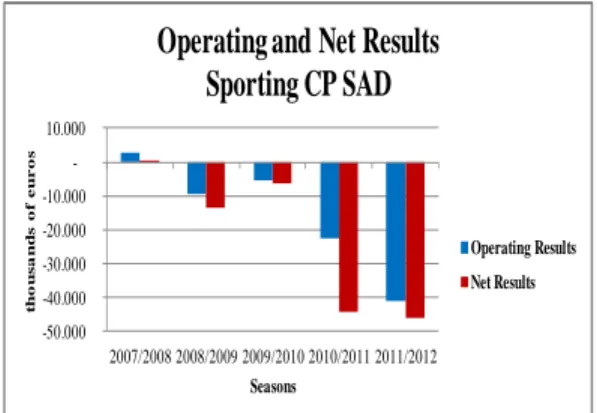
Sporting Clube de Portugal – Futebol,
SAD
- Operating and Net Results
Sporting CP SAD´s has been accumulating negative net results for four consecutive years. In the last two years it has accumulated almost 90 million Euros of losses. Something that essentially is justified by the low values that the Sporting CP SAD has received regarding prizes for the participation and performance in European competitions on a par with the personnel costs that are too high for the structure and for the sporting results achieved by Sporting CP SAD. -4.000 -2.000 -2.000 4.000 6.000 2007/2008 2008/2009 2009/2010 2010/2011 2011/2012 t h o u s a n d s o f eu ro s Seasons
Operating and Net Results
SC Braga SAD
Operating Results Net Results -10.000 -10.000 20.000 30.000 40.000 50.000 2007/2008 2008/2009 2009/2010 2010/2011 2011/2012 t h o u s a n d s o f eu ro s SeasonsAsset, Liability and Equity
SC Braga SAD
Asset Liability Equity unit.: k€ ITEMS 2007/2008 2008/2009 2009/2010 2010/2011 2011/2012 Asset 29.510 18.529 38.752 Liability 29.937 14.051 29.546 Non-Current Liabilities 4.250 1.573 1.981 Equity - 2.300 600 4.478 9.206 Ongoing Capitals 4.850 6.051 11.187 Fixed Assets 9.900 10.889 12.575 Working Capital - 5.050 - 4.838 - 1.388 Cyclical Requirements 14.422 6.575 10.629 Cyclical Resources 3.168 2.978 3.282Working Capital Requirements 11.254 3.597 7.347
Treasury - 16.304 - 8.435 - 8.735
Operating Results 4.036 5.561 5.566
Net Results - 2.500 3.300 5.191 5.089
Return on Equity Ratio not applicable 550% 116% 55%
Return on Economic Asset 19,1% 38,4% 27,9%
Solvency 2% 32% 31%
Financial Autonomy 2% 24% 24%
Figure No. 10-Operating and Net Results Sporting CP SAD
(Source: author, based on the SCP SAD Annual Report)
-
Asset, Liability and EquityWith regards to the assets, we find that the values were not able to approach or exceed the liabilities, with the exception of the 2009/2010 singular season where the value of the asset more than doubled, compared to the previous season. This happened mainly due to an abnormally high value in the item of property, plant and equipment justified by insertion of Sporting Academy in this account, that season.
Already the liabilities of SAD has been over the past five years, between 140 and 240 million Euros, justified by financial debt, including amongst others, bank loans and bondholders, necessary to meet the policy outlined by the top managers, investing in players through investment partnerships for the negotiation of the sporting rights of athletes.
Watching the evolution of the equity resulting from the comparison between assets and liabilities, we note that in the last five seasons, only the already mentioned and atypical 2009/2010 season produced positive equity. Moreover, in the most recent year, the SAD exceeded the negative record in recent years, reaching almost 76 million Euros, a result of accumulating negative net results in previous years.
Figure No. 11 – Asset, liability and Equity Sporting CP SAD
(Source: author, based on the SCP SAD Annual Report)
- Economic and financial indicators
With regard to the remaining economic and financial indicators analyzed, we can see that: the return on equity, economic assets, solvency and financial independence reflected mainly negative values. The only indicator that has been typically positive is the treasury. This is justified by the fact that the SAD has moved short-term debt to long-term debt, renegotiating payment periods and thus relieving the treasury.
In this way, we can conclude that the Sporting CP denotes be going through a period of enormous economic and financial difficulties with the worst-ever results in the history of the SAD in terms of net profits, operational, capital and reserves, solvency and financial autonomy. Nowadays, it becomes crucial to Sporting CP to review its economic and financial policy in order to be able to present positive results on a regular basis.
Figure No. 12 – Economic and financial indicators Sporting CP SAD
(Source: author, based on the SCP SAD Annual Report)
5.2. Sporting Results
In the next stage of our project, we will scrutinize the sporting results of the clubs, associated to the SAD´s, in the last five seasons. So, in the next chapter of our paper we will be able to draw up a response to our research problem placed initially, crossing the financial aspects with the sports. In this chapter, we begin by clarifying the objectives outlined by the clubs. Below is an analysis of the results achieved in the last five seasons and the comparison with the objectives initially placed.
5.2.1 Objectives outlined at the beginning of the
seasons
As we know, the objectives outlined by the clubs for their sporting seasons suffer constant changes throughout the season, according to the results they are achieving. Due to this condition and taking into consideration that there are significant differences in
-50.000 -40.000 -30.000 -20.000 -10.000 -10.000 2007/2008 2008/2009 2009/2010 2010/2011 2011/2012 t h o u s a n d s o f eu ro s Seasons
Operating and Net Results
Sporting CP SAD
Operating Results Net Results -100.000 -50.000 -50.000 100.000 150.000 200.000 250.000 300.000 2007/2008 2008/2009 2009/2010 2010/2011 2011/2012 t h o u s a n d s o f eu ro s SeasonsAsset, Liability and Equity
Sporting CP SAD
Asset Liability Equity unit.: k€ ITEMS 2007/2008 2008/2009 2009/2010 2010/2011 2011/2012 Asset 143.421 126.462 254.040 136.492 144.408 Liability 146.016 142.443 238.792 166.138 220.001 Non-Current Liabilities 97.617 119.729 225.641 53.382 124.316 Equity - 2.595 - 15.981 15.248 - 29.646 - 75.593 Ongoing Capitals 95.022 103.748 240.889 23.736 48.723 Fixed Assets 29.037 26.713 181.799 166.179 62.917 Working Capital 65.985 77.035 59.090 - 142.443 - 14.194 Cyclical Requirements 11.964 2.927 530 20.587 15.121 Cyclical Resources 5.814 6.806 1.562 30.454 30.952Working Capital Requirements 6.150 - 3.879 - 1.032 - 9.867 - 15.831
Treasury 59.835 80.914 60.122 - 132.576 1.637
Operating Results 2.563 - 9.391 - 5.515 - 22.528 - 41.113
Net Results 597 - 13.349 - 6.258 - 43.991 - 45.947
Return on Equity -23% Ratio not applicable -41% Ratio not applicable Ratio not applicable
Return on Economic Asset 7,3% -41,1% -3,1% -14,4% -87,3%
Solvency -1,8% -11,2% 6% -18% -34%
Financial Autonomy -1,8% -12,6% 6% -22% -52%
the nature of the four clubs, we considered that the most appropriate and fair way to setting these objectives would consider them from messages of Presidents published in the annual report of each SAD.
In this way, Jorge Nuno Pinto da Costa2
mentions the objective of "making FC Porto, collect
more trophies" and Luis Filipe Vieira3 says will keep
investing in football because "it is crucial to stay among the elite of European football (...) and achieve success at the national level".
As for the Sporting CP, Luis Godinho Lopes4 in the
latest annual report indicates that the club "made a substantial strengthening in football team (...) with the conviction to obtain results suitable with the history of the club". What means that Sporting CP at the beginning of the season wanted to win the Portuguese league.
For SC Braga, António Salvador5 is quite clear in
the definition of the objectives of the club. He said that: "we will seek a sport increasingly efficient management that consolidate us more and more in national and international sporting scene and, therefore, be placed in competitions with the best european clubs". It follows then that the SC Braga aspires to achieve one of the top three places in the table.
5.2.2 Results achieved by club
We will now present a summary analysis of the evolution of sporting results achieved by each club. This procedure will allow the comparison between the sports and financial economic results of each SAD. Such comparison will be addressed in the next chapter. Thus we have:
a) FC Porto
As we can see in figure No. 13, FC Porto won four of the last five national championships, having won three times the cup of Portugal, joining four Portuguese Super Cups, which is not represented in this figure due to the fact that it is a one match trophy. These twelve national trophies still managed to join a European conquest, the Europa League, in 2010/2011, when FC Porto won four of the five trophies up for grabs, including the Portuguese Super Cup.
Then, it is easy to conclude that the sports scores of FC Porto in the last five years have been globally positive. Justified by internal and financial stability and right choices about of managers and players.
2 FC Porto President 3 SL Benfica President 4Sporting CP President 5SC Braga President
Figure No. 13 - FC Porto sporting Results (last five seasons)
(Source: author, based on data from the site www.zerozero.pt)
b) SL Benfica
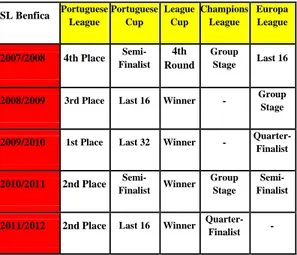
Studying the past five years of SL Benfica it is inevitable to make a link between the improvement of sports results of the club and the hiring of Jorge Jesus to manage the football team in season 2009/2010. Nevertheless, the club failed to have financial stability over the past five years and has often missed the chance to win trophies in crucial moments. So, globally, the SL Benfica has not managed to overtake its main rival, the FC Porto in sporting terms over the past five years.
In conclusion, it is clear that the sports results of SL Benfica were not a success, not when the main objective is only achieved once out of five possibilities. But they were also not a total failure and the prospects (clearly improvement the past three seasons) are positive. Still, we will have to sort the sporting results achieved as negative, especially when compared, in a similar criteria, to FC Porto.
Figure nº 14 –SL Benfica sporting Results (last five seasons)
SL Benfica Portuguese League Portuguese Cup League Cup Champions League Europa League
2007/2008 4th Place Semi-Finalist 4th Round Group Stage Last 16
2008/2009 3rd Place Last 16 Winner - Group Stage
2009/2010 1st Place Last 32 Winner - Quarter-Finalist 2010/2011 2nd Place Semi-Finalist Winner Group Stage Semi-Finalist
2011/2012 2nd Place Last 16 Winner Quarter-Finalist -
(Source: author, based on data from the site www.zerozero.pt)
FC Porto Portuguese League Portuguese Cup League Cup Champions League Europa League 2007/2008 1st Place Runner-Up 3rd Round Last 16 -
2008/2009 1st Place Winner Semi-Finalist
Quarter-Finalist -
2009/2010 3rd Place Winner
Runner-Up Last 16 - 2010/2011 1st Place Winner 2nd Group Stage - Winner
2011/2012 1st Place Last 32 Semi-Finalist
Group Stage Last 32
c) SC Braga
The case of SC Braga has important characteristics that should be noted compared to the previously analyzed clubs, but also in relation to Sporting CP. This singular characteristic is simple enough to emphasize: the SC Braga, never in its history began the season aiming the title in the Portuguese League. Something that does not prevent us from being able to analyze the results achieved by SC Braga, even comparing them in certain parameters with the other clubs.
As we saw earlier, the objective of the SC Braga is to achieve one of the top three places in the league table at the end of the season. From 2007 to 2010 the club progressed from seventh to second place of the league table of the Portuguese League. And subsequently to very positive sports scores in 2009/2010, the Club was able to give continuity to the progress they wanted, playing even the Champions League in 2010/2011, and the final of Europa League in the same year, losing to FC Porto.
In this way, the whole of sporting results achieved by SC Braga in the five most recent seasons are clearly positive. The club appears to be in a solid phase of sports growth being even able to rival the top clubs of Portuguese League that have considerably higher budgets. For example, for the season 2011/2012, the budget of SC Braga corresponded to about 15% of the budget of FC Porto, 21% of the SL Benfica and 50% of the Sporting CP.
Figure nº 2 – SC Braga sporting Results (last five seasons)
(Source: author, based on data from the site www.zerozero.pt)
d) Sporting CP
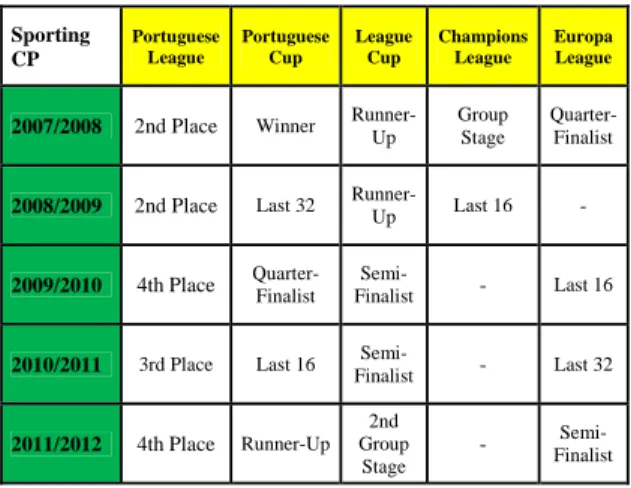
With regard to Sporting CP, there is a fact that clarifies their sports production in the past five years.
They only won one title (Portugal Cup 2007/2008). Their results in Portuguese League have been negative and the European “routes” have not been convincing.
The explanation for these less successful sports scores will possibly be related to the poor choice of sports agents. As usual the club has been living with administrative instability. The club associates have chosen on March 23, 2013 the fourth President in the past four years. Managers have already been nine during this period and this may have contributed greatly to this failure at the sports level in the last three seasons.
Figure nº 16 – Sporting CP sporting Results (last five seasons)
(Source: author, based on data from the site www.zerozero.pt)
6. Cross-study of economic-financial
results with the sports results of each
of the SAD´s and conclusions
6.1. Comparison between economic and
financial results and sports results of SAD´s
6.1.1 Futebol Clube do Porto – Futebol, SAD
Starting this analysis by FC Porto SAD, who achieved positive financial results all seasons under scrutiny, with the exception of the last. This season (2011/2012) was characterized by the weaker European club performance in the last five years. In its worst season under analysis (2009/2010), the SAD was able to achieve positive net results, even by a minimum margin, as well as keep the equity also positives. In the other three seasons, FC Porto won the national title, even with two achievements of the Portuguese Cup, a Europa League and two
Sporting CP Portuguese League Portuguese Cup League Cup Champions League Europa League
2007/2008 2nd Place Winner Runner-Up
Group Stage
Quarter-Finalist 2008/2009 2nd Place Last 32
Runner-Up Last 16 - 2009/2010 4th Place Quarter-Finalist Finalist Semi- - Last 16
2010/2011 3rd Place Last 16
Semi-Finalist - Last 32 2011/2012 4th Place Runner-Up 2nd Group Stage - Finalist Semi-SC Braga Portuguese League Portuguese Cup League Cup Champions League Europa League
2007/2008 7th Place Last 32 3rd Round - Last 32
2008/2009 5th Place Last 32 1st Group
Stage - Last 16
2009/2010 2nd Place Quarter-Finalist
2nd Group
Stage - -
2010/2011 4th Place Last 32 2nd Group Stage
Group Stage
Runner -Up
2011/2012 3rd Place Last 32
qualifications for the second phase of the Champions League.
We can thus conclude that the FC Porto SAD was able to match sports success with business success in three of the five seasons.
6.1.2 Sport Lisboa e Benfica – Futebol, SAD
The SL Benfica, unlike FC Porto, obtained irregular sports scores in the last five years. Example of this is that, in five national championships, SL Benfica final standings were in four different places (1st, 2nd, 3rd and 4th). As a fact, the club managed only one season of sports success, 2009/2010. It was a season without positive net results, due to the large investment and consequent bank indebtedness. Curiously, or perhaps not, the season with more satisfactory economic and financial results was the one that had worse sporting performance, 2007/2008. This is the paradigm that made us raise interest in the theme of this research; find the justification for a SAD, in this case we have the example of SL Benfica, that does not have been successful in business but has success in sports or vice-versa, always exploring the factors behind these events and suggest measures or explain examples to achieve the success in both areas, as we will do in the following chapter. However, we can say that the SL Benfica SAD could not get together, sporting, economic and financial positive results in any of the last five years.
6.1.3 Sporting Clube de Braga – Futebol, SAD
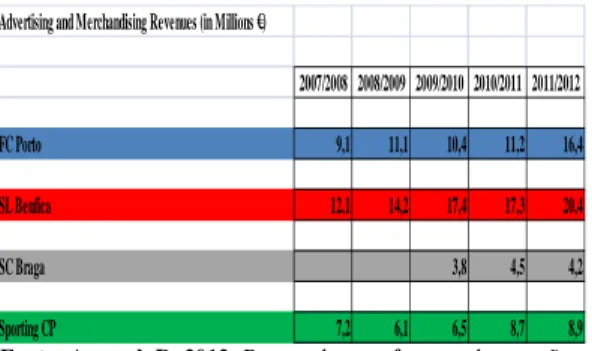
The 2009/2010 season was a milestone of change in SC Braga, at all levels. The club reached a very positive sports performance as well as net profit and equity. It was found to be a success case and a positive answer to our research problem. However, it is necessary to ensure that we are not in the presence of a sporadic case. As a fact, in the two following seasons, SC Braga consolidated these sports and business results. In addition, the SAD has brought economic financial results always positive in the last three seasons, resulting from a strong increase in revenues, either through capital gains on the sale of players, stadium revenues (fees, tickets) or advertising and merchandising revenue and obviously, premiums (see figures no. 20-24), all this without dismantling the team´s competitiveness and ability to achieve its sporting objectives.
6.1.4 Sporting Clube de Portugal – Futebol,
SAD
Sporting CP is currently experiencing one of the most troubled period in its history, at all levels that are being investigated in this study. Far more serious than the problems in sports, were Sporting CP does not reach the aim of winning the Portuguese League for 11 seasons, are the economic and financial
difficulties that result in negative net results for four consecutive seasons. In addition, the creditors of the club, want to proceed to a special revitalization plan that, in accordance with the UEFA's financial fair play rules, would remove the club from the European competitions, which would be absolutely catastrophic in sporting terms. So, we can see that the Sporting CP in the last years, especially the last three, has been a true model of sports and financial failure.
6.2. Key measures to achieve both economic,
financial and sporting success and their conclusions about the research problem
For a SAD to be economically viable and reach at the same time sports success there are a number of guiding principles that should be followed. Amaral (2012) tells us that "managing a football club implies taking correct financial and sporting decisions over many years" and is about six key measures that we will focus in this subchapter, being that some of them are, of course, intertwined.
1) Streamline the personnel costs
Streamline means making more efficient, and that is what we should focus on a SAD when focuses on its personnel costs. It stands to reason that it is not good to have a too big structure, where often the roles that employees play overlap each other. The framework should be simple and developers should be very knowledgeable and well paid, if this is in line with their productivity. Between two employees with similar skills, certainly the one that feels more motivated, better paid and an active part of the future of the institution, will be more efficient. For example, as Amaral (2012) noted, in the past 11 years, the club which won the Portuguese League was the one that paid higher wages in its structure, something that is symptomatic of what should be the practice to be applied in the management of human resources of each SAD: avoid waste with high wages of low productivity and pay well the existing talent that is always present in the decision-making process.
2) Supporters with the project
For better sporting, economic and financial results it is essential that everyone around the project were dedicated and focused on success. As we examine, SAD´s have sports clubs as a base, so we can never forget about the supporters and especially the members.
The importance of members and supporters is massive, both in financial or emotional terms. Surely a team will play more motivated with a stadium full of support than otherwise and, certainly, that the
finances of the SAD will “appreciate” all the members and supporters contribution to the revenue increase. In this way, it is truly important to aggregate the supporters to the project. Something that is conquered with sports success. That will be an incentive to increase the revenues of merchandising or game tickets. These revenues were responsible for at least one third of operating profits of the three major Portuguese SAD´s in the last financial year. 3) Promotion of capital gains on the transaction
of players
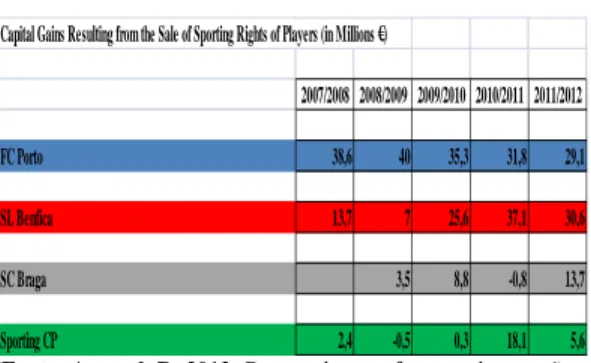
Generate capital gains on the transaction of players has been, in combination with the prizes from participation in European competitions, one of the most relevant revenues of the Portuguese SAD´s in the last five years. As we can see in Figure No. 20, FC Porto and SL Benfica have led in this regard. They even had a strong international relevance, transferring players to some of the best clubs in the world and getting important sums for them. Cases of Falcão (Atletico Madrid) and Hulk (Zenit St. Petersburg) both by 40 M € each, Lisandro Lopez (OL.Lyon) by 24 M € or Bruno Alves (Zenit St. Petersburg) by 22 M €, these were the higher values received in FC Porto´s case. As for SL Benfica we have the examples of Witsel (Zenit St. Petersburg), by 40 M €, Fábio Coentrão (Real Madrid) 30 M €, David Luiz (Chelsea) and Di Maria (Real Madrid) by 25 M € each, Ramires (Chelsea) by 22 M € and Javi Garcia (Man. City) by 20 M €.
As we have seen, these are impressive values for a secondary national league at European level, such as the Portuguese, which constitute a real help to the accounts of the SAD´s. Here comes the importance of buying well (cheap players, but with margin of progression), upgrade and then sell them, if possible for top clubs in order to enhance the brand and the reputation of the club.
4) Investment in development of players
The players upgrade attributes, when competently executed, is one of the most important measures for the sustainability of the economic and financial structure of a SAD. As we can see in the study of Reilly, Cabri & Araújo (2005: 181) "football throws up every time to a higher level. In more recent times, it is faster, athletic, physical and tactical that once "and so, we need to "shape" the athletes from very young to have capital gains in the future. As is easy to understand, it is also quite cheaper to boost a young player, than buying a player with 24 or 25 years to be part of that squad. This without considering the affective, emotional or psychological components of a player formed in the club. It should not be forgotten that, in case of sale of the athlete, the
capital gains will be far superior to the SAD because of the fact that the cost of acquisition was very low.
In this context, a number of measures have been taken to encourage the development of young players, as is the case for example of the recent creation and placement of “B teams” of top clubs to compete in the national championship of the 2nd League. This leads to a significant boost in the development of young athletes, who have a solid competitive basis for progress in their skills. At European level, UEFA has also entered standards in the regulation of entry of athletes in competitions that require each club to sign up at least 8 players formed in the club.
Briefly, the clubs and their SAD´s must have a structure capable of generating great talents or, alternatively, discover them quite young in appealing markets so as to avoid spending large amounts on the purchase. In this way, clubs can follow the evolution of the athletes, preparing them technical, physical and mentally to play an important role in the future of the club.
5) Careful selection of staff and hiring
The selection of the technical team and the signings of the players for the main football team is one of the most important sporting factors to be taken into account by a SAD when you want to succeed. The members of the technical team needs to have technical, physical, mental and tactical knowledge that was crucial to be competent. And then, they must know how to lead a team, they will have to be leaders.
As Welch (2005: 63) "before being a leader, the success has to do with personal growth, when it becomes a leader, the success has to do with the growth of others". A leader, or a manager, has to know how to make others grow, overcome in the pursuit of achieving the objectives. A set of good players are unlikely to succeed if they do not work as a team, if we don't have someone really competent to guide them. In addition, currently, according to Hughes (2010), "it is expected that managers will have an important role in a wide range of functions in the clubs, from the recruitment and human resources, to the training and financial matters".
With regard to the composition of the squad, for example, we note that some of the players hired by the four SAD´s under review in the past five years pose significant damage, with regard to their cost of acquisition, earnings and productivity. It is precisely the case of Prediguer (3.5 M €), Cristian Rodriguez (7 M €), Stepanov (3.5 M €) from FC Porto; Edcarlos (2 M €), Balboa (4 M €) or Emerson (2.5 M €) in SL Benfica or Sinama-Pongolle (6 M €) on Sporting CP, just to name a few players who no longer are part of
the clubs and therefore no longer have a chance to improve in them. It is precisely examples like these that we must avoid. Examples without the minimum investment return and that contrast with the good practices of capital gains on transfers of players, generated by SAD´s, that wish to achieve sporting, economic and financial success.
6) Raise the competitiveness of the team
Last but not least, it is essential to develop sustainable competitive teams year after year. The revenues of the main Portuguese SAD´s are also very dependent on prizes from participation in European competitions and to ensure the place in these competitions is strictly indispensable to have a competitive team. For the four SAD´s in study, the participation in the Champions League represents a strongly positive cash flow. However, there is no place for all and even once it is necessary to be able to compete with the top teams of the main European Leagues in order to gain even more revenues and prestige that helps to enhance the club´s image all over the World.
In summary:
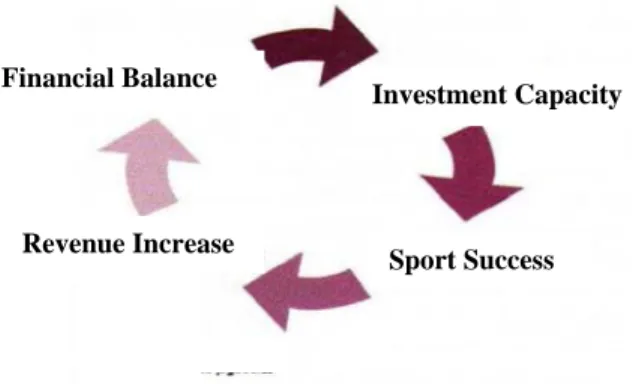
Figure No. 17 - Cycle to achieve both economic, financial and sporting success a SAD
(Source: SLB SAD Annual Report 2004/2005, pg.17)
It is simple to understand, in this phase of our project, the economic, financial and sports aspects are closely linked in a SAD. As such, we can see that a SAD financially balanced has investment capacity which, in turn, applied correctly, really increases the chances of reaching sport success, whose inherent revenues increase strengthens the financial stability of the SAD. This model certainly served as an example for what FC Porto and SC Braga have done in recent years, in what about the strategy of SAD´s concerns. In this way, they were able to demonstrate that it is realistic and plausible for a sporting institution to achieve successful results in sports and, at the same time, in the economic and financial aspects.
7. Conclusion
At the present time, we are faced with a complex socio-economic context, where it is increasingly crucial for organizations to be extremely strict and follow a set of fundamental standards for its proper application. This context in which we live highlights, by itself, the importance of a study like this where you can demonstrate how organizations, including sport (SAD´s), can not only survive, but more than that, have success.
We started the project with the definition of objectives to be achieved. The main one is to understand if it is possible to achieve sporting, economical and financial success together. Then have a process of assimilation of essential concepts in the review of literature, so we could have a solid basis for the development of research, such as: SAD, sports success or balanced financial structure. After that, we looked at the Annual Reports of the SAD´s and respective sports scores, to analyze the economic, financial and sporting activity, which translated in the following conclusions:
In accordance with a number of basic criteria in the management of SAD´s, it is possible to achieve success in the three fields mentioned above. Taking as an example, the strategy followed by the FC Porto and SC Braga SAD´s. In particular due to the establishment of competitive football teams, able to get positive sports performances and financial return, for example through the prizes for performances in competitions where they participated, or development of players who subsequently generate more capital gains when they are sold, citing only two examples of the most significant revenue.
Following this conclusion, we were able to achieve all the objectives set for this project that were: in addition to the answer to the question of research, by understanding what is a SAD and how it operates in the market, as well as interpret clearly and concisely the accounts published by those. It was also relevant to analyze the sports scores of clubs and confront them with their budgets, in order to clearly define a balanced financial structure. It was also necessary to investigate what are the objectives of sports clubs to be able to assess their sporting performance and, finally, we have proposed solutions and measures to be taken for a SAD if it wants to be sustainable and to provide, at the same time, positive sports results.
7.1. Clues to further research
As clues to further research within the framework of the study that we developed, we can suggest the implementation of a study, covering not only the main national sports organizations, but also in an international horizon, which would take the Sport Success
Investment Capacity
Revenue Increase Financial Balance
application of the Simple Linear regression model. So we would have the possibility to have a broader perspective on the reality of professional football in Portugal and abroad, under the sporting, economical and financial perspectives.
In another point of view, could be an expansion of the investigation to other kind of sports. In this way, it would be possible to have a broader view on the possibility of joint existence of economic, financial and sporting success in the sport in Portugal.
Another aspect that would be attractive to address, as a complement to this analysis, would be the ability to investigate and study scientifically, through the Multiple Linear regression model, all factors that influence sporting results achieved by SAD´s, checking the existence of correlations between these variables in order to find statistically descriptive factors for the sporting results achieved.
Finally, we also suggest a research project idea that relates the sporting success of the Portuguese teams in international competitions with the "Portugal Brand". And, in addition, to understand how it could contribute to a further increase in exports, in order to help in obtaining superavits on balance of payments, an essential factor for the reduction of the foreign debt of Portugal.
8. Bibliography
Monographs (books):
[1] Amaral, D. 2012. Porque é que o fc porto é
campeão e o benfica só ganha taças da liga?. Lisboa: Casa das Letras.
[2] Borges, A., Rodrigues, A., & Morgado, J.
2004. Contabilidade e finanças para a gestão. Lisboa: Áreas Editora.
[3] Carvalho, J. C. 2004. A lógica da logística.
Lisboa: Edições Sílabo.
[4] Dobson, S., & Goddard, J. 2001. The
Economics Of Football. Cambridge: Cambridge University Press
[5] Esperança, J. P., & Matias, F. 2009.
Finanças Empresariais. Lisboa: Texto Editores.
[6] Reilly, T., Cabri, J., & Araújo, D. 2005.
Science and football V - The proceedings of the fifth world congress on Science and Football. Oxon: Routledge
[7] Welch, J. 2005. Vencer. Lisboa: Actual
Editora.
[8] Scientific journals:
[9] Battle, R., Bull, A., Hawkins, M., Hearne,
S., Parkes, R., & Thorpe, A. 2011. Football Money League 2011. Football Money League. 2011 Edition
[10] Battle, R., Bridge, T., Bull, A., Hanson, C.,
Taylor, R. & Thorpe, A. 2012. Football
Money League 2012. Football Money League. 2012 Edition
[11] Bosshardt, A., Bridge, T., Hanson, C.,
Shaffer, A., Stenson, C., & Thorpe, A. 2013. Football Money League 2013. Football Money League. 2013 Edition
[12] Gregson, J. 2010. The business of football -
Running a team is becoming a ‘science’ for academia and the corporate world. The Wall Street Journal. Online Edition
Unpublished references:
[13] Nunes, M. 2009. Equilíbrio Financeiro.
Projecto de Mestrado em Gestão, ISCTE.
[14] Silva, V. M. 2009. Plano de negócio de uma
empresa de aquisição e recuperação de créditos. Projecto de Mestrado em Gestão, ISCTE.
[15] Pereira, M. 2012. Orçamentos: Uma liga
desigual.
http://www.cmjornal.xl.pt/detalhe/noticias/s port/fc-porto/orcamentos-uma-liga-desigual. 18 de Agosto.
References removed from the internet:
[1] Bento, A. Como fazer uma revisão da
literatura: Considerações teóricas e práticas.
http://www3.uma.pt/bento/Repositorio/Revis aodaliteratura.pdf. 2012.
[2] Futebol Clube do Porto – Futebol SAD.
Relatórios & Contas 2007/2008; 2008/2009; 2009/2010; 2010/2011 e 2011/2012. http://web3.cmvm.pt/sdi2004/emitentes/emit _pca.cfm?num_ent=%25%23%24CZ%22% 5DX%20%0A
[3] Futebol365. Mercado de transferências.
http://www.futebol365.pt/transferencias/. 2012.
[4] IAPMEI. Glossário.
http://www.iapmei.pt/iapmei-gls-02.php?glsid=4&letra=A. 2013
[5] Pordata. Praticantes desportivos federados:
total e por algumas modalidades em Portugal.
http://www.pordata.pt/Portugal/Praticantes+ desportivos+federados+total+e+por+alguma s+modalidades-2226. 2012.
[6] Portal da empresa. Sociedade Anónima
Desportiva – Constituição. http://www.portaldaempresa.pt/cve/services/ balcaodoempreendedor/Licenca.aspx?CodCa
tegoria=47&CodSubCategoria=1&CodActiv idade=1151&CodLicenca=1950&IdUnico=0
[7] Sport Lisboa e Benfica – Futebol SAD.
Relatórios & Contas 2007/2008; 2008/2009; 2009/2010; 2010/2011 e 2011/2012. http://web3.cmvm.pt/sdi2004/emitentes/emit _pca.cfm?num_ent=%25%23TKY%22%3D T%20%0A
[8] Sporting Clube de Braga – Futebol SAD.
Relatórios & Contas 2010/2011 e 2011/2012. http://www.scbraga.pt/sc-braga/relatorio-e-contas-1
[9] Sporting Clube de Portugal – Futebol SAD.
Relatórios & Contas 2007/2008; 2008/2009; 2009/2010; 2010/2011 e 2011/2012. http://web3.cmvm.pt/sdi2004/emitentes/emit _pca.cfm?num_ent=%25%23%24C%5D%2 3%3D8%20%0A
[10] Sociedades Anónimas Desportivas. Análise
do regime jurídico e fiscal. http://www.portugal.gov.pt/media/364613/re l_gt_sad.pdf. 2012.
[11] UEFA. Fair - play financeiro.
http://pt.uefa.com/uefa/footballfirst/protectin gthegame/financialfairplay/index.html#fair+ play+financeiro. 2012.
[12] Zerozero. http://www.zerozero.pt/. 2012.
9. Attachments
a) Table showing the evolution of the number of federated athletes per year in total:
Figure No. 18 - Total number of practitioners
(Source: Pordata)
b) Table showing the evolution of the number of federated athletes per year in soccer:
Figure No. 19 - Total number of practitioners (football)
(Source: Pordata)
c) The form used for the calculation of economic and financial indicators:
Ongoing Capital = Non-Current Liabilities + Equity Working capital = Ongoing Capital - Fixed Assets Cyclical Requirements = Clients + Inventories Cyclical Resources = Suppliers + State
Working Capital requirements= Cyclical
Requirements - Cyclical Resources
Treasury = Working Capital - Working Capital Requirements
Return on Equity = Net results / Equity
Economic asset = Fixed assets + Working capital requirements
Return on Economic asset = operating results / Economic Asset
Solvency = Equity / Liabilities Financial Autonomy = Equity / Assets
d) Tables concerning revenues from four SAD´s in analysis:
Figure No. 20 – Capital Gains Resulting from the Sale of Sporting Rights of Players (in Millions €)
(Fonte: Amaral, D. 2012. Porque é que o fc porto é campeão e o benfica só ganha taças da liga?)
Figure No. 21 – Direct Revenues from the Stadium (in Millions €)
Federações 1996 1997 1998 1999 2000 2001 2002 2003 2004 2005 2006 2007 2008 2009 2010 2011 Futebol 95746 97252 106051 110822 113895 115283 120003 128471 133511 131835 133360 136387 141958 144106 148106 151572
NÚMERO TOTAL DE PRATICANTES, POR FEDERAÇÃO DESPORTIVA (1996-2011)
Capital Gains Resulting from the Sale of Sporting Rights of Players (in Millions €)
2007/2008 2008/2009 2009/2010 2010/2011 2011/2012
FC Porto 38,6 40 35,3 31,8 29,1
SL Benfica 13,7 7 25,6 37,1 30,6
SC Braga 3,5 8,8 -0,8 13,7