ARTIGO ORIGINAL
Relation between QT Variables and Left Ventricular
Geometry in Athletes and Obese Children
Relação entre Variáveis QT e Geometria do Ventrículo
Esquerdo em Atletas e Crianças Obesas
1. Department of Pediatrics. Faculty of Medicine. Çanakkale Onsekiz Mart University. Çanakkale. Turkey. 2. Department of Pediatric Cardiology. Faculty of Medicine. Çanakkale Onsekiz Mart University. Çanakkale. Turkey. Autor correspondente: Şule Yildirim. [email protected]
Recebido: 20 de abril de 2015 - Aceite: 07 de setembro de 2015 | Copyright © Ordem dos Médicos 2016
Şule YILDIRIM1, Fatih Köksal BINNETOĞLU2, Fatih BATTAL1, Hakan AYLANÇ1, Nazan KAYMAZ1, Mustafa TEKIN1,
Naci TOPALOĞLU1, Zuhal AŞIK1
Acta Med Port 2016 Feb;29(2):95-100 ▪ http://dx.doi.org/10.20344/amp.6538
RESUMO
Introdução: O objetivo deste trabalho foi avaliar a relação entre variáveis QT e geometria do ventrículo esquerdo em atletas e crianças obesas.
Material e Métodos: Foram incluídos no estudo 209 crianças e adolescentes. Trinta e oito deles eram obesos, 140 foram atletas e 31 tinham peso normal. Crianças com antecedentes funcionais e estruturais de doenças cardiovasculares (adquiridas e congénitas), doenças sistémicas crónicas, hipertensão arterial, apneia do sono, doenças endocrinológicas foram excluídos. Todos os sujeitos rea-lizaram detalhados exames eletrocardiográficos e ecocardiográficos.
Resultados: A dispersão do QT foi significativamente maior em crianças obesas, jogadores de basquete, jogadores de futebol e nadadores, por comparação com o grupo controlo (p < 0,05, p < 0,001, < 0,001 e < 0,01, respetivamente). Os jogadores de basquete-bol tiveram a maior dispersão do QT. O diâmetro ventricular esquerdo endosistólico (mm/m2) foi maior nos jogadores, nadadores, lutadores e jogadores de ténis por comparação com indivíduos obesos. A espessura do septo interventricular na diástole foi maior em nadadores por comparação com o grupo controlo (p < 0,001) e a espessura da parede posterior do ventrículo esquerdo foi sig-nificativamente maior nos jogadores e nadadores por comparação a indivíduos saudáveis (p < 0,01 e p < 0,001, respetivamente). A geometria do ventrículo esquerdo foi normal em 84 pacientes (47,1%), mas 34 pacientes (19,1%) tinham remodelação concêntrica, 20 (22,4%) apresentaram hipertrofia concêntrica e 40 (28,6%) apresentaram hipertrofia excêntrica. Não foi observada hipertrofia concên-trica e excênconcên-trica em indivíduos obesos. A hipertrofia do ventrículo esquerdo era proeminente nos grupos dinâmico e combinado mas a diferença não foi estatisticamente significativa (p = 0,204). A dispersão do QT foi significativamente maior nos obesos e praticantes de desporto dinâmico e combinado em relação ao grupo controlo (p < 0,05, p < 0,001 e p < 0,001, respetivamente).
Discussão: Neste estudo determinámos que a dispersão do QT é elevada em tipos de desporto dinâmico e combinado, e em crianças obesas.
Conclusão: A dispersão do QT é prolongada em pacientes obesos e atletas que participam em desporto dinâmico e combinado. Palavras-chave: Atletas; Criança; Electrocardiografia; Hipertrofia Ventricular Esquerda; Sobrepeso.
ABSTRACT
Introduction: We aimed to evaluate the relation between QT variables and left ventricular geometry in athletes and obese children. Material and Methods: This study included 209 children and adolescents. Thirty-eight of them were obese, 140 were athletes and 31 were normal weighted. Children with history of functional and structural cardiovascular diseases (acquired and congenital), chronic systemic diseases, hypertension, sleep apnea, endocrinological disorders were excluded. All subjects underwent detailed electrocardiographic and echocardiographic examination.
Results: QT dispersion was significantly higher in obese children, basketball players, football players and swimmers compared to control group (p < 0.05, p < 0.001, < 0.001 and < 0.01 respectively). Basketball players had the highest QT dispersion. Left ventricular endsystolic diameter (mm/m2) was higher in footballers, swimmers, wrestlers and tennis players compared to obese subjects. Interventricular septal thickness at diastole was highest in swimmers compared to control group (p < 0.001) and left ventricular posterior wall thickness was significantly higher in footballers and swimmers compared to healthy subjects (p < 0.01 and p < 0.001 respectively). Left ventricular geometry was normal in 84 patients (47.1%), but 34 patients (19.1%) had concentric remodelling, 20 (22.4%) had concentric hypertrophy and 40 (28.6%) had eccentric hypertrophy. No concentric and eccentric hypertrophy was observed in obese subjects. Left ventricle hypertrophy was prominent in dynamic and combined groups but it was not statistically significant (p = 0.204). QT dispersion was statistically higher in obese, dynamic sports and combined sports compared to control group (p < 0.05, p < 0.001 and p < 0.001 respectively).
Discussion: In this study we determined that QT dispersion is elevated in dynamic and combined sports types and obese children. Conclusion: QT dispersion is prolonged in obese and athletes who participate dynamic and combined sports.
Keywords: Athletes; Child; Electrocardiography; Hypertrophy, Left Ventricular; Overweight.
INTRODUCTION
QT variables such as QT interval, corrected QT interval (QTc), QT dispersion (QTd) and corrected QT dispersion (QTcd) reflect the regional repolarization anomalies of the ventricles. Prolonged dispersion time of ventricular
repolarization is associated with increased risk of ventricular arrhythmias and sudden cardiac death.1 Left ventricular
hypertrophy, arterial hypertension and chronic heart failure can prolong QTd.
ARTIGO ORIGINAL Obesity may lead to functional and structural abnormalities in cardiovascular system such as left atrial and ventricular dilation, eccentric left ventricular hypertrophy and right ventricular hypertrophy, systolic and diastolic dysfunctions and heart failure. Regular participation in high-level athletics may also lead to left ventricular enlargement, increased wall thickness and mass which is defined as ‘athlete’s heart’.
Various studies reported the increased QT interval in obese subjects. But in athletes the results are confusing. Few studies reported the increased QTd in athletes while some claimed the opposite.2-5 So the effect of sports in QTd
is controversial.
In this study we aimed to evaluate the QT variables in obese children and young elite athletes and to determine the relationship between QT variables and different left ventricular geometries.
We aimed to evaluate the relation between QT variables and left ventricular geometry in athletes and obese children.
MATERIAL AND METHODS Study design
This study was designed as a cross-sectional observational study.
Study population
This study included 209 children and adolescents (aged between 10 - 18), who were admitted to pediatric cardiology department and general outpatient clinics from October 2011 to July 2013. Thirty-eight of them were obese, 140 were athletes (25 basketball players, 31 footballers, 45 swimmers, 23 wrestlers and 16 tennis players) and 31 were normal weighted healthy adolescents and children. Athletes from 5 different sports clubs who regularly practiced at least 3 hours per week for at least the previous 2 years were included in this study. Athletes were grouped according to the type of exercise; dynamic (football, tennis), static (wrestling), and static and combined (basketball, swimming). The parents and children were informed of the aim of the study and provided written and verbal consent, respectively and the local ethics committee approved the study.
Exclusion criteria
Children with history of functional and structural cardiovascular diseases (acquired and congenital), chronic systemic diseases, hypertension, sleep apnea, endocrinological disorders were excluded. Patients with poor image quality were also excluded.
Study protocol Baseline variables
All subjects underwent detailed physical examination. Height, weight, blood pressures were measured and body mass index were calculated for each patient.
Body mass index
Body mass index was calculated by the formula; weight
(kg)/height(m).2 Obesity was considered if body mass
index exceeded the 95th percentile for sex and age based
reference values.
Blood pressure
Blood pressure was measured with an appropriate cuff after children had rested for 10 minutes in the supine position in a silent room. To avoid white coat hypertension, measurements were repeated at the end of echocardiographic examination. Participants who had systolic and diastolic blood pressure (both at least 3 different occasions) measurements below the 90th percentile for sex and height of the Turkish pediatric population were included in the study. Patients with borderline values were underwent 24-hour ambulatory monitoring to confirm the absence of hypertension.
Electrocardiographic evaluation
All the participants underwent 12-lead surface electrocardiography recorded at a speed of 25 mm/s in supine position after a 15-minutes rest. Maximum and minimum QT intervals, QTd and QTcd were measured manually with a caliper. The QT interval was measured from the beginning of QRS complex to the end of the T wave. QTd was determined as the difference between the maximum and minimum QT intervals. QTcd was determined as the difference between the maximum and minimum QTc intervals. Subjects who had bundle branch block on electrocardiography were excluded.
Echocardiographic evaluation
Transthoracic echocardiography was performed
by using a Vivid 7 GE Vingmed, Horten, Norway©
echocardiograph. B-Mode grayscale images were obtained from apical 4-chamber, and parasternal short-axis views at the level of the papillary muscle. M-modes of 2-Dimensional images were obtained from the parasternal long-axis views. Interventricular septal wall thickness, left ventricular posterior wall thickness, and left ventricular internal diameters were measured in all children. Cardiac chamber sizes and left ventricular systolic and diastolic functions were assessed in accordance with the guidelines of the American Society of Echocardiography.6 Systolic functions of the left
ventricular were evaluated using shortening fraction and ejection fraction. Left ventricular mass was calculated using the Devereux formula.7 Left ventricular hypertrophy was
considered if the left ventricular mass index was above the 95th percentile according to age and sex.8 Relative wall
thickness (RWT) was calculated by using the formula RWT: 2 X (posterior wall thickness/left ventricular end-diastolic volume). The athletes were classified according to LVMI and RWT.
• Normal: LVMI ≤ 95th percentile and RWT ≤ 0.42;
• Concentric left ventricular remodelling: LVMI ≤ 95th
percentile and RWT > 0.42;
• Concentric left ventricular hypertrophy: LVMI > 95th
ARTIGO ORIGINAL
• Eccentric left ventricular hypertrophy: LVMI > 95th
percentile + RWT ≤ 0.42.
Statistical analysis
All results are expressed as mean ± standart deviation. The variables were investigated using analytical methods (Kolmogorow Simirnov-Shapiro Wilk’s Test) to determine whether or not they are normally distributed. Results showed the normal distribution of variables and differences among the groups were than evaluated by analysis of variance (ANOVA) and post-hoc analysis were checked by Tukey corrected t- test. Correlations between variables were evaluated by Pearson’s rank correlation test. SPSS v13.0 (SPSS Inc., Chicago, IL, USA) was used for analyses, with p values < 0.05 considered significant.
RESULTS Clinical features
Demographic and clinical features of the study groups are summarized in Table 1. Although in normal limits, the basketball players had the highest systolic blood pressure compared the normal subjects (p < 0.001). The obese subjects had the highest BMI value compared to control group (p < 0.001).
Electrocardiographic evaluation
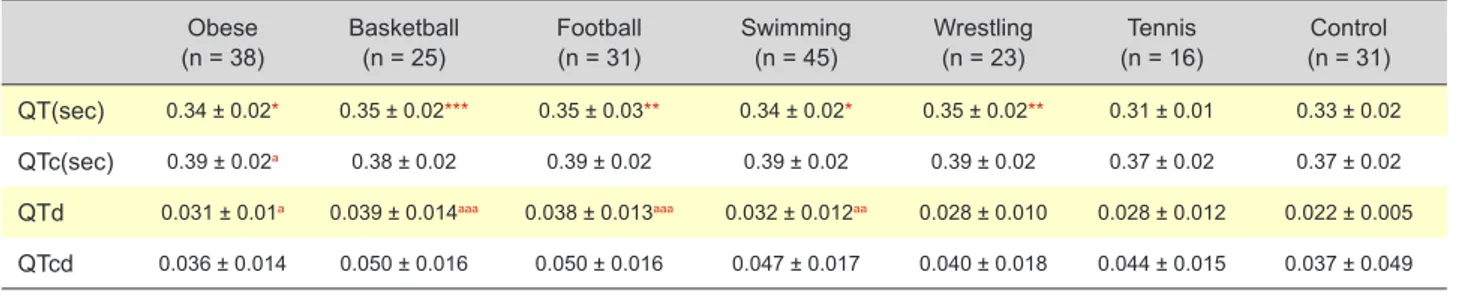
The QT interval was statistically highest in basketball players compared to control group (p < 0.001). QTc and QTc dispersion were not different among all the groups. But QTd were significantly higher in obese children, basketball players, football players and swimmers compared to control group (p < 0.05, p < 0.001, < 0.001 and < 0.01 respectively). Basketball players had the highest QTd (Table 2).
Conventional echocardiography
Left ventricular enddiastolic diameter (mm/m2) was
lowest in obese subjects. Left ventricular endsystolic diameter (mm/m2) was significantly higher in footballers,
swimmers, wrestlers and tennis players compared to obese subjects. Interventricular septal thickness at diastole (mm/ m2) was highest in swimmers compared to control group
(p < 0.001) and left ventricular posterior wall thickness at diastole (mm/m2) was significantly higher in footballers
and swimmers compared to healthy subjects (p < 0.01 and p < 0.001 respectively). Left ventricular mass index (g/ m2) was statistically higher in basketballers, footballers,
swimmers and wrestlers compared to control group (p < 0.001) (Table 3).
Table 1 - Demographic and antropometric features of study group (mean ± SD) Obese
(n = 38) Basketball(n = 25) Football(n = 31) Swimming(n = 45) Wrestling(n = 23) (n = 16)Tennis (n = 31)Control
Gender, m/f 20/18 25/- 31/- 19/26 23/- 9/7 21/10 Age, years 12.7 ± 1.9** 16.2 ± 1.1*** 15.1 ± 1.1 12.9 ± 1.6* 15.5 ± 1.5* 12.2 ± 0.83** 14.1 ± 1.7 Height, cm 155.1 ± 11.4 179.2 ± 8.7*** 168.8 ± 6.2** 154.6 ± 10.6 163.2 ± 9.3 157.5 ± 9.9 157.3 ± 15.2 Weight, kg 73.2 ± 14.4*** 72 ± 11.4*** 59.8 ± 7.11 47 ± 10.7 59.1 ± 13.5 47.4 ± 9.3 50.8 ± 13.2 SBP, mmHg 112.1 ± 11 119.4 ± 10.4*** 112.6 ± 8.6 109.6 ± 10.1 115.7 ± 8.2* 109 ± 8 107.3 ± 10.8 DBP, mmHg 70 ± 8** 63.4 ± 7.3 63.3 ± 9.1 60.4 ± 5.4 61.3 ± 7.7 64.9 ± 12 62.6 ± 8.4 Heart Rate, beat/min 82.3 ± 10.4 72.7 ± 13.5 74.5 ± 15.4 77.6 ± 15.1 72.7 ± 13.3 85.3 ± 11.6 74.6 ± 10.5 BSA, m2 1.7 ± 0.2*** 1.8 ± 0.2*** 1.6 ± 0.1** 1.41 ± 0.2 1.6 ± 0.2 1.43 ± 0.2 1.48 ± 0.24 BMI, kg/m2 30.3 ± 4.6*** 22.5 ± 2.6 20.9 ± 1.42 19.4 ± 2.53 21.9 ± 3.28 18.9 ± 2.3 20.6 ± 5.8 * p < 0.05, ** p < 0.01, *** p < 0.001 versus control
BMI: body mass index; BSA: body surface area; DBP: diastolic blood pressure; f: female; m: male; SBP: systolic blood pressure. Table 2 - QT measurements of study group (mean ± SD)
Obese
(n = 38) Basketball(n = 25) Football(n = 31) Swimming(n = 45) Wrestling(n = 23) (n = 16)Tennis (n = 31)Control QT(sec) 0.34 ± 0.02* 0.35 ± 0.02*** 0.35 ± 0.03** 0.34 ± 0.02* 0.35 ± 0.02** 0.31 ± 0.01 0.33 ± 0.02
QTc(sec) 0.39 ± 0.02a 0.38 ± 0.02 0.39 ± 0.02 0.39 ± 0.02 0.39 ± 0.02 0.37 ± 0.02 0.37 ± 0.02
QTd 0.031 ± 0.01a 0.039 ± 0.014aaa 0.038 ± 0.013aaa 0.032 ± 0.012aa 0.028 ± 0.010 0.028 ± 0.012 0.022 ± 0.005
QTcd 0.036 ± 0.014 0.050 ± 0.016 0.050 ± 0.016 0.047 ± 0.017 0.040 ± 0.018 0.044 ± 0.015 0.037 ± 0.049
* p < 0.05, ** p < 0.01, *** p < 0.001 versus tennis
a p < 0.05, aa p < 0.01, aaa p < 0.001 versus control
ARTIGO ORIGINAL QT variables, left ventricular geometry and sports types Left ventricular mass, indexed to height base 2.7,
according to 95th percentile for age and gender and RWT
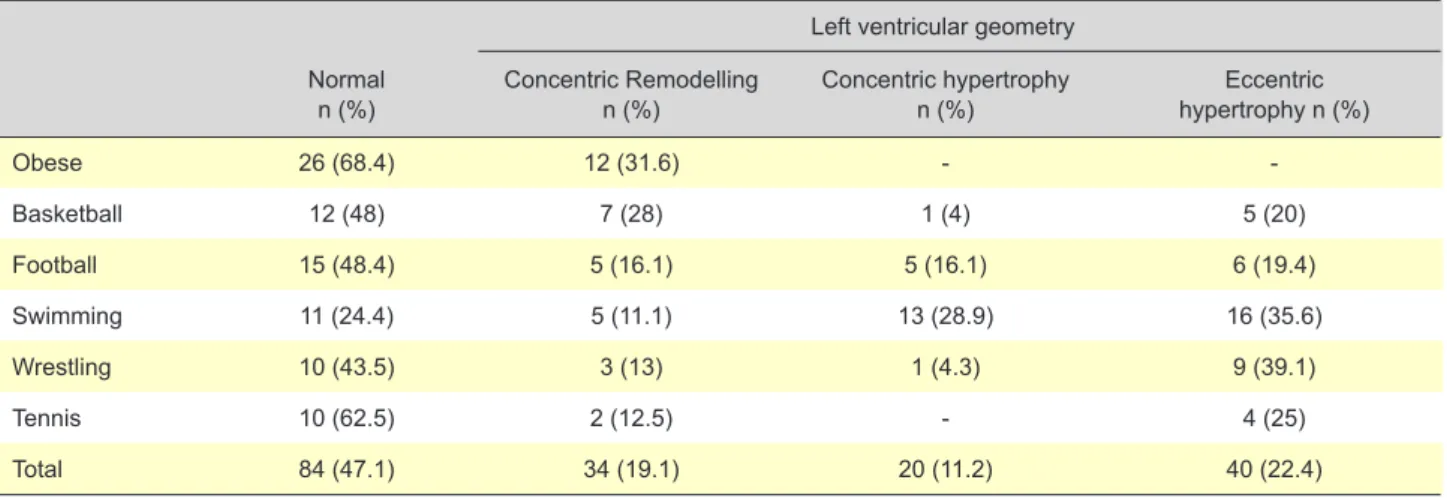
value 0.42, was used to evaluate left ventricular geometry and it was found normal in 84 patients (47.1%), but 34 (19.1%) had concentric remodelling, 20 (22.4%) had concentric hypertrophy and 40 (28.6%) had eccentric hypertrophy. No concentric and eccentric hypertrophy was observed in obese subjects (Table 4).
Left ventricle hypertrophy was prominent in dynamic
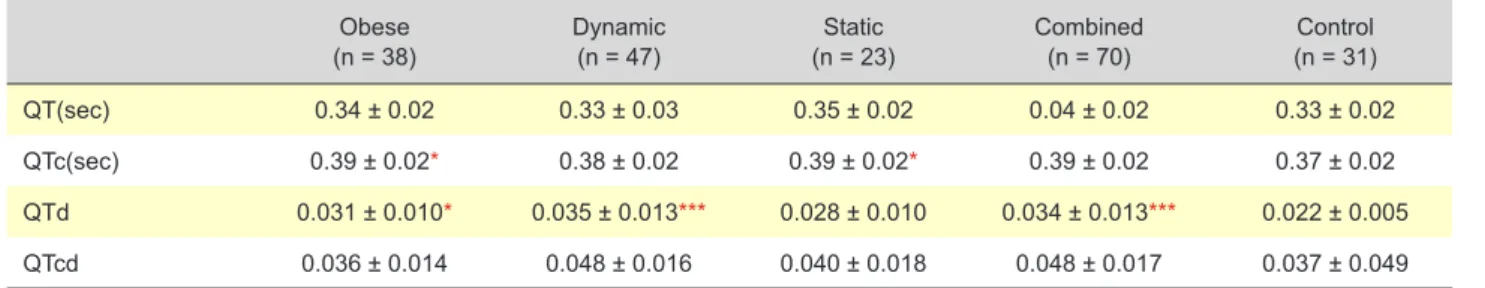
and combined groups but it was not statistically significant (p = 0.204) (Table 5). QTd was statistically higher in obese, dynamic sports and combined sports compared to control group (p < 0.05, p < 0.001 and p < 0.001 respectively) (Table 6).
DISCUSSION
In this study we determined that QTd is elevated in
dynamic and combined sports types and obese children.
Obese subjects are under risk of fatal arrhythmias and Table 3 - M mode echocardiographic measurements of study group (mean ± SD)
Obese
(n = 38) Basketball(n = 25) Football(n = 31) Swimming(n = 45) Wrestling(n = 23) (n = 16)Tennis (n = 31)Control LVDd, mm/m2 25.7 ± 2.9 25.8 ± 2.7 29.2 ± 2.8a 31.61 ± 6.7aaa 30.5 ± 4.02aa 30.9 ± 3.8aa 29.2 ± 5.3 LVDs, mm/m2 16.2 ± 2.2 16.7 ± 2 18.87 ± 2.1aa 19.6 ± 3.5aaa 19.3 ± 2.9aa 19.6 ± 2.4aa 18 ± 3.4 IVSd, mm/m2 5 ± 1 5 ± 7.7 5.8 ± 0.97 6.6 ± 1.2*** 5.6 ± 0.7 5.3 ± 0.9 5 ± 0.9 LPWD.mm/m2 4.8 ± 0.9 5.2 ± 0.6 5.7 ± 1.12** 6.6 ± 1.2*** 5.5 ± 0.8 5.3 ± 1.2 4.9 ± 0.7 EF, % 66.4 ± 5.6 64.6 ± 5.1 64.1 ± 4.3 67.4 ± 6.1 65.2 ± 5.6 66 ± 3.8 65.6 ± 5.4 FS, % 36.3 ± 4.3 35.1± 4.2 35 ± 3.5 37 ± 5.1 35.9 ± 4.8 36.2 ± 2.9 39.5 ± 3.5 LVMI, g/m2 72.6 ± 15.1 86.9 ± 15.1*** 94.9 ± 15.1*** 91.6 ± 16.6*** 94.4 ± 14*** 74 ± 16.7 67.7 ± 13 LVMI, g/m2.7 39.5 ± 9.6*** 34.1 ± 7.2 38.6 ± 6.8*** 39.8 ± 7.1*** 40.9 ± 7.4*** 31.4 ± 8.2 29.9 ± 8.1 * p < 0.05, ** p < 0.01, *** p < 0.001 versus control
a p < 0.05 , aa p < 0.01, aaa p < 0.001 versus obese
EF: ejection fraction: FS: fractional shortening; IVSd: interventricular septum end diastolic diameter; LVDd: left ventricular end diastolic diameter; LVDs: left venticular end systolic diameter; LVMI: left ventricular mass index; LPWD: left ventricular posterior wall thickness.
Table 4 - Left ventricular geometry of the study group
Left ventricular geometry Normal
n (%) Concentric Remodelling n (%) Concentric hypertrophy n (%) hypertrophy n (%)Eccentric
Obese 26 (68.4) 12 (31.6) - -Basketball 12 (48) 7 (28) 1 (4) 5 (20) Football 15 (48.4) 5 (16.1) 5 (16.1) 6 (19.4) Swimming 11 (24.4) 5 (11.1) 13 (28.9) 16 (35.6) Wrestling 10 (43.5) 3 (13) 1 (4.3) 9 (39.1) Tennis 10 (62.5) 2 (12.5) - 4 (25) Total 84 (47.1) 34 (19.1) 20 (11.2) 40 (22.4)
Table 5 - Left ventricular geometry of obese children and different exercise types of athletes Left ventricular geometry Normal
n (%) Remodelling n (%) Concentric hypertrophy n (%) Eccentric hypertrophy n (%) Total n
Obese 26 (68.4) 12 (31.6) - - 38
Dynamic 25 (53.2) 7 (14.9) 5 (10.6) 10 (21.3) 47
Static 10 (43.5) 3 (13) 1 (4.3) 9 (39.1) 23
Combined 23 (32.9) 12 (17.1) 14 (20) 21 (30) 70
ARTIGO ORIGINAL
sudden death even in the absence of clinical symptoms.9-11
Increased heterogeneity of repolarization of the hypertrophied ventricle is the possible mechanism.12,13 The
QTd is used indirectly to determine this ventricular spatial heterogeneity of repolarization.14
There are several studies reporting the increased QTd in obese subjects. Seyfeli et al studied the effect of obesity on P wave dispersion and QTd and concluded that obesity caused significant increase in P wave dispersion and QTd.15 The study of Mshui et al determined that the obese
subjects had a 36% greater QTd than the normal weighted subjects.16 Pidlich et al and Seyfeli et al determined that
substantial weight loss in obese subjects is accompanied by significantly decreased QTcd.17-18 Nigro et al reported
that heterogeneous ventricular repolarization and increased QTd values are present in obese children.19 However
some studies reported no change on QTd in obese children compared to normal weighted subjects.20 Our
results concluded that QTd is increased in obese subjects compared to healthy subjects.
Regular exercise may lead to left ventricular hypertrophy caused by increased volume and pressure overload. Ventricular repolarization becomes heterogeneous which can cause fatal arrhythmias and sudden death as in obese subjects.21 Few studies2 reported the increased QTd in
athletes but some of the which claim the opposite.3-5,22 So
the effect of sports in QTd is controversial. In our study the athletes had the highest left ventricular enddiastolic diameter, left ventricular endsystolic diameter, interventricular septal thickness at diastole and left ventricular posterior wall thickness at diastole parameters compared to healthy subjects. Although QT, QTc interval and QTcd were similar in all groups, QTd was higher in basketballers, footballers and swimmers compared to normal subjects.
In our study we determined that athletes who participate in dynamic and combined sports had increased QTd compared to static sports. This finding was incompatible with literature.23-24 This result may be due to any training
completed prior to the main activities of that sport
(combination of isometric and isotonic exercise modalities in training prior to main sports type) , as suggested by Osborn et al.25
Additionally, we could not find a correlation between QTc and BMI. This result was in accordance with other studies.15,26 The functional and structural changes
in heart, hyperinsulinemia, glucose intolerance, and autonomic dysfunction may also effect the QTc interval in obese subjects. Even in the absence of any apparent complications, obesity may be accompanied by minimal asymptomatic myocardial dysfunction.6
CONCLUSION
In conclusion, QTd is prolonged in obese and athletes who participate dynamic and combined sports. So we suggest that long term follow-up with electrocardiographic evaluation is necessary in athletes and obese children to detect arrhythmic complications. The relatively unexpected QT dispersion results involving young people while practicing widely desired sports, must be known.
FUNDING SOURCE
No external funding was secured for this study. The authors have no financial relationships relevant to this article to disclose.
CONFLICT OF INTEREST
The authors have no conflicts of interest to disclose.
PROTECTION OF HUMANS AND ANIMALS
The authors declare that the procedures were followed according to the regulations established by the Clinical Research and Ethics Committee and to the Helsinki Declaration of the World Medical Association.
DATA CONFIDENTIALITY
The authors declare having followed the protocols in use at their working center regarding patient’s data publication. Table 6 - QT measurements of obese group and sports type (mean ± SD)
Obese
(n = 38) Dynamic(n = 47) (n = 23)Static Combined(n = 70) (n = 31)Control
QT(sec) 0.34 ± 0.02 0.33 ± 0.03 0.35 ± 0.02 0.04 ± 0.02 0.33 ± 0.02
QTc(sec) 0.39 ± 0.02* 0.38 ± 0.02 0.39 ± 0.02* 0.39 ± 0.02 0.37 ± 0.02
QTd 0.031 ± 0.010* 0.035 ± 0.013*** 0.028 ± 0.010 0.034 ± 0.013*** 0.022 ± 0.005
QTcd 0.036 ± 0.014 0.048 ± 0.016 0.040 ± 0.018 0.048 ± 0.017 0.037 ± 0.049
* p < 0.05, ** p < 0.01, *** p < 0.001 versus control
QTc: corrected QT; QTcd: corrected QT dispersion; QTd: QT dispersion; sec: seconds.
REFERENCES
1. Goldberg RJ, Bengtson J, Chen ZY, Anderson KM, Locati E, Levy D. Duration of the QT interval and total and cardiovascular mortality in healthy persons (The Framingham Heart Study experience). Am J Cardiol. 1991;67:55-8.
2. McCann GP, Munir DF, Hillis WS. Athletic left ventricular hypertrophy: long-term studies are required. Eur Heart J. 2000;21:351–3.
3. Halle M, Huonker M, Hohnloser SH, Alivertis M, Berg A, Keul J. QT dispersion in exercise-induced myocardial hypertrophy. Am Heart J. 1999;138:309–12.
4. Stolt A, Karila T, Viitasalo M, Mäntysaari M, Kujala UM, Karjalainen J. QT interval and QT dispersion in endurance athletes and in power athletes using large doses of anabolic steroids. Am J Cardiol. 1999;84:364–6.
ARTIGO ORIGINAL
5. Mayet J, Kanagaratnam P, Shahi M, Senior R, Doherty M, Poulter NR, et al. QT dispersion in athletic left ventricular hypertrophy. Am Heart J. 1999;137:678–81.
6. Lang RM, Bierig M, Devereux RB, Flachskampf FA, Foster E, Pellikka PA, et al. American Society of Echocardiography’s Guidelines and Standards Committee; European Association of Echocardiography recommendations for chamber quantification: a report from the American Society of Echocardiography’s Guidelines and Standards Committee and the Chamber Quantification Writing Group, developed in conjunction with the European Association of Echocardiography, a branch of the European Society of Cardiology. J Am Soc Echocardiogr. 2005;18:1440-63.
7. Devereux RB, Reichek N. Echocardiographic determination of left ventricular mass in man. Anatomic validation of the method. Circulation. 1977;55:613-8.
8. Khoury PR, Mitsnefes M, Daniels SR, Kimball TR. Age-specific reference intervals for indexed left ventricular mass in children. J Am Soc Echocardiogr. 2009;22:709-14.
9. Kannel WB, Plehn JF, Cupples LA. Cardiac failure and sudden death in the Framingham Study. Am Heart J. 1998;115:869 –75.
10. Messerli FH, Nunez BD, Vantura HO, Snyder DW. Overweight and sudden death: increased ventricular ectopy in cardiopathy of obesity. Arch Intern Med. 1987;147:1725– 8.
11. Frank S, Colliver JA, Frank A. Electrocardiogram in obesity: statistical analysis of 1,029 patients. J Am Coll Cardiol. 1986;7:295–9.
12. Algra A, Tijssen JG, Roelandt JR, Pool J, Lubsen J. QTc prolongation measured by standard 12-lead lectrocardiography is an independent risk factor for sudden death due to cardiac arrest. Circulation. 1991;83:1888-94.
13. Schouten EG, Dekker JM, Meppelink P, Kok FJ, Vandenbroucke JP, Pool J. QT interval prolongation predicts cardiovascular mortality in a apparently healthy population. Circulation. 1991;84:1516-23.
14. Zabel M, Portnoy S, Franz MR. Electrocardiographic indexes of dispersion of ventricular repolarization: an isolated heart validation study. J Am Coll Cardiol. 1995;25:746-52.
15. Seyfeli E, Duru M, Kuvandik G, Kaya H, Yalcin F. Effect of obesity on P-wave dispersion and QT dispersion in women. Int J Obes. 2006;30:957-61.
16. Mshui ME, Saikawa T, Ito K, Hara M, Sakata T. QT interval and QT dispersion before and after diet therapy in patients with simple obesity. Proc Soc Exp Biol Med. 1999;220:133– 8.
17. Pidlich J, Pfeffel F, Zwiauer K, Schneider B, Schmidinger H. The effect of weight reduction on the surface electrocardiogram: a prospective trial in obese children and adolescents. Int J Obes Relat Metab Disord. 1997;21:1018-23.
18. Seyfeli E, Duru M, Kuvandik G, Kaya H, Yalcin F. Effect of weight loss on QTc dispersion in obese subjects. Anadolu Kardiyol Derg. 2006;6:126-9. 19. Nigro G, Russo V, Di Salvo G, De Crescenzo I, Rago A, Perrone L,
et al. Increased heterogenity of ventricular repolarization in obese nonhypertensive children. Pacing Clin Electrophysiol. 2010;33:1533-9. 20. Akyüz A, Alpsoy S, Akkoyun DC, Nalbantoğlu B, Tülübaş F, Karasu E,
et al. Effect of overweight on P-wave and QT dispersions in childhood. Turk Kardiyol Dern Ars. 2013;41:515-21.
21. Haider AW, Larson MG, Benjamin EJ, Levy D. Increased left ventricular mass and hypertrophy are associated with increased risk for sudden death. J Am Coll Cardiol. 1998;32:1454-9.
22. Akalın A, Topçu B, Odabaş İ, Çotuk B, Mengütay S. QT dispersion in young athletes. Turk Arch Ped. 2007;42:117-20.
23. Mitchell JH, Haskell W, Snell P, Van Camp SP. Task Force 8: classification of sports. J Am Coll Cardiol. 2005;45:1364-7.
24. Omiya K, Sekizuka H, Kida K, Suzuki K, Akashi YJ, Ohba H, et al. Influence of gender and types of sports training on QT variables in young elite athletes. Eur J Sport Sci. 2014;14:S32-8.
25. Osborn RQ, Taylor WC, Oken K, Luzano M, Heckman M, Fletcher G. Echocardiographic characterisation of left ventricular geometry of professional male tennis players. Br J Sports Med. 2007;41:789-92. 26. Başkan M, Koçak G, Gürses D. Çocuklarda obezite ve venrikül
repolarizasyonu arasïndaki ilişki. Türk Kardiyol Dern Arş. 2001;29:47-52.