M
ASTER OF
S
CIENCE IN
FINANCE
M
ASTERS
F
INAL
W
ORK
PROJECT
EQUITY RESEARCH
:
R
YANAIR
H
OLDING
P
LC
J
OÃO
R
UI
C
ORREIA
S
ANTANA
R
ITA
M
ASTER OF
S
CIENCE IN
FINANCE
M
ASTERS
F
INAL
W
ORK
PROJECT
EQUITY RESEARCH
:
R
YANAIR
H
OLDING
P
LC
J
OÃO
R
UI
C
ORREIA
S
ANTANA
R
ITA
SUPERVISOR:
P
ROFESSOR
J
ORGE
B
ARROS
L
UÍS
i
Abstract
As part of the Master’s Final Work in Finance, and according to the recommendations of the CFA Institute, this project about Ryanair Holdings PLC (RYA), which integrates the scrupulous analysis of all its business activity, has been settled with the main purpose of knowing the intrinsic value of its shares, on the 31st December, 2020. The decision to develop this project considers its leading position in European low-cost commercial aviation sector and the successful implementation of its pioneering business strategy. Given my own personal interest for the Company and also for the industry, it was the recent controversies associated to RYA (taxation, labour crisis and financial health) that moved me to proceed with this work.
The organic structure of this project is divided into two distinct parts. The first part where RYA is analysed and also the industry in which the Company operates; the second part, in which, the information in the first part is considered and it is forecasted and measured the Company's growth, over the next few years, using valuation models as Discounted Cash Flows (DCF), Adjusted Present Value (absolute methods) and the Multiples Approach (relative method). It should be mentioned that all of the developments of this project include information until 27th
September, 2019.
With a target price of € 10.95 at the end of 2020, given the DCF Model, representing an upside potential of 6.37% over the price of € 10.29, on 27th September 2019, our investment recommendation is HOLD, that is no strong reasons for buying or selling. Considering the main features of Adjusted Present Value Model, an identical result was reached that supports the same investment recommendation. With a target price of € 11.10, which adds up to a 7.90% upside potential, the advice of HOLD is well-maintained. The combination of this analysis with the reality of RYA and the industry, it is assumed that HOLD is indeed the most reasonable recommendation, regarding the cyclical uncertainty in the sector, due to the doubt about future fuel prices, the political deadlock with Brexit agreement, the issues with the new Boeing MAX models and the high competition that has weakened some airlines. All these factors result in a medium-level investment risk for RYA.
Keywords: Ryanair Holdings PLC; Equity Research; Airlines Industry; Airlines Group; Low-Cost Carriers; Acquisitions; Discounted Cash Flow; Adjusted Present Value; Multiples Approach.
Resumo
No âmbito do trabalho final de Mestrado em Finanças, do ISEG, e de acordo com as recomendações do CFA Institute, foi elaborado este estudo sobre a Ryanair Holdings PLC (RYA) que integra a avaliação minuciosa de toda a sua atividade, com o objetivo final de se perspetivar o valor intrínseco das suas ações a 31 de Dezembro de 2020. A decisão de se desenvolver este projeto sobre a RYA surge no seguimento da posição de líder que esta empresa ocupa no atual sector europeu de aviação comercial de baixo custo, aliada à implementação da sua estratégia de negócio pioneira e de elevado sucesso. Decorrente ainda de um interesse pessoal, não só pela empresa como pela indústria, foram também as recentes polémicas associadas à RYA (a nível fiscal, laboral e financeiro) que também direcionaram este trabalho.
A estrutura orgânica do presente documento é dividida em duas partes distintas: uma primeira parte, onde se analisa e se apresenta a RYA e a indústria onde se insere e uma segunda parte, onde, considerando as informações da primeira parte, se projeta e se mensura o desenvolvimento da empresa nos próximos anos, recorrendo a modelos de avaliação como o dos Fluxos de Caixa Atualizados e o Valor Atual Ajustado (métodos absolutos) e ainda ao modelo dos Múltiplos comparáveis (método relativo).
Importa frisar que todo o conteúdo deste projeto contempla informações passíveis de análise até dia 27 de Setembro de 2019.
Com um preço-alvo de € 10,95, no final de 2020, calculado através do modelo dos Fluxos de Caixa Atualizados, representando um potencial de valorização de 6,37% considerando o preço de € 10,29, a 27 de Setembro de 2019, a nossa recomendação de investimento é MANTER, ou seja, não se considera a existência de razões fortes para a compra, nem de razões negativas para a venda. Seguindo as especificações do modelo de Valor Atual Ajustado, alcança-se um resultado idêntico que sustenta a mesma recomendação. Com um preço-alvo de € 11,10, o que totaliza um potencial de valorização de 7,90%, o conselho de MANTER, preserva-se. Aliando este parecer à realidade da RYA e da indústria, admite-se que MANTER é, de facto, o mais sensato, considerando a incerteza que paira no setor, devido à dubiedade dos preços dos combustíveis, aos impasses na saída do Reino Unido da União Europeia, às questões com os novos modelos Boeing MAX e ainda a elevada concorrência que tem levado algumas companhias aéreas à falência. Todos estes fatores acabam por se traduzir num risco de investimento de nível médio para a RYA.
Palavras-chave: Ryanair Holdings PLC; Equity Research; Indústria de Companhias Aéreas; Grupos de Companhias Aéreas; Carreiras de Baixo Custo; Aquisições; Fluxos de Caixa Descontados; Valor Atual Ajustado; Modelo dos Múltiplos.
iii
Acknowledgements
Even that the acknowledgements are usually done towards the end, when they are presented almost as an introduction to these projects, they bring a more genuine and human meaning to certain goals that are purely personal. In fact, not having to complete any literature review or theoretical concepts, gives to this space the opportunity to look at experiences, people and values that make us reach at this stage of our lives with ¼ century lived.
So, firstly, it is important to thank, at an institutional level, the ISEG that already has followed me through 3 academic formations: the graduation, the postgraduate degree and, currently, the master's degree. It is also important to recognize the influence that Herdade Grande had at this stage of my academic career, where I developed, among vineyards, olive groves and interesting people, almost all of this project, while gained knowledge about the science of oenology and viticulture. Also, I would like to thank McDonald’s for feeding me lately, saving me more time to dedicate myself to this final project.
Not only as a mentor and supervisor of this work, but also as a Professor, a special word of appreciation and thanks to Professor Jorge Barros Luís for all the help, technical contribution and the whole consideration, even with my delay in the beginning of this project. I appreciate the way that Professor accompanied me these months and how valued me as a student. A special thanks to Professor Lúcia Kubrusly, who led and carried me at the Institute of Economics of Rio de Janeiro and also to Professors and friends Paulo Martins and Paula Cosme who always made me see that being a teacher was much more than teaching a curricular plan of a specific subject, because, before anything else, as experienced and rational human beings, we have a social commitment to improve ourselves day after day.
Friends like Rita Neves, Sérgio Crispim and Filipa Valente also deserve all the additional consideration for making 200% of their time available, even though they had all their personal and professional responsibilities, to help and support me during my academic career. Without close friends like Tiago Correia, Sahib Santiago, Eddie Fernandes, António Reis and Vasco Oliveira, such goals would not be possible either. Thanks also to my friend Bernardo Gordo for destabilizing me during these recent times, thus forcing me to overcome and deal with the pressure and stress in this project.
Special thanks to David Cardoso and Catarina Ribeiro for being my greatest support since I can remember. Siblings from different mothers, the family I chose!
Thank my grandparents, and especially my Aunt Zeza and Aunt Catarina, for being a constant presence in my life and key people in the final outcome of this project. To my father, Rui Rita, for relieving all the academic pressure with our sports schedule, saying several times “Let’s go boy, that's why I never went to university”. And finally, to my Mother, Paula Correia, the human being that I preserve the most, who supports me and helps me in everything, whether my decisions are good or bad.
Last but not least, an endless and huge thank to my life partner Marta, my sister Rita Rita and our puppy Ozzy for sharing with me 24/7 of this reality and representing everything I value the most in my life: character, loyalty, friendship, love and companionship.
To my Uncle João Correia, my Aunt Alexandra Amaral and my younger cousins Maria and Manel, thank you so much for existing and making me what I am today! It is not by chance that all of you finish this chapter. I really appreciate you and what you are to me!
Index
Abstract
i
Resumo
ii
Acknowledgements
iii
Index
iv
List of Figures
v
List of Tables
vi
1.
RESEARCH SNAPSHOT
1
2.
BUSINESS DESCRIPTION
2
3.
MANAGEMENT AND CORPORATE GOVERNANCE
6
4.
INDUSTRY OVERVIEW AND COMPETITIVE POSITIONING
7
5.
INVESTMENT SUMMARY
15
6.
VALUATION
19
7.
FINANCIAL ANALYSIS
27
8.
INVESTMENT RISKS
30
Appendices
34
Appendix 1: Income Statement 34
Appendix 2: Balance Sheet 36
Appendix 3: Cash Flow Statement 38
Appendix 4: Key Financial Ratios 40
Appendix 5: Common-Size Income Statement 41
Appendix 6: Common-Size Balance Sheet 43
Appendix 7: Forecast Assumptions 45
Appendix 8: DCF Model – FCFF Computations 51
Appendix 9: APV Method Computations 53
Appendix 10: Relative Valuation – Multiples Computations 54
Appendix 11: DuPont Analysis (Key Financial Ratios Support) 57
Appendix 12: Sensitivity Analysis 59
References
61
v
List of Figures
Figure 1- RYA activity estimations. Source: RYAAR and Author.
1
Figure 2- Total Passengers Carried and Average Passenger Fare. Source: RYA
Annual Report (RYAAR).
2
Figure 3- Revenue per County. Source: RYAAR.
2
Figure 4 – Operating Profit and Margin. Source: RYAAR.
3
Figure 5 – Total Operating Revenues and Expenses. Source: RYAAR.
3
Figure 6 – Categories of Operating Expenses, as % of Total Operating Expenses.
Source: RYAAR.
3
Figure 7 – Total Scheduled and Ancillary Revenues, as % of Total Operating
Revenues. Source: RYAAR and Bloomberg.
3
Figure 8 – Ryanair’s RPK, ASK and Load Factor measures. Source: RYAAR.
4
Figure 9 – Real GDP Growth. Source: IMF.
7
Figure 10 - Interest Rates in Euro Area, % per annum. Source: OECD.
9
Figure 11 – Fuel and Oil Prices. Source: IATA.
9
Figure 12 – Air Transportation Market Share. Source: Statista.
11
Figure 13 – Total Passengers Carried. Source: Statista.
11
Figure 14 – Estimated Annual Growths Rates for Passenger Air Traffic from 2019 to
2038. Source: Statista.
11
Figure 15 – Worldwide Passenger Revenue, Operating Profit and Annual Growth in
Traffic Passenger. Source: IATA and Statista.
12
Figure 16 – Leading Airlines based on number of Passengers in Million. Source:
Statista.
12
Figure 17 – Porter’s 5 Forces Model. Source: Author
15
Figure 18 - Forecasted Operating Revenues and Expenses. Source: RYAAR and
Author.
20
Figure 19 - Forecasted Number of Passengers Carried and Average Fare. Source:
RYAAR and Author.
20
Figure 20 - Forecasted Revenues: Scheduled and Ancillary Segment. Source:
RYAAR and Author.
20
Figure 21 - Forecasted Operating Expenses and the Total Fleet. Source: RYAAR and
Author.
21
List of Tables
Table 1 - Analyst Risk Assessment
1
Table 2 - Valuation Output. Source: Author
1
Table 3- Description of RYA Operating Expenses. Source: RYAAR.
3
Table 4-Major Shareholders. Source: RYAAR.
5
Table 5 - Yearly average exchange rate against €.Source: OFX.
8
Table 6 - Data of Worldwide Airline Industry. Source: IATA.
10
Table 7 - Ranking of countries with biggest passenger traffic. Source: IATA.
11
Table 8 - Peers Group comparison. Source: Annual Reports from each Peer.
12
Table 9 - SWOT Analysis. Source: Author.
14
Table 10 - Valuation Summary. Source: Author.
16
Table 11 - Valuation Assumptions. Source: Author.
24
Table 12 -DCF/FCFF Output. Source: Author.
24
Table 13 - APV Output. Source: Author.
25
Table 14 - Multiples Output. Source: Author.
26
Table 15 - Sensitivity Analysis. Source: Author.
27
1
RYA: Leading Low-Cost Segment in Europe.
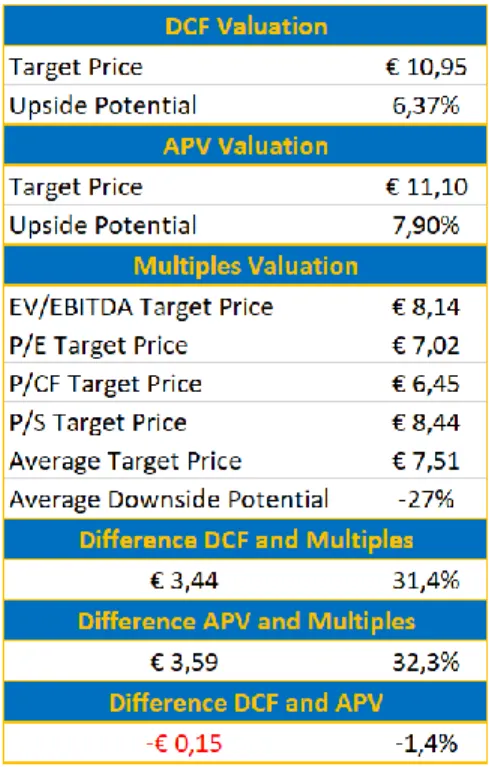
(YE2020 Price Target of € 10.95 (6,37%); recommendation is to HOLD)The final recommendation for Ryanair Holdings PLC (RYA) is HOLD, considering Discounted Cash Flow (DCF) method as the main model of valuation and based on the target price achieved, at the end of 2020, of € 10,95, meaning an upside potential of 6,37%, regarding the price of € 10,29 in 27th September, 2019. This recommendation is also supported by Adjusted
Present Value (APV) method, with a target price of € 11,10, offering an upside potential of 7,90%. On the other hand, relative valuation throughout Multiples Approach gives us a downside potential of 27% with an average target price of € 7,5; however, as will be explained further, this valuation is biased given the weaknesses that aviation industry is facing along 2019 and it is expected to remain in 2020 (Table 2).2
The risk assessment for RYA investment is stablished as medium risk (Table 1) due to the factors: (i) the huge competition in the sector which has settled down operating margins and averages fares, sinking many airlines in overcapacity; (ii) the constant gaining of market share of low cost carriers (LCC) segment against full service carriers (FCS) and RYA is one of the biggest worldwide low cost airlines, leading the LCC market in Europe; (iii) the personnel strikes and the delay in delivery of new Boeing MAX, which still affect negatively how RYA brand is seen in the market, considering the flights cancellations, the closure of some routes and bases as well as the dismissals of the staff; (iv) the fact that operating expenses are growing upwards and quickly than revenues, leading to the decreasing of EBIT margins (Figure 1); (v) the Brexit agreement that seems to be non-consensual between UK and Europe, carrying along uncertainty issues that affect aviation’s industry and (vi) the RYA strategy of becoming a group airlines, after acquired Laudamotion, Air Malta and settled subsidiaries as Ryanair Sun (rebranded as ‘’Buzz’’) and Ryanair UK.
Basically, in the following two years, RYA will face uncommon levels of profitability with the final purpose of driving out its rivals and gaining extra and important market share to still outperform over its competitors and leverage its growth in the long-term that will be focused in (i) carrying a record of 200M passengers in FY2024; (ii) increasing its Load Factor; (iii) valuing even more its customers experience; (iv) stablishing new routes and increasing the frequency of service on its existing routes; (v) renewing its fleet with 210 Boeing 737-MAX that will provide high passenger capacity and lower levels of fuel consumption and (vi) taking advantage of internet to boost its ancillary revenues, while still preserving its records of safety, punctuality and quality. 1. RESEARCH SNAPSHOT
Ryanair
Holding PLC
HOLD
Medium risk
27TH September 2019Portugal
Table 1 - Analyst Risk AssessmentTable 2 - Valuation Output. Source: Author
Figure 1- RYA activity estimations. Source: RYAAR and Author.
Table 1 – Analyst Risk Assessment.
Table 2 – Valuation Output. Source: Author
Ryanair Holdings PLC (RYA), founded in 1985 and based in Swords (Dublin, Ireland), is an airline which operates as a LCC (low-cost carrier). With the slogan ‘’Low Fare, Made Simple’’ and with a well-established main mission focused in offering low fares to increase its passenger traffic in combination with cost containment and operating efficiency, RYA is often recognized as ‘’Europe’s largest airline group’’, ‘’Europe’s No. 1 on-time performance’’ and ‘’Europe’s No. 1 Low-cost airline’’. In fact, when the purpose is to support these statements, the Irish airline with 86 bases around Europe comes up with impressive numbers. RYA, in FY2019 (between 1st April 2018 and 31st
March 2019), operated 2,400 short-haul flights per day over 224 airports in 38 countries with a total of 142m carried passengers that paid an average fare of €37,03 (Figure 2) on a fleet composed by 455 Boeing 737-800 and another 210 on order. Another strong factor of the company is the 16,800 highly skilled aviation professionals who strive to deliver the lowest fares, the best punctuality performance, the greenest and cleanest air travel and hold an industry leading 34-year safety record.
The beginning of RYA goes back in 1985 when Ryan family set up the company with a share capital of £1 and a staff of 25 people. In the first year, RYA operated daily flights from Waterford (Ireland) to London Gatwick and carried a total of 5,000 passengers. Ten years later, RYA achieved the goal of carrying more than 1 million passengers in a year. Nowadays, after becoming in 2017 the first European airline to carry over 1 billion passengers, RYA is still spreading its growth through some acquisitions as Malta Air (Malta) and Laudamotion (Austria), and through the creation of Ryanair Sun (actually, rebranded Buzz), based in Warsaw (Poland) and Ryanair UK which is the subsidiary in UK, based in London Stansted airport. With the final mission of enhancing the customers experience, the AGB 2019 (Always Getting Better Program) introduced new initiatives to keep the lowest fares (get money back to passengers who are able to find a cheaper fare within 3 hours), to improve punctuality (if the on-time performance measure is under 90%, RYA cut 5% off the following month’s air fares and to develop customer care improvements as well (48 hours for changes of bookings and compromising to process claims within 10 days along with 24/7 customers support).
Due to its aim of being the greenest airline, RYA established an environmental plan, included in its Environmental and Social Policies, in order to minimise fuel and energy consumption, reduce noise pollution and CO2 emissions and going plastic free within 5 years. Preserve and increase a strong load factor, invest in fuel-efficient new aircraft, improve engine technology and conduct the most efficient operational procedures in the industry will be the keys to the success of its plan.
RYA ACTUALITY
On the other hand, RYA’s has recently been stormed by some critical events as Brexit, delays in delivery of new Boeing 737 Max and personnel strikes. All the worries on the Brexit agreement are justified by the fact that, in FY2019, 22% of revenues came from operations in UK, as can be seen in Figure 3. So, uncertain and undefined aspects as the status of the UK/EU
2. BUSINESS DESCRIPTION
Figure 2- Total Passengers Carried and Average Passenger Fare. Source: RYA Annual Report (RYAAR).
3
open air transport market and freedom of people’s movement can affect negatively RYA’s financial condition and results of operations. However, the creation of Ryanair UK as UK’s subsidiary can be used to minimize these adverse situations.
The retardment with new Boeing models delivery ends up delaying the achievement of some strategic strengths to RYA, because the 737 MAX has 4% more seats and consumes 16% less of fuel. Despite these features, the truth behind this delay is worrisome, because the aircraft models have been involved in two accidents in Ethiopia and in Indonesia and are being rectified, so the plan will be delivering 30 of these aircrafts until the summer 2020.
The last critical issue that is affecting RYA business is the labour crisis with many personnel strikes (pilots and cabin crew) in last few months. RYA personnel claims higher salaries plus better work conditions and starts to unionize and join competitors. These strikes cause a drop in credibility of RYA due to the cancellation of flights and force the increase of costs with passenger’s compensations.
RYA OPERATING PERFORMANCE IN FY2019
Besides all of these considerations, in FY2019, RYA faced a reduction in its operating margin for values close to those presented in FY2015. It decreased by 39% from 1,667.3m in FY2018 to 1,016.8 in FY2019 (Figure 4). This result is supported by the fact that the total operating revenues increased just by 8%, between FY2018 and FY2019, while the total operating expenses increased by 22%, in the same time period (Figure 5). The bad performance in operating profit allied with the delay in delivery of the Boeing MAX will lead to close bases, during the FY2020.
The huge increase in operating expenses between FY2018 and FY2019, as can be seen through Table 3, was mainly originated by the increase of costs with fuel and oil (28% due to the direct cost of fuel), with airports and handling (13% due to the increase in passenger numbers) and with staff costs (33% due to increase in block hours and pilot and cabin crew pay increases), when each of these parcels weighs 36%, 16% and 15%, respectively, in the total amount of operating expenses (Figure 6).
When taking into account the operating revenues, we are able to check that RYA’s has two types of core revenues: scheduled revenues and ancillary revenues, both of them related to low-fares airline activities (the only business segment of the Company).
Scheduled revenues are a function of the total passengers carried per year and the average fare charged by RYA. It increased by 2% from €5,134.0m, in FY2018, to €5,261.1m, in FY2019, which reflects the 9% increase in the number of booked passengers offset by the 6% decrease in average fare from €39.40 to €37.03, in the same period. In FY2019, scheduled revenues represents 68% of total operating revenues (Figure 7).
To complement, ancillary revenues comprise revenues from non-flight scheduled operations (excess baggage charges, administration/credit cards fees, priority boarding, allocated seats, room reservation, travel
Figure 4 – Operating Profit and Margin. Source: RYAAR.
Figure 5 – Total Operating Revenues and Expenses. Source: RYAAR.
Table 3- Description of RYA Operating Expenses. Source: RYAAR.
Figure 6 – Categories of Operating Expenses, as % of Total Operating Expenses. Source: RYAAR.
Figure 7 – Total Scheduled and Ancillary Revenues, as % of Total Operating Revenues. Source: RYAAR and Bloomberg.
Figure 3. Source: RYAAR.
Figure 4. Source: RYAAR.
Table 1 – Description of RYA’s Operating Expenses. Source: RYAAR.
Figure 5. Source: RYAAR.
insurance and car hire), from in-flight sales (food and beverage and merchandise) and internet-related services (commissions received from sales in the Company’s website and other linked websites). It increased by 21% from €2,017.0m, in FY2018, to €2,436.3m, in FY2019. The overall increase in ancillary segment was stimulated by an increase in the sales of reserved seating and priority boarding.
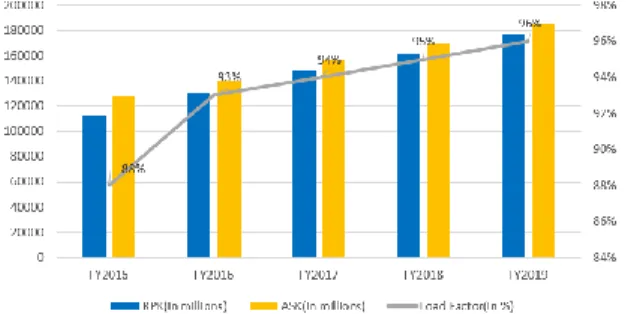
Through this analysis, we can assume that what determined these operating results were the key drivers of revenue and profitability as the low cost fares, the high price of non-ticket services (ancillary segment), the operating cost containment and the RYA punctuality and safety records in airlines industry. Therefore, RYA exhibit interesting airline industry metrics (Figure 8) as RPK (which measures the demand for an air transportation, often referred as airline traffic, comprising the sum of the product between the revenue passengers and the distance flown of each flight), ASK (a supply metric of an air transportation which measures available seats per kilometres, so it is a indicative of capacity) and Load Factor (which measures how much of an airline passenger carrying is used and it comprises the division of RPK by the ASK). In FY2019, RYA’s achieved an impressive Load Factor of 96%, which means that in every flight 96% of the aircraft was full with revenue passengers (Figure 8). It should be noted that for RYA a boost in RPK is good because it means that more passengers are using their services and an increase in ASK is also positive because there’s a company’s commitment to rise its capacity demand year by year. On the other hand, the maximization of the load factor reflects an important operating efficiency but needs to match with good pricing and profitability policies.
RYA LONG-TERM STRATEGY
The main purpose of the Company is to establish itself in Europe’s airlines market as the biggest scheduled passenger airline group implementing constants improvements and expanded offer of its low-fares service to an increasing number of passengers, year after year. To achieve this, RYA outlined the following key elements of its long-term strategy:
i. Low fares to stimulate demand from every target of the air travelers. RYA sells tickets without minimum stay requirements (called the ‘’one-way basis’’), imposing higher fares to flights with high demand and to reservations made nearer to the departure’s date and, occasionally, running special promotional fare campaigns.
ii. Customer service is a priority to the Company. In fact, RYA strives to deliver the best services and performances among its competitors. This focus on customers experience is perceivable through the 90% of punctuality and the handling’s efforts to provide fewer lost bags than its competitors. In recent years, AGB introduced initiatives as a more intuitive navigation in the website, a mobile app, reduced penalty fees and more customer-friendly baggage allowances and change flight policies. All of these RYA efforts are reflected in the increasing of RPK and PLF.
iii. Frequent point-to-point flights on short-haul routes that allows to offer low fares, frequent services and direct and non-stop routes, avoiding costs for connecting passengers (as baggage transfer and
Figure 8 – Ryanair’s RPK, ASK and Load Factor measures. Source: RYAAR.
5
transit passenger assistance). In FY2019, the average route length was 774miles/1245.6km with the average duration of 1.9 hours.
iv. Low operating costs that is one of the key drivers of its business. Due to this, RYA needs to control and reduce its main expenses as aircraft equipment and finance costs (operating with a single type of aircraft – Boeing 737-800 – limits costs with personnel training, maintenance and the purchase and storage of spare parts); personnel costs (through compensation’s payment productivity-based as bonus for on-board for cabin crew and payments productivity-based on the number of hours or sectors flown by pilots and cabin crew); customer service costs (negotiating the costs directly with the airports and eliminating travel agent commissions through the development of its own internet system booking) and airport access and handling costs (choosing airports with most competitive prices and less issues with slot requirements and operating restrictions).
v. Taking advantage of the internet globalization providing
developments in its website and app, with the final purpose of simplifying the booking of flights and the purchasing of ancillary products.
vi. Commitment to safety and quality maintenance by hiring and training of the pilots, flight attendants and maintenance personnel while stipulates a policy of maintaining its aircrafts in accordance with the highest industry standards.
vii. Enhancement of operating results through ancillary services by having contracts with service providers of accommodation, airport transfer, car hire and travel insurance.
viii. Focused criteria for growth by using aggressive fare promotions to stimulate demand, increasing the frequency of service on its existing routes, initiating new and additional routes in the EU and within EU countries, continuing exploring acquisitions opportunities, connecting airports on its existing route network and initiating new routes not currently served by any carrier
ix. Responding to market challenges as balance low-fare business with volatility of fuel costs and economic contraction in some economies in which RYA operates. To face these challenges, the Company will ground around 65 aircrafts during the winter, will dispose aircraft and it will still to improve its costs containment strategies as the renegotiation of contracts with existing suppliers and airports and handling operators. During the winter, RYA will carry out its aircraft maintenance and, as was said, will stop many of its aircrafts to avoid extra cost due to higher fuel prices and higher airport charges while a seasonal decrease in operating costs and revenues is expected.
SHAREHOLDERS STRUCTURE
As it can be seen in Table 4, in the end of FY2019, the type of principal agents that hold the main participation in RYA share capital is investment advisory, while the Directors of RYA as a group owned 53,057,387 ordinary shares which represents 4.7% of RYA outstanding ordinary shares. For being considered major shareholder, it is required to hold at least 3% of total issued share capital. This status gives these shareholders the right to put a discussion topic in the AGM or present a resolution project for a
discussion item. On the other hand, a shareholder that detains at least 5% can request an extraordinary meeting.
Another important detail to retain, it is the fact that Directors of RYA demonstrate a special care to certify that the number of ordinary shares held by non-EU nationals does not reach a level which could put in danger the RYA to continue to hold or enjoy the benefit of any European air operator certifications. It needs to be considered because EU Regulation requires that an EU air carrier must be majority-owned and effectively controlled by EU nationals to obtain and retain an operating licence.
According to Governance Metrics Report of MSCI Research, RYA achieved the highest score relative to main competitors indicating that its corporate governance practices are usually well aligned with shareholder interests.
RYA corporate governance is developed inside the Board of Directors which is responsible for the leadership and the strategic direction of the Group. The main focus of the Board is on strategy formulation, policy and control but covers others matters as treasury policy, audit and risk management, approval of the annual budget, key strategic decisions, internal control and remuneration of the Non-Executive Directors and Executive management.
The Board is headed by the same Chairman since 1996, David Bonderman, whose primary responsibilities are to ensure that the Board has a common purpose, is effective and, at individual Director Level, upholds and promote high criteria of integrity and corporate governance. The Chairman links the Board and the Company ensuring appropriate communications with shareholders.
As Deputy Chairman, the Board elected Stan McCarthy who has served the Company as Director from 2017.
Kyran McLaughlin is the Senior Independent Director who has the mission to keep in touch with shareholders about matters that cannot be addressed through the Chairman, Group CEO or CFO.
One of the biggest changes in the Board was the renunciation of Michael O’Leary as CEO, in August of 2019, who has been in RYA for more than 30 years. According to O’Leary, the main reason to justify his renunciation was considering that one of the RYA weaknesses was being associated to himself just because of his polemical speeches, in 90’s, about aviation’s unions. The Ex-CEO admits that his decision was taken as an opportunity to reclaim the airline’s reputation. So, currently O’Leary is established as CEO of the Group with the responsibility to supervise all the four subsidiaries: Ryanair Sun, Laudamotion, Ryanair UK and Malta Air. The Board is composed by 1 Executive and 11 Non-Executive Directors (since RYA wants to preserve its Board’s independence) and 33% of the current board are female. In line with the functions of the Nomination Committee, that appoints the selection of Directors, the Board keeps its composition under analysis to guarantee that it includes the required skills
7
and experience to accomplish its role. When we take a look at directors’ biographies, we assume that the Board includes directors with extensive business experience and range of skills, knowledge and diversity, most of them in the aviation sector, what gives an advantage to the Company. As example, David Bonderman (in RYA since 1996), Michael O’Leary (in RYA since 1988), Michael Cawley (in RYA since 1997 as Deputy CEO and Chief Operating Officer who contributed significantly to the Company’s growth), Kyran McLaughlin (who advised RYA during its initial flotation on Dublin stock market in 1997) and Mike O’Brien (who has a long distinguished career in the aviation industry with positions as Head of Flight Operations Inspectorate with Maltese Civil Aviation Authority and as Head of Operations Standards with Irish Aviation Authority).
Inside the Board there are five committees: audit, executive, nomination, remuneration and safety. When the matters is the independence of the Board’s Directors, the Board has carried out its annual evaluation of the independence of each of its Non-Executive Directors to verify if each Director is independent in character and judgement and free from relationships or circumstances which are likely to affect the Director’s judgement.
Economic Outlook
The World GDP growth is expected to remain between 3% and 4% until 2023 (Figure 9), however, the world GDP still swallowed with the deceleration in global economic activity due to some uncertainty perspectives. Factors as the geopolitical tensions which stir energy prices; the global trade tensions mainly between US and China that contributes to slowed investment in trade-oriented sectors; the Brexit agreement; the vanishing effects of fiscal stimulus policies in US; the decline in the automobile sector in Europe; the power shortages in South Africa; the oil production cuts by OPEC and other oil producers and others natural disasters as cyclone Idai which its impacts were severely felt are determining the path of the world economy in 2019 and in the next years. In line with these trends and guidelines, European GDP growth is forecasted to register a change around 2% a year until 2023 (Figure 9) but still clouded by the side effects of global economic issues. In fact, Brexit remains the major source of uncertainty in European economy. On the other hand, exports remain subdued and Europe’s inflation is still moderate, despite rising wages and robust demand and private consumption, mainly due to bottomed down of energy price.
Ireland’s GDP still growing above the European average growth rate, however this tendency is forecasted to slow down until 2023 (Figure 9). It is expected that the GDP growth of 4,1%, in 2019, starts a decreasing trend until 2023,where it is predictable a growth of 2,7%. Actually, Ireland’s economy goes through good prospects due to an increasing in employment, a strong growth in wages, a dropping in unemployment rate, a robust private consumption, with its trade and investments remains seriously influenced by activities of multinationals. On the other hand, as others countries in Europe, there are some evidences of a decreasing in 4. INDUSTRY OVERVIEW AND COMPETITIVE POSITIONING
Figure 8. Source: IMF.
exports with the weakening of external demand and also a particular uncertainty given the Brexit agreement and eventual changes in the international taxation environment.
Basically, the UK’s future inside the EU is one of the most important features to define the path of growth and development within the Europe and worldwide. UK’s GDP growth rate is set, in 2019, at 1% and it is expected to continue changing around this value, in the following years (Figure 9). Currently, UK shows a Brexit-dependent economy with a sluggish and irregular economic activity. Due to the uncertainty, UK faces a waning in investment but, given its expansionary fiscal policy and a modestly increasing in real wages, private consumption is expected to continue thriving, filling some fragilities and gaps in the economy’s growth. Brexit
Considering that the Brexit is the next step between UK and EU, the challenge is to try to achieve an agreement, minimizing disruption to both economies. There were firmed temporary measures which allow flights to continue without any legal change for a period of 9 months after a ‘’no deal’’ Brexit. This is an issue to many airlines companies (as well to RYA and its low cost competitors which are based on UK or have a significant share of revenue coming from UK) and regarding these considerations, a temporary measure will not remove all RYA concerns about flight rights, ownership structure, employment rules, taxation status and freedom of open aviation market between UK and Europe. It should be taken into account that adverse changes in any of these arrangements could impact on RYA financial and operating condition.
In fact, as an European company under the European regulation, RYA needs to ensure that it remains majority owned and controlled within the EU to guarantee that its licenses in Ireland, Poland, Austria and Malta will be maintained and the Company will continue to operate freely. In order to be achieved this, RYA placed the necessary legal measures to restrict non-EU shareholders voting rights and restrict also non-non-EU share sales for a short period of months.
An additional measure taken by RYA, as a contingency plan to tackle an event of disruption to existing traffic rights due to Brexit, was the creation of Ryanair UK, a subsidiary protected by the UK air operator certificate (AOC). This is motivated by the significant amount of revenues that came from UK aviation market which totalizes 22% of total revenues, in FY2019. Brexit has already caused, and may continue to cause, volatility in currency exchange rate fluctuations specially the depreciation of Pound Sterling against Euro (Table 5). As the Company earns a substantial portion of its revenues in Pounds Sterling, the decline of the value of the Pound and recession in UK impacts materially on RYA financial and operating results. For the remainder of FY2020, RYA estimates that every Pence Sterling movement in the €/£ exchange rate will impact income in € 7 million. Brexit can also devaluate the € against US dollar and if this happens the Company has to spend more on fuel, whereas the price of oil is in US dollars. As we will see further, to mitigate and minimize the negative impact of these market risks relating to fluctuations in commodity prices, in currency exchanges rates and also in interest rates, RYA uses various
Table 5 - Yearly average exchange rate against €.Source: OFX.
9
derivative financial instruments (as currency swaps, interest rate swaps, commodity forwards and currency forward contracts). For example, RYA currently enters into forwards contracts for the purchase of some jet fuel that it expects to use; uses foreign currency forward contracts to reduce its exposure to risks related to volatility of foreign currencies against euro, namely the US dollar; and enters into interest rate contracts with the objective of fixing certain borrowing costs and hedging principal repayments, mostly of those associated with the purchase of the new Boeing 737.
Interest Rates
RYA purchase of 159 of the 455 Boeing 737-800 aircraft in the fleet has been funded by financing in the form of loans supported by a loan guarantee from Export-Import Bank (144 aircrafts), from Japanese Operating Lease with Call Option (12 aircrafts) and from commercial debt (3 aircrafts). Furthermore, the Company has raised unsecured debt via capital market bond issuances. In FY2019, the outstanding cumulative borrowings totalizes €3,644 million with a weighted average interest rate of 1,38%. RYA’s defends itself from changes in interest rates through the interest rate swaps agreements to avoid negative impacts in the fair value of its liabilities. For example, if RYA did not entered into such derivatives agreements, a variation +/- 1% in interest rates would have led to an impact on its liability by €2.9 million. In line with this, a movement of +1% in interest rates would result in a decrease of €5.1 million in net interest income and a -1% change would result in an increase of €9.9 million in the same item.
The past and forecasted behaviour of the interest rates can be seen in Figure 10.
Fuel and Oil Prices
In airline industry, two main types of fuel are used: the Brent crude oil and the Jet kerosene, whose prices are correlated. The first one is extracted with the final purpose of being refined into common gasoline and it is characterized for being light (given its low density) and sweet (given its low sulphur composition). The second one comes from the distillation of crude oil to be used as aircraft fuel. As it can be seen through Figure 11, prices of both fuels revealed some volatility in last years and, until the end of 2019, are expected to remain around the same values.
Oil price depends on geopolitical, financial, economic and social factors as global economic situation, the demand and supply for oil or the regulations and decisions to cut oil production from producers as OPEC, US or Russia. Currently, the low prices reflect trade tensions between US and China and is justified due to strategic decisions between Saudi Arabia, US and Iran that had an unexpected outcome and led to an excess of oil in the markets. Another reason that justifies the volatility of the oil prices is the inconstancy of seasonal swings between high and low demand months. However, in 2020, with an expected increasing in oil demand and the adjustment of the US and OPEC’s policies, the oil prices are forecasted to rise up.
Considering that, in FY2019, fuel cost represented 36% of RYA’s total operating expenses and analysing the volatility of fuel’s prices, RYA
Figure 10 - Interest Rates in Euro Area, % per annum. Source: OECD.
Figure 11 – Fuel and Oil Prices. Source: IATA.
Figure 9. Source: OECD.
defends itself, as occurs with foreign exchange rates and interest rates, against unpredictable movements of oil prices using commodities forwards contracts, pursuant which Ryanair and a counterparty agree to exchange payments equal to the difference between a fixed price for a given quantity of jet fuel and the market price for such quantity of jet fuel at a given date in the future. With this, is stablished that RYA receives the amount of any excess of such market price over such fixed price and pays to the counterparty the amount of any deficit of such fixed price under such market price.
Based on RYA fuel consumption, in FY2019, a change of $1 in the average annual price per metric ton of jet fuel would have led to a change of €3.3 million in RYA fuel costs.
To understand the priority of these hedging strategies for RYA, on the 25th July 2019, RYA had entered into forward jet fuel contracts which covers 90% of its estimated fuel requirements for FY2020 and 37% for FY2021.
Airline Industry Outlook
The global travel and tourism, in 2018, grew at 3,9% to contribute a record of $8,8 trillion and 319 million jobs to the world economy. Airline industry is a key advent of globalization because it facilitates global trade, tourism and economic growth. However, it has been revealed a cyclical and volatile industry given its susceptibility to political, social and economic factors.
Currently, 1% of world GDP is spent on air transportation, totalizing $899 billion (Table 6). The airline industry in last years has suffered many changes as the boost in capacity to serve an increasing in demand, the reduce in average fares that has abled more passengers to fly, the rising costs mainly due to personnel and fuel costs and operating margins negatively affected by the huge competition. And these are the main reasons to assume that is a challenge to thrive in air transportation sector. Nowadays, the biggest challenges to be faced in the industry is the expected increasing price of jet fuel, the rising of labour costs, the offsetting of carbon emissions regarding strict environmental regulation, some regional and political instabilities and the impact of capacity growth on an already constrained infrastructure (in the air with overworked air traffic controllers and in the ground with overly congested airports). In the EU, since 2017, the social media has noticed a bunch of airlines which ceased its operations due to competition and low cost business models. So, in the industry, it has begun a battle of growing capacity and revenue while it is primordial maintaining and improving operational resilience.
Airline passengers industry is segmented in two fractions that are full service carriers (FSC) and low cost carriers (LCC). The first one operates with flights in big and main hub airports around the world, connecting major cities and providing a high standard level as comfortable seats, free food and beverage on-board and in-flight entertainment. FSC should be divided in Hub Airline Companies (HAC) and Luxury Airline Companies (LAC). HAC has its business focus on cost leadership plus differentiation and LAC
Table 6 - Data of Worldwide Airline Industry. Source: IATA.
11
has a differentiation focus which connotes luxury service based on excellence and quality. On the other hand, LCC operates with aircrafts with less comfort and with a high seat density on point-to-point flights connecting secondary airports, usually with no free food and beverage and without in-flight entertainment with the scope of enabling efficiency improvements in its operating processes and cost reduction.
In the last years, LCC are representing a bigger share of total air transportation market (Figure 12). In 2016, LCC had 25% of total flights around the world and, in 2018, increased its share to 31%. In fact, with low average fares due to its business focus, LCC has enabled more passengers to fly, achieving an important target in the market.
Demand and Supply
Mainly, due to LCC business models which allowed more people to fly and a strengthening global economy, the demand and supply in airlines industry has been booming in the last years.
In the end of 2019, it is expected to reach the record of 4,6 billion passengers carried by airlines companies, which means an increase of 5%, since the end of 2018, and an increase of 31%, since 2015 (Figure 13). It is also forecasted an estimated annual growth rate for passengers air traffic, between 2019 and 2038, of 4,6% in the global market and 3,6% in European market, where RYA rolls its main operations (Figure 14).
Regarding the eight biggest national markets based on passengers traffic, until 2022, it is projected to include countries as UK, Spain, Germany and Italy (Table 7), where RYA operates and extract a significant part of its operating revenues.
When the purpose is measuring, analysing and comparing the demand and supply in airlines industry, we need to take into account metrics, previously mentioned, as RPK, ASK and PLF (Table 6).
RPK is a metric focused on the demand, often referred as airlines traffic, and, since 2017, in the global air passenger market, has increased around 13%, expecting to totalize 8740 billion by the end of 2019. In Europe, was registered a trend with identical behaviour, but with fewer positive changes year over year.
ASK, in the supply’s side, measures the capacity of airlines companies and registered, in the global air passenger market, a positive variation of 12%, since 2017, considering the forecasted value of 10 646 billion, in 2019. In Europe, ASK growth rate occurred with major positive variations year over year.
The combination of these two metrics results in another important measure that is PLF which measures how much of airlines capacity is used, basically, how full aircrafts are during the flights. And given the forecasted value for PLF, in 2019 for the global air passenger market, of 82,1% can be seen an additional raise in PLF. In an antagonistic perspective, the PLF, in Europe, was reduced due to increasing in ASK and a lower growing in RPK. Basically, we can assume that European demand didn’t go along with the supply.
Figure 12 – Air Transportation Market Share. Source: Statista.
Figure 13 – Total Passengers Carried. Source: Statista.
Figure 14 – Estimated Annual Growths Rates for Passenger Air Traffic from 2019 to 2038. Source: Statista.
Table 7 - Ranking of countries with biggest passenger traffic. Source: IATA.
Figure 11. Source: Statista.
Figure 12. Source: Statista.
Figure 13. Source: Statista.
Table 1 – Ranking of countries with biggest passenger traffic. Source: IATA.
Linking both data on Figure 15 and Table 6, it is perceptible another present issue on airlines industry that is the past and forecasted behaviour for the revenues and expenses and its impact in the operating profit.
Given the intense competition among all airlines and the increasing in its expenses, the operating profit is declining. In fact, according to prospect, by the end of 2019, revenues will totalize $865 billion (+15% than in 2017) mostly due to the increasing in revenue passenger that will be set at $589 billion (+10% than in 2017). On the other hand, expenses will totalize $822 billion (+18% than in 2017). This escalation in expenses incorporates more costs with two main sources of expense as fuel (+18% since 2017) and personnel (+12% since 2017), which is explained by the fact of having more industry capacity, meaning more aircrafts and implying more staff allocation and more fuel consumption. Personnel expenses has another theoretical reason behind that is the legal aggravation of required compensation framework in case of flight cancellations and delays. These operating considerations will lead, by the end of 2019, of an industry operating profit of $43,6 billion (-23% than in 2017).
Competitors and Peers Group Analysis
Considering the number of the passengers carried (Figure 16), RYA competes against any other worldwide airline company. So, RYA main competitors are European HAC as Lufthansa Group, Air France-KLM, IAG and Turkish Airlines; and European LCC as EasyJet, Wizz Air and Norwegian Air Shuttle.
In this list, we can set the RYA peers following two assumptions that are being a company which operates in Europe and being a low-cost airline with the same type of any LCC’s strategy. Consequently, Vueling (IAG), Eurowings (Lufthansa Group), Transavia (Air France-KLM), EasyJet, Wizz Air and Norwegian Air Shuttle are considered as peers.
In order to situate RYA in its peers group, we do a comparison using five indicators as the number of passengers carried, the operating profit, RPK, ASK and PLF (Table 8).
In FY2019, RYA led its peers in all of the considered indicators. RYA carried 142 million of passengers (more 53,5 million than EasyJet with the best performance among the peers) and totalize an operating profit of
Figure 15 – Worldwide Passenger Revenue, Operating Profit and Annual Growth in Traffic Passenger. Source: IATA and Statista.
Figure 16 – Leading Airlines based on number of Passengers in Million. Source: Statista.
Figure 14. Source: IATA and Statista.
Figure 15. Source: Statista.
Table 1 – Peers Group comparison. Source: Annual Reports from each Peer.
13
€1016,8 million (more €500 million than EasyJet). According to PLF, RYA still outperforms over its peer group with a Load Factor of 96% (leaving the second place to EasyJet with 92,9%). When we take into account the demand and supply metrics as RPK and ASK, RYA show numbers, in million, as 176,961 and 184,838, respectively (while EasyJet stays with values of 98,522 million and 104,800 million, respectively).
Acquisitions: Lauda and Air Malta
Since the beginning of 2019, RYA made a good progress in developing its group airlines. In January, RYA acquired 100% of Laudamotion (currently, known as Lauda), Austrian no1 low fares airline. RYA stablished an ambitious growth initiatives as (i) in summer 2020, totalize a fleet of 30 aircrafts; (ii) grow its traffic from 4 million passengers to 6 million in FY2020 and 7,5 million in FY2021; (iii) operate in four bases with the main focus on Vienna to secure its position as no2 Austrian airline behind Austrian Airlines; (iv) increasing 20 new routes and (v) integrate new 400 pilots, cabin crew and engineers. The main challenge is the management and maintenance of its Airbus fleet, however, the Group look at this fact as a growth opportunity. On the other hand, Lauda provides access to valuable landing slots at slot constrained airports in Germany, Austria and Spain. In June, RYA purchased Malta Air from the government of Malta in order to grow its presence in Malta, to access non-EU markets as North Africa and to reduce operating costs due to Maltese legal taxation regulations. RYA stablished growth initiatives as (i) switch 6 Malta based aircrafts onto the Maltese register; (ii) compose a Maltese based crew of 200 people; (iii) increase its Malta based fleet to 10 aircrafts and (iv) create 350 jobs within 3 years.
Buzz: Rebranded Ryanair Sun
During 2019, the old Ryanair Sun will be rebranded as Buzz and it was profitable already in its first year. The main goal of RYA with the Polish subsidiary is to stablish Buzz as Poland no1 charter airline in FY2020. Currently, Buzz fleet is composed by 7 aircraft in the charter market and 17 of RYA aircrafts based in Poland.
Competitive Positioning
At the end of 2017, the RYA Board defined as strategic progression axis the operation of long-haul flights. So, a commercial agreement was done with Air Europa in order to allow customers to book their long-haul flights (operated by Air Europa) to US and Latin America, through RYA website. In the early months of 2019, this agreement was suspended due to a lower bookings than expected.
However, in addition to Lauda and Air Malta acquisitions, the launch of Ryanair UK, the rebranding of Ryanair Sun, RYA is aiming the boost of its strength as airlines Group. In FY2019, RYA launched 316 new routes across its network, invested in the renewal of its fleet through the purchase of the new and more efficient Boeing 737-MAX-200 and managed its environmental impacts delineating a strict Environmental Policy. The Company has invested heavily to improve its punctuality and resilience despite all air traffic controllers and staff strikes.
Another key element in its growth’s strategy is the AGB Program that, as mentioned before, is focused on delivering real benefits for Company’s guests. The 6th year of the program is driven by the slogan ‘’More Choice, Lower Fares and Great Care’’. The AGB’s priorities are the lowest fares, punctuality, the customer care charter and care improvements.
In order to approach RYA competitive positioning, the management tools as SWOT Analysis and Porter’s Five Forces Model have a main role in this analysis. The first one, SWOT Analysis identifies strengths and weaknesses of the Company that could give advantages or disadvantages to the business model; and opportunities and threats in the environment that could exploit or damage Company’s business (Table 9). The Porter’s Five Forces Model analyses the five forces that shape the industry (Figure 17).
Swot Analysis
Porter’s Five Forces Model
• Threats of New Entrants (Low)
Entering and stablishing in the airline industry is a really huge challenge mostly due to the high cost of the aircrafts which require large capital to invest and also because it is difficult to implement a strong brand position. In fact, it can take many years due to the high quality and safety standards of many airlines. As mentioned previously, the distribution channels are becoming even busy in the air with overworked air traffic controllers and in the ground with overly congested airports. By the way, the threats of new entrants are not remote so far, mainly because of many HAC that are creating its own LCC or, in other cases, change its business strategy to low-cost models.
15
• Threats of Substitute Products (Low)
The main substitute products are passenger’s transportation by car, bus, boat and train; and when we compare to the air transportation it is visible that air transport provides high standards of quality, comfort, safety, quickness and trip lengths, all of this at an affordable price.
• Bargaining Power of Consumers (Medium-High)
In fact, the switching costs to choose among all airlines are not very high, which enables consumers to pick the best flight according to their needs. This mixed with a low brand loyalty in the industry, gives a considerable bargaining power to customers. This industry force was the principal reason to set high levels of rivalry and competition between airlines companies, which are forced to reduce costs in order to practice low fares.
• Bargaining Power of Suppliers (Low-Medium)
In Europe, the main airline companies work with two main aircraft suppliers - Airbus and Boeing. The switching cost to change from one to another is high because it implies huge capital requirements and different trainings to the pilots, cabin crew and engineers. The latest progress was developed by Chinese aircraft producers as Comac, presenting jets with more seats and with higher level of efficiency in fuel consumption. In response to this, Boeing created the new generation aircraft Boeing 737-MAX-200 with identical features. This will be the choice of RYA to regenerate its fleet.
• Competitive Rivalry (High)
As explained before, rivalry in airlines industry is roughly high, competing for best offerings of prices and services. Due to this, many airlines are considering changing its business strategy in order to earn a superior market share. Basically, these features are the main reason to the decreasing of the operating profit margins in the industry.
With the ultimate goal of evaluating RYA, two absolute valuation models (Discounted Cash Flow Approach – DCF - and Adjusted Present Value Approach - APV) were used. A relative analysis was also elaborated, using a relative valuation model, the Multiples Approach.
According to DCF, the main model used to support the final recommendation of HOLD, we achieved a target price of € 10,95, meaning an upside potential of 6,37%, considering the reference price of RYA shares € 10,29 at 27th September of 2019. To complement the analysis, we reinforced the investment guidance with APV model, through which we obtained a slightly higher target price of €11,1. Representing an upside potential of 7,9%, we kept the HOLD recommendation (Table 10).
Taking into account the relative model of Multiples, the scenario is completely different regarding the price achieved, reaching an average target price of €7,5, which means a downside potential around 27%. 5. INVESTMENT SUMMARY
Figure 17 – Porter’s 5 Forces Model. Source: Author
Although, this situation can be seen as biased given the weaknesses that the aviation industry is facing along in 2019 and are prospected to remain in 2020. In fact, the huge competition has settled down operating margins, overthrown brutally average fares, sinking many airlines in overcapacity issues. Last year was critical due to the bankruptcy of many competitors or some airlines being acquired by strong airlines groups given its operating and financial fragilities. It is expected more to follow this trend. For that reason, this result is not taken into consideration as completely valid because RYA business structure is well-established and defined, what can make RYA more resistant to negative cyclical shock in the industry.
The HOLD recommendation is mainly supported by the following key drivers:
• Guidelines of the airline industry future
Along with the projected European GDP growth around 1,8% for the next years, inside airline industry is expected to register YoY increases in key metrics as RPK and ASK. On the other hand, it is expected for PLF to be damaged as ASK is projected to increase at a quicker pace than RPK. It can raise overcapacity issues and drives down the average fares. The same could happen with the revenues and expenses increasing both, although expenses are forecasted to grow quickly, causing the reduction of operating profit.
RYA is aware of the situation, what led Michael O’Leary to assume that, for the next two years, the main axis of growth progression will be the aggressive cuts in fares with the main purpose of driving out rivals. Those strategies can be painful to operating and financial results with profits broadly flats. In fact, RYA should follow trend of the industry, in order to thrive in the near future. So, basically, RYA will lead a load-active strategy, filling its aircrafts even if it is needed even more lower fares. In FY2019, RYA presented the worst profit in last five years, turning down its increasing tendency until FY2018, due to boosts in fuel and personnel expenses and given Lauda losses. At the time that annual report was formally presented, RYA shares immediately devaluated, recovering its value within few days as people showed up willing to accept the fact that the RYA Board expects lower profitability for the next couple years in return for gaining much more market share.
Another fact that should be taken into account, is the LCC’s constant gains in market share. For that reason, as RYA still leading the European LCC market, is expected to be the first to take and explore all advantages of that.
• Cost containment
The cost containment is one of the most important key drivers of RYA business strategy. This is what enables to operate with lower fares. Additionally, RYA continues to deliver the lowest unit cost of any EU airline and the cost gap between RYA and its competitors has widened in these last years. To maintain and preserve this competitive advantage, in
Table 10 - Valuation Summary. Source: Author.
17
2020, RYA plans to close, cut or reduce activity in some bases and routes that have been revealed inefficient for its growth strategy. In line with this, during the winter, RYA will ground, seasonally, 65 aircrafts in order to reduce fuel, staff and airport expenses due to a period with lower traffic and lower levels of revenues.
Besides the mentioned above, another main expense is the personnel costs and RYA plans to manage its staff surplus of 900 people (500 pilots and 400 cabin crew) with transferences to other bases. With unpaid leaves and with the allocation of staff, some of them in Lauda and Buzz, it will be possible to avoid collective dismissals.
RYA will also renegotiate contracts with existing suppliers, airports and handling operators in order to reduce existing expenses.
As will be dealt and explained ahead, the cost reduction with fuel and oil will be very dependent on the arriving of new Boeing MAX that enables to increase passenger capacity per aircraft allied with the cut of fuel consumption, around of 16% per seat.
• Long-term strategy well defined to prosper
Since the early 90’s, RYA reproduced the successful low cost business model of Southwest Airlines, in the USA. With the first mover advantage, in Europe, RYA stablished strong operational and organizational synergies that enables the Company to lead European and worldwide LCC segment. Even with some diseconomies of scale and overcapacity issues, decreasing of profits and high levels of expenses with fuel and staff, RYA is focused in its passengers’ growth YoY, in increasing and renewing its fleet to take advantages of that, creating subsidiaries and acquiring other small airlines in order to benefit from local markets positions and define even more routes. Along with this, RYA is still to preserve its commitment to quality, safety and punctuality maintenance, while taking some advantage of internet to boost its ancillary revenues.
• Brexit
Given the last news about this topic, until the last days of October, UK expects to firm its exit from EU with or without a consensual agreement. In the last months, since the British people voted for Brexit, RYA take measures to minimize or avoid eventual consequences of Brexit, as was said and explained before. Besides the assurance of still being a majority owned and controlled within EU to maintain its European flight licenses, RYA created Ryanair UK, a subsidiary secured by UK’s AOC, conducive to provide contingency in the event of disruption to existing traffics rights. However, it is expected that open skies will remain.
Despite all these plans, the uncertainty around Brexit agreement can raise issues that cannot be contained as the depreciation of pound sterling against Euro and an eventual devaluation of euro against US dollar, what would impact RYA financial and operating condition. These unpredictable movements in foreign currency rates can be so abrupt that, even with RYA hedging policy, cannot be detained, resulting in tough coverage losses.