7
PHARMACOKINETIC-PHARMACODYNAMIC
CORRELATION FOR MEROPENEM APPLIED
TO A BURN CHILD USING A BIOANALYTICAL
LIQUID CROMATOGRAPHIC METHOD
Silvia R. C. J. Santos, PhD
e-mail: pharther@usp.br
Cristina Sanches-Giraud, PhD Carlindo Vieira Jr., chemist/analyst Flávio F. de Souza, clinical pharmacist
School of Pharmaceutical Sciences University of Sao Paulo – Sao Paulo/SP, Brazil
David S. Gómez, MD Edvaldo V. Campos, MD Rodrigo P. de Azevedo, MD Marcus C. Ferreira, MD
Plastic Surgery and Burns, Hospital das Clinicas da Faculdade de Medicina da Universidade de Sao Paulo/SP, Brazil
Jorge W. L. Nascimento, PhD
Institute of Biological Sciences - Pharmacology Department, Federal University of Juiz de Fora – Juiz de Fora /MG, Brazil
Abstract
Bioanalytical method for LC meropenem quantification in plasma was described. Good absolute recovery (higher than 90%), adequate linearity (0.2-50.0 µg/mL, r2=0.999), high sensitivity (LOQ: 0.2 µg/mL; LOD: 0.1
µg/mL) and acceptable stability were shown. Interday/intraday precisions were 2.3%/2.0% and the mean ac-curacy was 98.9%. Case of one burn patient, 8 yrs, 30 kg, thermal/inhalation injury, 45% TBSA was reported. Meropenem was prescribed to pulmonary infection treatment and dose adjustment was performed by drug plasma monitoring (30th and 44th day of thermal accident), pharmacokinetics and pharmacokinetics-phar-macodinamics (PK-PD) modelling. On 5th and 19th day of meropenem treatment, trough drug plasma concen-trations were 0.3 µg mL-1 (2.25 ga day: 0.75 g 8qh, 0.5 hour infusion) and 14 µg mL-1 (3 g a day: 1 g 8qh).
Pharma-cokinetics was altered on 5th day and also on 19th day, respectively: 1.3 and 3.3 hs (biological half-life); 6.4 and 1.7 mL/min.kg (plasma clearance), 0.7 and 0.5 L/kg (apparent volume of distribution). 40%fT>MIC (percentage
of time above the minimum inhibitory concentration) was considered for PK-PD correlation. In conclusion, LC drug plasma monitoring was quite useful to guarantee low risk and drug efficacy. Since the pharmacoki-netics is unpredictable in burn patients, the effectiveness of meropenem was reached when dose regimen of 1 g 8qh instead 0.75 g 8qh was applied to the paediatric burn patient.
Keywords: Meropenem, LC, burn child, drug plasma monitoring, pharmacokinetics-pharmacodinamics
correlation.
Resumo
O trabalho descreve o método bioanalítico para a quantificação de meropenem no plasma através da croma-tografia líquida. Os resultados obtidos indicam óptima recuperação absoluta (>90 por cento), boa lineari-dade (0,2-50,0 µg/mL, r2=0,999), alta sensibilidade (LQ: 0,2 µg/mL; LD: 0,1 µg/mL) e adequada estabilidade.
Registou-se boa precisão (inter-dia/intra-dia: 2,3%/2,0%) e óptima exactidão, 98,9 por cento. O trabalho reporta o caso de um doente pediátrico grande queimado, oito anos, 30 kg, lesão térmica/inalatória, 45 por
8
cento de superfície corporal queimada, recebendo meropenem para tratamento do foco pulmonar da infec-ção; a dose foi individualizada através da monitorização plasmática em dois períodos (30.º e 44.º dias do acidente, fogo/gasolina), estudo farmacocinético e correlação farmacocinética-farmacodinâmica (PK-PD). As concentrações plasmáticas de meropenem obtidas no vale foram de 0,3 µg mL-1 (2,25 g/dia: 0,75 g 12/12h, infusão de 0,5 por hora) e de 14,0 µg mL-1 (3 g/dia: 1g 8/8h), respectivamente no 5.º e 19.º dias de
tratamen-to. A farmacocinética mostrou-se alterada nos dois períodos de tratamento relativamente aos parâmetros: 1,3/3,3 horas (meia-vida biológica), 6,4/1,7 mL/min. kg (depuração plasmática) e 0,7/0,5 L/kg (volume apa-rente de distribuição), respectivamente no 5.º e 19.º dias de tratamento. Considerou-se para a correlação farmacocinética-farmacodinâmica o valor de 40%fT>CIM (percentagem do tempo acima da concentração
inibitória mínima) como índice de predição de eficácia do antimicrobiano. Em conclusão, a monitorização das concentrações plasmáticas do meropenem é fundamental e aplicável na garantia da eficácia e baixo ris-co. Uma vez que a farmacocinética é sempre imprevisível nos queimados, a efectividade do meropenem foi atingida para o doente quando o regime de 0,75 g, 8/8h foi substituído pelo regime de 1g 8/8h.
Palavras-chave: Meropenem, grande queimado, cromatografia líquida, monitorização terapêutica, doente
pediátrico, correlação farmacocinética-farmacodinâmica.
1. Introdução
Meropenem is a broad-spectrum carbapenem agent that has been widely used against life-threatening in-fections in burn patients1. Pharmacokinetic studies in
healthy male subjects have shown that meropenem has dose-independent kinetics, it is excreted by the kidneys with a biological half-life approximately of one hour2,3.
In burn injury, factors such as the area and depth of the burn, the presence of sepsis, the degree of hydration, serum protein concentrations, age, creatinine clear-ance (CLcr) and period of time after injury may affect drug pharmacokinetics (PK)4,5. Patients with major
burns showed reduction of the antimicrobial activity as a consequence of PK changes due to the extensive hydration and physiological alterations following the burn injury6. On the other hand, considering
mero-penem in paediatric patients few clinical studies were done, and no data related to PK in burn children were found. A thorough understanding of its pharmacoki-netics in paediatric patients it is important to opti-mize meropenem dosing regimens7.
A survey of literature has revealed several analyti-cal methods for the determination of meropenem in biological fluids using high cost procedures including LC-MS/MS1 and capillary zone electrophoresis8 or a
very low coast and simple procedure by microbiologi-cal assay that always presents quite low specificity9.
Objective of the present study was to develop and validate a simple bioanalytical method to deter-mine meropenem in plasma according to Food and Drug Administration (FDA) guidelines10 for
drug plasma monitoring, pharmacokinetics and PK-PD correlation studies focusing on dose adjust-ment required to paediatric burn patients.
2. Case Report
Patient JCB, male, 8 years old, 30 kg, 18.6 kg/m2, with
45% of total body surface area (TBSA) and thermal injury on the face, neck, chest, abdomen, upper and lower limbs. Patient presented also severe inhalation injury when admitted on the day of the fire accident (petrol) in the intensive care unit (ICU) of Burn Cen-tre. Additionally, a cognitive deficit and epileptic sei-zures were reported by the mother to the physician. The protocol was previously approved by the Hospi-tal’s Ethics Committee. The legally responsible person was informed in details about procedures to be per-formed during treatment and the written consent was obtained.
Pharmacotherapeutic follow up for burns included several drugs like bromopride, chloral hydrate, fen-tanyl, gabapentine, glutamine, hydrocortisone, keta-mine, lorazepam, methadone, methamizole, mida-zolam, norepinephrine, omeprazole, polyvitaminic, promethazine, propofol, rocuronium bromide and also hydro electrolytic agents; phenobarbital and pheny-toin were included to control seizures. Antimicrobi-als required for the control of sepsis were meropenem, polymixin B, vancomycin, and also for fungal infection fluconazol was included. After the thermal injury, sur-gical procedures as debridement were done on days 12, 18, 36 after the accident followed by auto skin grafting on days 14, 20, 40. On 25th day of patient in the ICU,
9 he received vancomycin (67 mg/kg a day, one hour
in-fusion) plus meropenem 75 mg/kg (2.25 g daily, 0.75 g 8qh, 0.5h infusion) based on pulmonary infection plus sepsis. Blood sampling for drug measurement was done at steady state (5th day of treatment) on 30th day. Based on laboratorial data related to drug plasma measurements and clinical follow up, the daily dose was increased and a new dose regimen was applied to reach effectiveness; then a second serial of blood sam-pling was done on 44th day; patient was receiving the antimicrobial therapy consisting of vancomycin (2 g a day/0.5 g 6qh) plus meropenem 100 mg/kg (3 g a day, 1 g 8qh) and polymixin B (day 9: 500.000 UI 8qh). Flu-conazole 13mg/kg (day 3: 400 mg daily/200 mg 12qh, one hour infusion) was included as recommended by committee of control of hospital infection due to the persistent fever 5-6 peaks a day (39.2oC, maximum).
Antimicrobial treatment with meropenem was com-pleted on 44th day of hospitalization. Therapeutic drug monitoring and pharmacokinetics were per-formed by blood collection from the central venous catheter. Venous blood samples (1 mL each, sodium EDTA tube BD, Sao Paulo, Brazil) were collected at 0.5 hour infusion (end of meropenem infusion) and 1, 2, 4 and 8 hours of drug administration. Plasma was separated by centrifugation at 2800 g for 15 min for drug analysis on the day or then, stored at -20oC
un-til drug analysis. Pharmacokinetics was investigated in two independent periods on 30th day and also on 44th day post accident. Meropenem’s kinetic disposi-tion was performed by applying the software “PK So-lutions” v. 2.0 Noncompartmental Pharmacokinetics Data Analysis (Summit, OH, USA). PK-PD modelling was applied with basis on the parameter “time interval required to maintain drug plasma concentration above the minimum inhibitory concentration (40%fT>MIC)”
reported previously4,11. Since the minimum inhibitory concentrations (MIC) of pathogens aren’t measured in all hospitals as part of routine clinical practice, data obtained in the present study were based on in vitro
microbial susceptibility available (www.eucast.org/ mic_distributions) in EUCAST12; considering theMIC: 0.5, 2.0 and 8.0 mg/L.
3. Materials and Methods
3.1. Reagents and Chemicals
Drug standards of meropenem and cefepime (internal standard) and 3-(N-Morpholino)-propane sulphonic acid (MOPS) were purchased from Sigma (St. Louis, MO, USA). All solvents (LC grade), reagents for drug plasma purification and liquid cromatography (LC)
analysis were purchased from Carlo Erba (Milan, It-aly). Purified water was obtained from Millipore Sim-plicity System (Milford, MA, USA).
3.2. LC System
The chromatographic system consisted of a Shimadzu model LC-10AVP solvent delivery module (Kyoto, Ja-pan), equipped with a SCL-10AVP controller/software Class VP, auto sampler model SIL-10ADVP and a de-tector UV-VIS model SPD-10AVP. Peak area of drug to its internal standard was integrated by the software Class VP/computer Intel Celeron. Analytical column was a Shimpack ODS, 150 x 6.0 mm, 5 um (Kyoto, Ja-pan) connected to a Nova Pak C18 guard column (Wa-ters Assoc., Milford, USA).
The mobile phase consisting by a mixture of 0.01 M acetate buffer pH 5.0 and acetonitrile (90:10, v/v) was
freshly prepared on the day use, filtered through a 0.45 µm filter and helium degassed for 3 minutes. Chroma-tographic analysis was performed using an isocratic system at a flow rate of 0.7 mL/min at room tempera-ture. Injection volume was 10 µL and the effluent was monitored at 307 nm. Run time of 10 minutes was re-quired to guarantee the selectivity of chromatographic analysis.
3.3. Preparations of Standards and Internal Controls
Standard stock solution was prepared by dissolv-ing the appropriate amount of meropenem standard (50 mg), accurately weighted in the 5 mL volumet-ric flask, with purified water to reach a final drug concentration of 10.0 mg/mL. Plasma standards con-taining MOPS 10% (2:1, v/v) were prepared to obtain 50.0, 25.0, 12.0, 6.0, 3.0, 1.5, 0.6, 0.4, 0.2 µg/mL of mero-penem in plasma by adding the appropriate amount of stock drug standard solution to drug-free human plasma. Linearity was investigated in the range 0.2 – 50.0 µg/mL and the calibration curve was constructed daily. Also, internal controls were prepared by dilution of the stock solution with drug free plasma to obtain the high (40 µg/mL), medium (20 µg/mL) and low (0.6 µg/mL) concentrations and stored until assay at -80 µC. Internal standard (IS) was cefepime and the stock solution was prepared in purified water to obtain 1 mg/mL and kept at -20oC until assay. The working solution of the internal standard was prepared freshly by diluting stock solution with water to reach the con-centration 50 µg/mL.
3.4. Sample extraction procedure
10
standard working solution (50 µL), and then, tubes were added of plasma (200 µL), MOPS 10% (100 µL) followed by 600 µL of acetronitrile for the precipita-tion of plasma proteins. The mixture was vortexed for 15 seconds followed by centrifugation at 7800 g, 5oC for 30 minutes; then, 600 µL of the upper phase con-taining the purified plasma extract were transferred to a conic glass tube to concentrate to dryness in a water bath at 45oC under a stream of nitrogen and residue obtained was dissolved with a 200 µL mixture of puri-fied water and acetonitrile (92:8, v/v) and 10 µL were injected into LC system.
3.5. Linearity, Calibration Curve and Calculation procedures
Calibration curve was obtained by plotting the peak area ratio obtained for meropenem to its internal stand-ard as a function of drug plasma concentration, nomi-nal values. Linear regression curve was obtained by the equation as follows: y = a + bx, where (x) is the drug
concentration, (y) peak area ratio (a) the intercept and (b) the slope. Calibration curve was accepted for lin-ear correlation coefficient estimated (r2>0.99) and sys-tematic error (SE%) lower than 15% for all standards,
with exception to the lower limit of quantifications (LOQ: SE<20%). The parameter can be estimated by the value of the mean back-calculated concentrations divided by theoretical concentrations, expressed as percentage. Additionally, at least six calibrators were considered for the construction of the daily calibration curve 0.2-50.0 µg/mL, and the day curve was accepted, if at least 4/6 of the internal controls (high, medium and low concentrations analysed in duplicate) presenting systematic error lower than 15%. At least one control of each concentration should be within the acceptable variation. Once accepted, the calibration curve was ap-plied to estimate drug plasma concentration in plasma samples collected from the patient. Linearity of the bioanalytical method was determined in triplicate for each concentration ranging from 0.2 to 50.0 µg/mL.
3.6. Accuracy, Precision and Recovery
Precision of the bioanalytical method is the degree of agreement among individual tests, when the procedure is applied repeatedly to analyse multiple replicates in three different concentrations. Data were expressed as coefficient of variation, as percentage (CV %)
calculat-ed by the equation as follows: CV = SD / Average drug concentration.
Intra-day precision was evaluated by analysis of three replicates for the high (40 µg/mL), medium (20 µg/mL) and low (0.6 µg/mL) concentrations. The inter-day
precision was determined by the analysis of three rep-licates for the high, medium and low concentrations of meropenem in three different days (n=27).
Accuracy was evaluated in three different concentra-tions by analysis of triplicates and can be expressed as percentage of inaccuracy; it can also be expressed as systematic error, representing the recovery of each drug/assay. The parameter can be estimated by the val-ue of the mean back-calculated concentrations divided by theoretical concentrations, expressed as percent-age. The intra-day accuracy was evaluated by analysis of three replicates of the high (40 µg/mL), medium (20 µg/mL) and low (0.6 µg/mL) concentrations. The inter-day accuracy was determined by the analysis of three replicates of the high, medium and low concen-trations of meropenem in three different days (n=27). Absolute recovery for meropenem and also for the in-ternal standard from plasma, expressed as percentage, was estimated by the peak area integrated for each drug (10 replicates, each) in plasma assayed accordingly to the procedure versus the peak area integrated for each
drug after direct injection, considering the same nomi-nal drug concentration. The efficiency of relative re-covery was estimated by the peak area ratio integrated for the analyte and its internal standard (10 replicates), assayed according to the procedure versus the peak area
ratio integrated for the drug and its internal standard after direct injection.
3.7. Specificity
The specificity of the bioanalytical method, the abil-ity to measure accurately an analyte in the presence of endogenous compounds, was evaluated by the analysis of samples drug-free plasma (normal, haemolysed and lipemic plasma samples) by applying the procedure; retention times of endogenous compounds were com-pared with those obtained for meropenem and the in-ternal standard in normal plasma extract.
3.8. Limit of Detection and Limit of Quantification
The limits of detection (LOD) and quantification (LOQ) were determined based on the analysis of ten replicates for each parameter considered. The LOQ was defined as the lowest drug plasma concentration of the calibration daily curve which can be determined with an accuracy of 80-120% and precision lower than 20%.
3.9. Stability Study
Spiked blank plasma were analysed after three freez-ing/thawing cycles by LC considering three different concentrations (0.6, 20, 40 µg/mL) analysed in tripli-cate by applying the analytical procedure as detailed
above. Data were expressed by the systematic error as percentage. The acceptance criterion for all concentra-tions studied adopted was lower than 15% variation expressed by the systematic error.
4. Results
4.1. Experimental
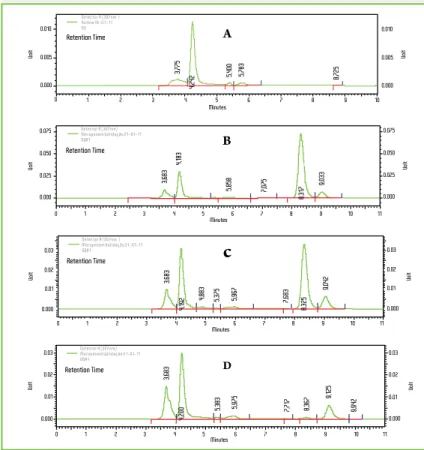
Peaks monitored at 307 nm were eluted at 8.3 min and 9.0 min, respectively for meropenem and cefepime (in-ternal standard). Total time required for each chroma-tographic run was 10 minutes, to guarantee the selec-tivity and specificity; chromatograms are presented in Figure 1. The specificity of bioanalytical method was guaranteed, once endogenous compounds were eluted up to three minutes of chromatographic run; conse-quently, no peaks were co-eluted with the analite or its internal standard in the analytical run.
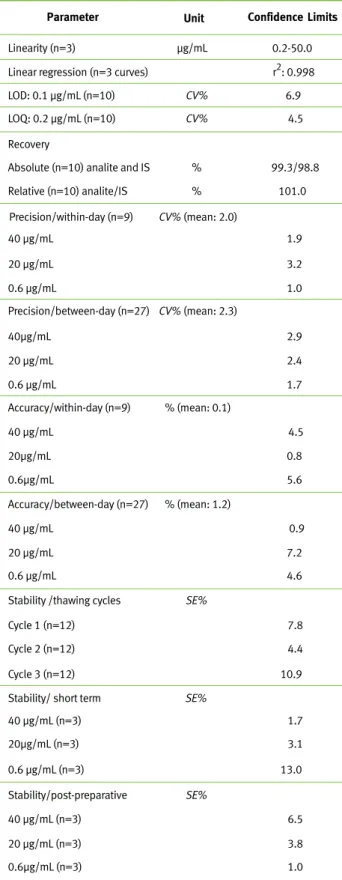
Validated method parameters for the quantification of meropenem in plasma, according to FDA guidance10
were shown on Table 1.
Concerning bioanalytical method, linearity was de-termined in the range 0.2-50.0 µg/mL, data were expressed by the intercept and also the slope of the linear function as mean, standard error of the mean (SEM) and the linear correlation coefficient (r2) as
follows: intercept 0.0847 (SEM: 0.00393), slope 0.1060 (SEM: 0.0029) and r2: 0.998. Based on plasma
analysis (200 µL) in 10 replicates, the limit of detec-tion was 0.1 µg/mL and the lower limit of quantifica-tion was 0.2µg/mL.
Bioanalytical method showed good sensitivity, ab-solute and relative recoveries, linearity and stability, with acceptable accuracy and precision (Table 1). Ad-ditionally, good drug plasma stability on the bench and after three consecutive thawing/freezing cycles was demonstrated; in addition, the post processing stability was guaranteed at room temperature up to 24 hours for purified extracts on the rack of autosam-pler (Table 1).
4.2. Therapeutic Drug Monitoring
Figure 1 - Chromatographic profile of meropenem in plasma purified extract, run time 11 min
(A): Blank plasma; (B): High drug concentration (40.0 µg/mL) plus cefepime (IS); (C) Me-dium drug concentration (20.0 µg/mL) plus IS; (D) Low drug concentration (0.6 µg/mL) plus IS. Retention times obtained were 8.3 min for meropenem and 9.0 min for cefepime (IS).
3,683 4,183 5,858 7,075 9,033 0.010 0.005 0.000 Volt Retention Time Detector A (307nm ) Rotina 10-0 1-11 00 0 1 2 3 4 5 6 7 8 9 10 0.010 0.005 0.000 Volt 3,775 4,242 5,400 5,783 8,725 A Volt 0.000 0.025 0.050 0.075 Volt Retention Time Detector A (307nm) Meropenem Validação 21-01-11 OQA1 1 2 3 4 5 6 7 8 9 10 0 11 0.000 0.025 0.050 0.075 Minutes Minutes B 0.000 0.01 Volt 0.02 0.03 Retention Time Detector A (307nm ) Meropenem Validação 21-01-11 OQA1 0.000 0.01 Volt 0.02 0.03 1 2 3 4 5 6 7 8 9 10 0 11 Minutes Retention Time Detector A (307nm) Meropenem Validação 21-01-11 OQA1 3,683 4,192 4,883 5,375 5,967 7,683 8,325 9,042 3,683 0.000 0.01 Volt 0.02 0.03 0.000 0.01 Volt 0.02 0.03 4,200 5,383 5,975 7,717 8,367 9,125 9,942 1 2 3 4 5 6 7 8 9 10 0 11 Minutes
c
D 8,317Meropenem plasma monitoring was per-formed for the paediatric patient in a pe-riod over 15 days in the ICU (30th day and
44th day of the thermal injury). When in
sepsis, he has received on 30th day
van-comycin (67 mg/kg a day, one hour infu-sion) plus meropenem 75 mg/kg (2.25 g daily, 0.75 g 8qh, 0.5h infusion). On 44th
day, patient was receiving the antimicro-bial therapy consisting of vancomycin (2 g a day/0.5 g 6qh) plus meropenem (100mg/kg, 3 g a day, 1 g 8qh, 0.5h in-fusion), polymixin B 500000 UI 8qh and fluconazole 13 mg/kg (400 mg daily/200 mg 12qh, one hour infusion). Low drug plasma concentration was obtained on 5th day of meropenem
ther-apy (trough: 0.3 µg/mL on 30th day of
hospitalization, serum creatinine/Scr 0.25 mg%, serum urea 16 mg%, white blood cells/WBC 6320 cels/mm3), while
on 19th day of treatment, drug plasma
level at the trough was 14µg/mL (44th
day/ICU, Scr 0.73 mg%, urea 51mg%, WBC 12630 cels/mm3).
Pharmacokinetics of meropenem was in-vestigated in both periods of the study; estimated data on 30th day and also on
44th day for the patient in the ICU were
described on table 2, considering the range reported previously3.
12
Table 2 - Pharmacokinetics of Meropenem in one burn child, 0.5 hour intravenous infusion 0.75 g or 1.0 g 8qh in two different periods in the ICU
Day PK - Parameters 30th 0.3 1.3 6.4 0.7 Trough µg/mL Half-life (h) Plasma clearance (mL/min.kg) Volume of distribution (L/kg) 44th 14.0 3.3 1.7 0.5 Reference3 1.3-3.5 1.6-3.4 1.49-2.45 0.23-0.43
Drug efficacy was evaluated by the PK-PD correla-tion reported previously3,7,13. If drug plasma
concen-tration was maintained above the MIC at the time interval (fT>MIC), expressed as percentage,
mero-penem effectiveness is guaranteed at 40%fT>MIC.
PK-PD modelling was investigated for the paediatric patient in the ICU on 30th day versus 44th day and estimated data for the predictive index fT>MIC were
described on table 3.
Since MIC of pathogens aren’t measured as part of routine clinical practice, data obtained in the present study were based on in vitro microbial susceptibility
reported in EUCAST (MIC: 0.5 mg/L, 2 mg/L and 8 mg/L). Meropenem effectiveness against patho-gens as Staphylococcus aureus, Streptococcus pneumoniae
(MIC: 0.5 mg/L), Acinetobacter spp., Pseudomonas
aeru-Table 3 - PK-PD Parameter %fT>MIC in one burn child in two different periods in the ICU
Target: 40%fT>MIC3,7
Dosage MIC: 0.5 µg/mL MIC: 2.0 µg/mL MIC: 8.0 µg/mL
0.75 g 8qh 88 55 23
1 g 8qh 100 100 100
MIC: minimum inhibitory concentration;fT>MIC: percentage of the dosing interval that free drug concentrations remain above the MIC.
Table 1 - Confidence limits of bioanalytical method for Meropenem plasma measurements
Parameter
Linearity (n=3) µg/mL 0.2-50.0
Unit Confidence Limits
Linear regression (n=3 curves) r2: 0.998 LOD: 0.1 µg/mL (n=10) CV% 6.9 LOQ: 0.2 µg/mL (n=10) CV% 4.5 Recovery
Absolute (n=10) analite and IS % 99.3/98.8 Relative (n=10) analite/IS % 101.0 Precision/within-day (n=9) CV% (mean: 2.0) 40 µg/mL 1.9 20 µg/mL 3.2 0.6 µg/mL 1.0 Precision/between-day (n=27) CV% (mean: 2.3) 40µg/mL 2.9 20 µg/mL 2.4 0.6 µg/mL 1.7 Accuracy/within-day (n=9) % (mean: 0.1) 40 µg/mL 4.5 20µg/mL 0.8 Accuracy/between-day (n=27) 40 µg/mL 0.9 20 µg/mL 7.2 0.6 µg/mL 4.6 Stability /thawing cycles
Cycle 1 (n=12) 7.8 Cycle 2 (n=12) 4.4 Cycle 3 (n=12) 10.9 Stability/ short term SE%
40 µg/mL (n=3) 1.7 20µg/mL (n=3) 3.1 Stability/post-preparative 40 µg/mL (n=3) 6.5 20 µg/mL (n=3) 3.8 0.6µg/mL (n=3) 1.0 0.6µg/mL 5.6 % (mean: 1.2) SE% SE%
Abbreviations: coefficient of variation (CV%), standard deviation of mean (SD), systematic error (SE%), Internal standard (IS), LOD: limit of detec-tion; LOQ: limit of quantification.
0.6 µg/mL (n=3) 13.0
13
ginosa (MIC: 2 mg/L) and Enterococcus faecium, Ente-rococcus faecalis (MIC: 8 mg/L) was obtained only on
44th day of hospitalization by increasing of the daily dose12.
5. Discussion
In general blood sampling for laboratory measure-ments is a limiting factor for drug plasma monitoring mainly in children, consequently lower volumes of blood samples required would be an additional ad-vantage for drug plasma measurements in paediatric patients.
Several drug measurements for meropenem in bio-logical matrices were reported previously by ap-plication of several techniques as microbiological9,
RIA14, chromatographic methods as LC-UV15-18,20-23
and LC- MS/MS1,24. On the other hand, concerning
drug plasma assay for meropenem dose adjustment, LC-UV was preferred for the routine plasma meas-urements by its relative low cost compared to LC-MS/MS or capillary electrophoresis.
Purification procedure is always required prior to measurements by LC-UV proteins extraction14,15,19-22.
Since meropenem has a hydrophilic molecule, the precipitation of plasma proteins was chosen in the present study, by cost compared to the solid-phase extraction14,15,21,22.
Acetonitrile was preferred to methanol for the pre-cipitation of plasma proteins1,19,20, once a better
qual-ity of purified plasma extracts was obtained for the chromatographic analysis.
Validation parameters for the bioanalytical method reported in the present study were based on Good Laboratory Practices, international guidelines10. High
sensitivity for plasma meropenem measurements was obtained in the study as a consequence of high drug recovery, an essential factor for drug analyses in small plasma volumes that obviously contributes for the reduction of volume in blood sampling.
Related to linearity of LC-UV focusing dose adjust-ment (0.2 - 50.0 µg/mL) data obtained in the present study showed superiority by comparison to those reported previously15,17,18,20,22,23. Also, the
selectiv-ity and specificselectiv-ity for meropenem measurements in plasma extracts was guaranteed at 307 nm for the de-tection of the analite17,22,23.
Chromatographic analysis for drug assay was per-formed on a ODS reversed phase column at a low flow rate of binary mobile phase pumped isocratically. Analite and its internal standard peak elutions with better symmetry by using the binary mobile phase consisting of a mixture of acetonitrile and 0.01M pH 5.0 acetate buffer is the main advantage; then the
chro-matographic system described in the present study was superior compared to those reported previously by using 0.01M pH 7.4 phosphate buffer instead the 0.01M pH 5.0 acetate buffer. In addition, a limitation method reported by Ikeda et al. 2007 is concerning to
a low reproducibility of the assay of procedure, once no internal standard was added to plasma samples before the quantification of meropenem16.
Method validated in the present study was applied to therapeutic drug monitoring and PK-PD stud-ies in one burn child. Trough obtained 0.3 µg/mL (2.25 g/daily, Scr 0.25 mg%) increased to 14 µg/mL (3 g/daily, 0.73 mg/%) due to meropenem dose regi-men, but also to increase on drug accumulation oc-curred as indicated by serum creatinine, consequence of renal function decreased overtime. In burns, adult patients, extensive changes on drug kinetic disposi-tion were reported for many drugs including mero-penem1,4,5. On the other hand, changes on drug
elimi-nation overtime as meropenem plasma clearance reduced and biological half life prolonged and also on drug distribution measured by the apparent vol-ume of distribution obtained in the study are accord-ing to pharmacokinetic data reported by Cheatham
et al. 2008 for non burn adult patients with normal
renal function3. It is well known the reduction on
re-nal blood flow which frequently accompanies sepsis was reported previously for burn adult patients who lead to a reduction on plasma clearance1. In addition,
the variability on kinetic parameters obtained in the present study was lower than those reported for Jap-anese non burn children11.
It was reported by Roberts et al. 2009 a comparison of
daily dose of 1.5-6 g by two systemic administration (bolus versus continuous infusion) for non burn
pa-tients with sepsis; authors suggested that adminis-tration of higher doses by bolus or venous continuous infusion were required to replace drug elimination23.
Additionally, 10-40 mg/kg dose regimen, 0.5 hour in-fusion every 8 hours provide sufficient meropenem exposures in non burn patients7,11.
Drug efficacy based on PK-PD correlation showed meropenem plasma concentration 40% of the time above the MIC of 0.5 mg/L, 2.0 mg/L and 8.0 mg/L for daily dose of 1g every 8 hours. Data obtained the present study are according to those reported by oth-er authors3,7,13.
Controversially, therapeutic failure was reported by Hallam et al. 2010, once 30%fT>MIC (MIC: 4 mg/L
breakpoint) was obtained for one adult burn patient (TBSA 52%) receiving 3 g/day (1 g, 8/8hs). Then, after the adjustment to 6 g (1 g 4qh) effectiveness was reached (75%fT>MIC)25. On the other hand,
14
considering the present study, dose higher than reported for non burns was required to maintain meropenem effectiveness in burns. Initially, when 75 mg/kg.day was administered 0.5 hour infusion (2.25 g daily: 0.75 g 8qh) to the burn child, effective-ness was reached at 88%fT>MIC for all susceptible
strains (MIC<0.5 mg/L) and also for less suscepti-ble strains 55%fT>MIC (MIC: 2 mg/L), but
thera-peutic fail was registered for strains MIC: 8 mg/L, once 23%fT> MIC was obtained and consequently
the predictive index of drug efficacy wasn’t reached. Dose adjustment by increases on daily dose to 100 mg/kg (3 g/day: 1g every 8 hrs) provided effec-tiveness of meropenem related 100%fT>MIC for all
strains (MIC< 8 mg/L).
High meropenem plasma concentration indicates that dose adjustment will be required to avoid the adverse effects as seizure crisis related to the larger area under the curve at time dose intervals and to pre-vent the risk to burn patients especially in paediatric patients. Fluid compartments are unpredictable in burns and change faster over time during the follow up of patients in the ICU. Then, if low meropenem plasma concentration occurs, the daily dose must be increased and a new dose regimen must be planned as soon as possible to avoid therapeutic fail and drug resistance development26.
6. Conclusion
The bioanalytical method validated for meropenem plasma measurements by LC presented several ad-vantages as simplicity, rapidity, specificity and selec-tivity, and requires a low plasma volume with accept-able confidence limits related to linearity, sensitivity and stability for drug plasma assay. The method was appropriate to drug plasma measurements focusing guaranteed efficacy for the treatment of severe burn paediatric patient presenting documented pulmo-nary infection. Finally, pharmacokinetics was altered in a different manner on 5th day and on 19th day of
treatment and meropenem effectiveness for the pa-tient in the ICU was reached when the dose regimen of 1 g 8qh was chosen instead 0.75 g trice daily.
7. Bibliographical References
1. Doh K, Woo H, Hur J, Yim H, Kim J, Chae H, Han S, Yim DS. Population pharmacokinetics of meropenem in burn patients. J Antimicrob Chemother. 2010;65(11):2428-35.
2. Bax RP, Bastain W, Featherstone A, Wilkinson DM, Hutchi-son M, Haworth SJ. The pharmacokinetics of meropenem in vo-lunteers. J Antimicrob Chemother. 1989;24(Suppl A):311-20. 3. Cheatham SC, Kays MB, Smith DW, Wack MF, Sowinski
KM. Steady-state pharmacokinetics and pharmacodynamics of meropenem in hospitalized patients. Pharmacotherapy. 2008;28(6):691-8.
4. Blanchet B, Jullien V, Vinsonneau C, Tod M. Influence of Burns on Pharmacokinetics and Pharmacodynamics of Drugs Used in the Care of Burn Patients. Clin Pharmacokinet. 2008;47(10):635-654. 5. Weinbren MJ. Pharmacokinetics of antibiotics in burn pa-tients. J Antimicrob Chemother. 1999;44(3):319-27.
6. Fry DE. The importance of antibiotic pharmacokinetics in cri-tical illness. Am J Surg. 1996;172(6A):20S-25S.
7. Ikawa K, Morikawa N, Ikeda K, Miki M, Kobayashi M. Po-pulation pharmacokinetics and pharmacodynamics of me-ropenem in Japanese pediatric patients. J Infect Chemother. 2010;16(2):139-43.
8. Taniguchi S, Hamase K, Kinoshita A, Zaitsu K. Simple and rapid analytical method for carbapenems using capilla-ry zone electrophoresis. J Chromatogr B Biomed Sci Appl. 1999;727(1-2);219-25.
9. Al-Meshal MA, Ramadan MA, Lotfi KM, Shibl AM. Deter-mination of meropenem in plasma by high-performance liquid chromatography and a microbiological method. J Clin Pharm Ther. 1995;20(3):159-63.
10. FDA. Guidance for Industry: Bioanalytical Method Validation. US Department of Health and Human Services, Food and Drug Administration, Center for Drug Evaluation and Research; 2001. 11. Du X, Li C, Kuti JL, Nightingale CH, Nicolau DP. Population Pharmacokinetics and Pharmacodynamics of Meropenem in Pe-diatric Patients. J Clin Pharmacol. 2006;46:69-75.
12. EUCAST – European Committee of antimicrobial suscepti-bility testing. MIC distribution. www.eucast.org/mic_distribu-tions [assessed in 15/02/2011].
13. Ikawa K, Morikawa N, Ikeda K, Ohge H, Sueda T. Develo-pment of breakpoints of carbapenems for intraabdominal infec-tions based on pharmacokinetics and pharmacodynamics in pe-ritoneal fluid. J Infect Chemother. 2008;14(4):330-2.
14. Leroy A, Fillastre JP, Borsa-Leas F, Etienne I, Humbert G. Pharmacokinetics of meropenem (ICI 194,660) and its meta-bolite (ICI 213,689) in healthy subjects and in patients with renal impairment. Antimicrobial Agents and Chemotherapy. 1992;36(12), 2794-2798.
15. Denooz R, Charlier C. Simultaneous determination of 5b-lactam antibiotics in human plasma by high performance liquid chromatography with ultraviolet detection. Journal of Chromatography B. 2008;864:161-167.
16. Ikeda K, Ikawa K, Morikawa N, Miki M, Nishimura SI, Ko-bayashi M. High-performance liquid chromatography with ultraviolet detection for real-time therapeutic drug monito-ring of meropenem in plasma. Journal of Chromatography B. 2007;856:371-375.
17. Ip M, Au C, Cheung W, Chan CY, Cheng AFB. A rapid high-performance liquid chromotographic assay for cefepime, cefpi-rome and meropenem. Journal of Antimicrobial Chemotherapy. 1998;42:121-123.
15 18. Kurihara Y, Kizu J, Hori S. Simple and rapid determination
of serum carbapenem concentrations by high-performance liquid chromatography. J Infect Chemother. 2008;14:30-34.
19. Legrand T, Chhun S, Rey E, Blanchet B , Zahar JR, Lanternier F, Pons G, Jullien V. Simultaneous determination of three carba-penem antibiotics in plasma by HPLC with ultraviolet detection. Journal of Chromatography B. 2008;875:551–556.
20. McWhinney BC, Wallis SC, Hillister T, Roberts JA, Lipman J, Ungerera JPJ. Analysis of 12 beta-lactam antibiotics in human plasma by HPLC with ultraviolet detection. Journal of Chroma-tography B. 2010;878:2039-2043.
21. Musson DG, Birk KL, Cairns AM, Majumdar AK, Rogers JD. High-performance liquid chromatographic methods for the de-termination of a new carbapenem antibiotic, L-749,345, in human plasma and urine. Journal of Chromatography B. 1998;720:99-106. 22. Robatel C, Buclin T, Eckert P, Schaller MD, Biollaz J, Decos-terd LA. Determination of meropenem in plasma and filtrate-dialysate from patients under continuous veno-venous haemodia-filtration by SPE-LC. Journal of Pharmaceutical and Biomedical Analysis. 2002;29:17-33.
23. Roberts JA, Kirkpatrick CMJ, Roberts MS, Robertson TA, Dalley AJ, Lipman J. Meropenem dosing in critically ill patients with sepsis and without renal dysfunction: intermittent bolus versus continuous administration? Monte Carlo dosing simula-tions and subcutaneous tissue distribution. J Antimicrob Che-mother. 2009;64:142-150.
24. Koal T, Deters M, Resch K, Kaever V. Quantification of the carbapenem antibiotic ertapenem in human plasma by a valida-ted liquid chromatography-mass spectrometry method. Clinica Chimica Acta. 2006;364:239-245.
25. Hallam MJ, Allen JM James SE, Donaldson PMW, Davies JG, Hanloh GW, Dheansa BS. Potential Subtherapeutic Line-zolid and Meropenem Antibiotic Concentrations in a Patient With Severe Burns and Sepsis. Journal of Burn Care & Research. 2010;31(1):207-209.
26. Linden P. Safety Profile of Meropenem: An Updated Review of Over 6000 Patients Treated with Meropenem. Drug Safety. 2007;30(8):657-668.
Acknowledgements
This work was supported by Foundation for Research State Sao Paulo FAPESP. Authors are grateful to Mrs. Adriana Maria dos Santos for the technical laboratory support in drug plasma pu-rification assays.