Dependency Graphs
Nuno Pereira
1, Maria João Varanda Pereira
2, and Pedro Rangel
Henriques
11 Centro de Ciência e Tecnologia da Computação (CCTC) Departamento de Informática, Universidade do Minho Braga, Portugal
{nuno.filipe.gomes.pereira,pedrorangelhenriques}@gmail.com
2 Centro de Ciência e Tecnologia da Computação (CCTC) Departamento de Informática e Comunicações,
Instituto Politécnico de Bragança Bragança, Portugal
Abstract
Software maintenance is one of the most expensive phases of software development and under-standing a program is one of the most important tasks of software maintenance. Before making the change to the program, software engineers need to find the location, or locations, where the changes will be made, they need to understand the program. Real applications are huge, some-times old, were written by other person and it is difficult to find the location of the instructions related to a specific problem domain concept.
There are various techniques to find these locations minimizing the time spent, but this stage of software development continues to be one of the most expensive and longer. The concept location is a crucial task for program understanding.
This paper presents a project whose main objective is to explore and combine two Program Comprehension techniques: visualization of the system dependency graph and concept location over source code comments. The idea is to merge both features in order to perform concept location in system dependency graphs. More than locate a set ofhot instructions (based on the associated comments) it will allow to detect the other instructions (the whole method).
1998 ACM Subject Classification D.2.7 Maintenance
Keywords and phrases program comprehension; concept location; comment analysis; system dependency graph
Digital Object Identifier 10.4230/OASIcs.SLATE.2014.0
1
Introduction
It is known that the software maintenance task is the most expensive phase of software development: 80% to 90% of the overall costs [5]. According to [6] we conclude that half the time spent in software maintenance is used to understand the program code and the instructions that have to be changed. We are aware that this task would be easier when a model driven software development is used [10] but this is not the most usual case.
different forms of thinking. Moreover the variable and method names in the source code may not be explicit and usually the program does not have good documentation.
There are various techniques to find these locations minimizing the time spent searching but the most used techniques consists in navigating through the statements dependencies or search for keywords that can indicate where the concept is implemented.
According to Kernighan and Plauger [7], the best documentation for a program includes comments; software engineers make a lot (and relevant) comments in the source code [12]. About 19% of the source code are comments. Comments can explain source code in a natural language connecting the program domain with the problem domain [1]. Aware of that, software engineers search for certain keywords in the code (related to the change that will be made) that can indicate the location, or locations, where the software engineer needs to modify source code.
Static dependency search consists in navigating through the dependencies among elements. Software engineers usually begin at the main function and follow a specific path in order to find the desired concept implementation. If the search is not successful, they must backtrack to the previous point (e.g., class, method or conditional structure) and choose a different path.
For all these reasons it becomes clear that it is challenging and useful to create a tool with a friendly interface that allows to perform concept location over a System Dependency Graph (SDG). The main idea is to visualize a dependency graph (control flow and data dependencies) and locate the nodes that can be related to a given term.
The term to search usually belongs to the problem domain and the related nodes are identified through the source code comments associated to each node/statement. To detect the comments that are related to a given term/concept a tool called Darius is used. Darius, which was developed in the context of our research group by Freitas [3], is based on natural language techniques applied to the comment words; it also produces a set of statistics concerning those comments. The System Dependency Graph is automatically generated from the software package.
The final objective of the tool, DariusSDG, proposed in this paper, is to decrease the time spent to locate concepts in source code in order to reduce the cost of maintenance tasks.
The paper will have four more sections. In Section 2 are discussed the area of Program Comprehension: some concepts, definitions and techniques which are fundamental to this work. Section 3 describes the tool architecture. The methodology and all the work related to the construction of the tool will be described in Section 4, which is divided in three subsections:
Comments Analysis: where Darius will be introduced.
System Dependency Graph (SDG): this subsection will describe in more detail this technique along with a tool that help building the graph.
Integration: this subsection will describe the proposed DariusSDG that integrates the tool that builds the SDG with the tool that analyses source code comments (Darius) as well as other new features.
This document ends in Section 5 where conclusions and future work are described.
2
Contextualization: Program Comprehension
Program Comprehension [13] is a component of Software Engineering discipline whose principal purpose is to study how software engineers understand programs.
Every software engineer has its own way to understand a program, to capture information from the source code [14]. To help him on this task there are several tools that can be used to explore the source code. The choice depends on the needs of the user: static or dynamic source code analysis, use of visualizations or textual information to show the results and so on. Moreover, almost tools are programming language dependent and some of them adopt invasive approaches that modify the source code with code inspection instructions [2].
Understanding a program depends on the knowledge the software engineers has about the program that is being analysed, on his experience and on his knowledge about the real world problem that the program solves. These two concepts,real world problem andhow it is solved in a programming language, are known in Program Comprehension as: Problem Domain and Program Domain.
We can see Problem Domain as the concepts related to the problem, the relations between them and how the problem can be solved. For instance, if a teacher needs to manage a school class there are various concepts related to that problem likestudents,grades,faults,
summariesand so on. In a similar way there are various tasks to be accomplished like adding a summary, register the grades of the students, register the information about the students.
Program Domain is concerned with the programming language and with the implement-ation techniques used to solve the problem in a computer. Taking the example above, we can say that in Program Domain the concern is what data structures will be used to store the information (an array?), how the information about the grades will be implemented (as attribute of the school class or the student?) among others.
The time spent understanding a program also depends on the program that is being analysed: how it was created, how it is being maintained, in which programming language is written. The changes that should be implemented also have a strong influence in the effort and time required for program comprehension. When a software engineer analyses a program he constructs a Mental Model [14] of the program, which is updated when new information are collected.
The software engineer needs to know the flow of the program, which methods are called, by who, what these methods do, the data dependencies and the effect a change may cause. As said before, programs tend to be huge (many lines of code, many methods and many files) and it causes to be unworkable the task of knowing all these details about the program by hand. Every time a change need to be made in the program the software engineer need to navigate in the methods and discover the location where the change will take place. This is an enormous waste of time. The System Dependency Graph [8] is a visual artefact, used by program comprehension researchers, that shows all the static dependencies of a program in the form of a graph. Software engineers can see the flow of the program and data dependencies in a very easy and intuitive way.
From the text (comments, variable names, method names, constant Strings) in the program software engineers can obtain various kinds of semantic information about a program. If a method is called “return_average_grade” it is almost certain what the method returns. There are many techniques of Information Retrieval that can be used to retract important information about a program. The software engineer can search for certain keywords and the system retrieves this information (associated whit other important information like the file, the method or the line where the information was located).
3
DariusSDG: Architecture
As mentioned before the objective of DariusSDG, the tool proposed in this paper, is join two technique of program comprehension reducing the time spent to understand a program. To achieve this goal DariusSDG will be composed of three main components (that will be described in more detail in the next section):
Darius: A comment analyser tool
SDG API: A tool to extract flow and data dependency graphs from a program JGraphX: A tool that can be used to draw graphs
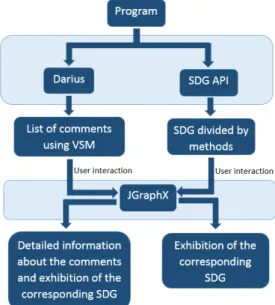
In Figure 1 we can see the diagram that depicts the tool architecture, its structure, components and connections among them. From this diagram it is possible to understand the steps that are taken by the tool to build the result, which is the construction of the System Dependency Graph and the mapping of the extracted information from source code comments with the nodes of the graph. The tool receives a program as input and uses the SDG API to build the System Dependency Graph of the program. As mentioned in Figure 1 the SDG is divided in methods allowing to have big programs as input. The input program will be also analysed by Darius, constructing a list of comments based on Vector Space Model (VSM) technique. The final result is a conjugation of the outputs of Darius and SDG API in
a form of a graph, using JGraphX.
Figure 1Architecture of DariusSDG.
4
DariusSDG: Development
This section is divided in three subsections where will be described the tools and the steps used to build DariusSDG.
4.1
Comments Analysis
Comments in the code are one of the most important source of information about the program. It is one of the best ways to understand what the software engineer was thinking and how
the Problem Domain and Program Domain were related. Studies [17, 15] conclude that programs that have more comments are more easily understandable by software engineers.
To extract and search information in the comments we need to use Information Retrieval techniques. As we can see in [11], an Information Retrieval System analyses several documents processing its text with the assistance of some tools like:
Sentence tokenizer Separates the text into sentences. Word tokenizer Separates the sentences into words. Stemming Reduce the word to its grammatical root.
Elimination Eliminates words that do not have significance or value.
After the system complete all the tasks the user only needs to insert the query (set of keywords) to execute. The system perform the same process mentioned before in the query, to assure consistence, and retrieves a set of documents that satisfy the search ranking them by relevance.
There are various algorithms designed to rank documents, however in our work we will be concerned mainly with Vector Space Model [18] (that is used by Darius).
Darius, built by José Luís Freitas, in his master work [3] at our research group, uses several techniques of Information Retrieval to analyse the various types (inline, singleline, multiline and Javadoc) of comments presented in the source code.
The lack of available tools that can perform these actions, the quality of the tool and the fact that José Luís provided its source code were the reasons to choose Darius.
Darius is composed by four main modules: a comment extractor; a statistic calculator; a word analyser and a concept locator. As mentioned before, Vector Space Model is one of the most used algorithms to rank documents and it is used by Darius. There are many algorithms to calculate the weight of a word like the frequency of the word in the document but the one adopted is the Term Frequency - Inverse Document Frequency.
4.2
System Dependency Graph
The System Dependency Graph [8] is a visual artefact representing the static dependencies of a program as a graph. The System Dependency Graph (SDG) is composed of two components: the Control Flow Graph (CFG) and the Data Dependency Graph [4] (DDG).
CFG shows all the dependencies and calls between methods. It shows all the statements of the program and how they are related. If a statement B is called by a statement A, statement B is connected to statement A and it is positioned one level above statement A. Just looking to the CFG, a software engineer can see the flow of the program and discover in which class, method and statement, he will do the change (when a maintenance is needed). DDG shows where the variables in the code are changed (variable dependencies). As in CFG, when a variable is changed in one statement it is connected to that statement showing that there is a dependency between them.
As mentioned above, when joined, these two graphs form the System Dependency Graph. A graph where the software engineers can see all the static dependencies and workflow of the program in a very easy and intuitive way.
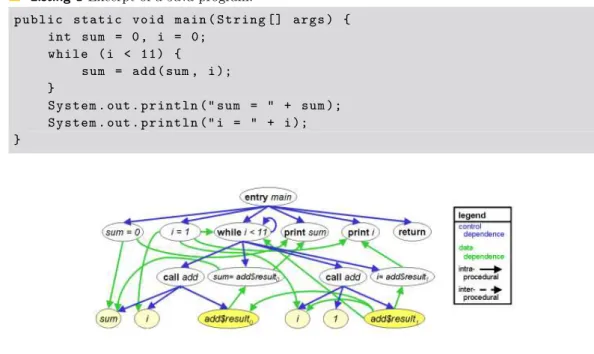
In Figure 2 we can see the System Dependency Graph of the source code in Listing 1 (example extracted from [16]).
Listing 1Excerpt of a Java program.
public static void main ( String [] args ) { int sum = 0 , i = 0;
while ( i < 11) { sum = add ( sum , i ); }
System . out . println (" sum = " + sum ); System . out . println (" i = " + i ); }
Figure 2A System Dependency Graph.
The Java System Dependence Graph API [16], as the name indicates, is a tool that constructs the SDG of a program and provides methods to access it. The tool provides methods to navigate throw the nodes using algorithms like the Breadth First Search. We choose this tool because it is simple to use (does not need configurations or databases), it is open source and after some tests we have confirmed that the tool does what it compromises.
4.3
Integration
As mentioned before, DariusSDG is a combination between tools (Darius, JGraphX and SDG API). These tools were built independently and not with the purpose of being joined, therefore there is some adjustments to be made.
As said above, SDG is an important and useful tool due to its graphical representation. The System Dependence Graph API only offers methods to access the different nodes and connections between them (edges) in a text representation. On account of that, it is necessary a tool to build the graphical representation of the SDG. JGraphX [9] is a Java Swing library that provides functionality for visualisation and interaction with graphs. It offers many methods to construct the graph, change the colour of the nodes or the edges and can order the graph in a hierarchical form (which is the typical form of a System Dependency Graph). By combining these two tools it is possible to build a System Dependency Graph of any Java program.
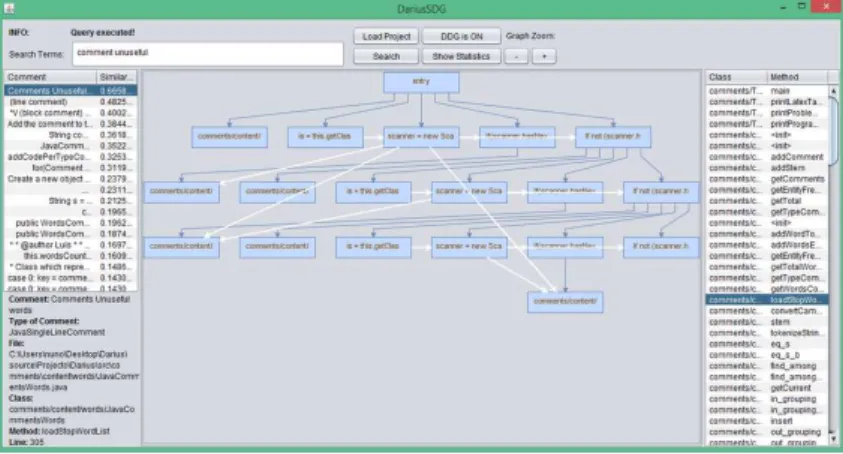
As the SDG of a program can be very huge, hindering the work of the software engineer instead of helping, DariusSDG provides the System Dependency Graph divide by methods. As we can see in Figure 3 DariusSDG provides a list (on the right) of all methods used by the program and the name of the class they belong. By clicking on the method the corresponding part of the System Dependency Graph is shown on the centre of the window.
As mentioned before, DariusSDG show the SDG divided by methods, decreasing the size
of the graph shown, but, if the method has many instructions and dependencies it can be a little confuse. DariusSDG has some options to help the software engineer, for example the Data Dependency edges can be hidden; it is possible zoom in or zoom out in the graph; or drag the nodes changing its original position.
Figure 3DariusSDG GUI.
Darius retrieves a list of comments ordered by similarity according to the list of searched terms. Each comment has associated the comment itself, the file where it is located, the type of comment (inline, singleline, multiline and Javadoc) and the line after the comment. We decided to follow the same logic and return the method associated with the comment (if exists) and the line where the comment start.
When the software engineer searches for terms a list of comments is presented and its similarity with the searched terms on the left side of the window (see Figure 3). These comments are ordered by similarity and if the user clicks in one of them DariusSDG shows the information associated with the comment and the part of the System Dependency Graph associated with the respective method. The list in the right automatically changes the selected row to the row that corresponds with the graph that is being shown.
5
Conclusion
As mentioned along this paper, software maintenance is one of the most expensive parts of software development, and the time spent by software engineers to understand the program (an compulsory but unproductive phase) is the main reason for that.
Program Comprehension researchers studied and develop many techniques and tools to decrease the time spent to understand a program, but software maintenance still a very demanding task. The number of tools found, for the Java programming language, which can assist software engineers in program comprehension, is small and focused in one technique of program comprehension.
programs and software engineers, to verify if the time spent using the tool is smaller than without the tool.
Acknowledgements This work is funded by National Funds through the FCT - Fundação para a Ciência e a Tecnologia (Portuguese Foundation for Science and Technology) within project PEst-OE/EEI/UI0752/2014.
References
1 Ruven E. Brooks. Using a behavioral theory of program comprehension in software en-gineering. In Maurice V. Wilkes, Laszlo A. Belady, Y. H. Su, Harry Hayman, and Philip H. Enslow Jr., editors,ICSE, pages 196–201. IEEE Computer Society, 1978.
2 Daniela da Cruz, Mario Béron, Pedro Rangel Henriques, and Maria João Varanda Pereira. Code inspection approaches for program visualization. Acta Electrotechnica et Informatica, 9(3):32–42, Jul-Sep 2009. ISSN: 1335-8243.
3 José Luís Figueiredo de Freitas. Comment analysis for program comprehension. Master’s thesis, University of Minho, 2011.
4 Lin Du, Guorong Xiao, and Daming Li. A novel approach to construct object-oriented system dependence graph and algorithm design. JSW, 7(1):133–140, 2012.
5 L. Erlikh. Leveraging legacy system dollars for e-business. InIT Professional, volume 2. IEEE Computer Society, 2000.
6 R. K. Fjeldstad and W. T. Hamlen. Application program maintenance study: Report to our respondents. InProceedings of GUIDE 48, April 1983.
7 Brian W. Kernighan and P. J. Plauger. The elements of programming style. McGraw-Hill, second edition edition, 1978.
8 Panos E. Livadas and Theodore Johnson. An optimal algorithm for the construction of the system dependence graph. Inf. Sci., 125(1-4):99–131, 2000.
9 JGraph Ltd. JGraphX. https://github.com/jgraph/jgraphx, 2014.
10 I. Luković, S. Ristić, S. Aleksic, and A. Popović. An application of the MDSE principles. InIII Workshop on Model Driven Software Engineering (MDSE 2008), 2008.
11 Christopher D. Manning, Prabhakar Raghavan, and Hinrich Schütze. Introduction to In-formation Retrieval. Cambridge University Press, 2009.
12 I. Stamelos, L. Angelis, A. Oikonomou, and G. L. Bleris. Code quality analysis in open source software development. Information Systems, 12(1):43–60, 2002.
13 Margaret-Anne D. Storey. Theories, methods and tools in program comprehension: Past, present and future. InIWPC, pages 181–191. IEEE Computer Society, 2005.
14 Margaret-Anne D. Storey, F. David Fracchia, and Hausi A. Müller. Cognitive design ele-ments to support the construction of a mental model during software exploration. Journal of Systems and Software, 44(3):171–185, 1999.
15 T. Teny. Procedures and comments vs. the Banker’s algorithm. InSIGCSE Bull, pages 44–53, 1985.
16 Chun Yin TONG, Eric Chi Lik LO, and Ming Hay LUK. Java system dependence graph API. http://www4.comp.polyu.edu.hk/ cscllo/teaching/SDGAPI/, 2010.
17 Scott N. Woodfield, Hubert E. Dunsmore, and Vincent Yun Shen. The effect of modulariz-ation and comments on program comprehension. In Seymour Jeffrey and Leon G. Stucki, editors,ICSE, pages 215–223. IEEE Computer Society, 1981.
18 Wei Zhao, Lu Zhang, Yin Liu, Jiasu Sun, and Fuqing Yang. SNIAFL: towards a static noninteractive approach to feature location.ACM Trans. Softw. Eng. Methodol., 15(2):195– 226, 2006.