Vol.47, n. 4 : pp. 659-667, August 2004
ISSN 1516-8913 Printed in Brazil
BRAZILIAN ARCHIVES OF
BIOLOGY AND TECHNOLOGY
A N I N T E R N A T I O N A L J O U R N A L
Soil Erosion Determination in a Watershed from Northern
Paraná (Brazil) Using
137Cs
Avacir Casanova Andrello
1∗, Carlos Roberto Appoloni
1and Maria de Fátima Guimarães
21
Departamento de Física; CCE; Universidade Estadual de Londrina; 86051990; [email protected]; Londrina -PR - Brazil. 2 Departamento de Agronomia; CCA; Universidade Estadual de Londrina; C. P 6001; 86051-990; Londrina -PR - Brazil
ABSTRACT
The objective of this work was study the soil losses or gains in a watershed in the municipal district of Cambé, Paraná using 137Cs as marker for the determination of soil redistributions. A transect sampling was used to evaluate the influence of different tillage on soil erosion. One point, located in a forest area was sampled and analyzed to determine the reference inventory of cesium-137 deposited by fallout. The average value of the reference inventory was 292 Bq m-2. The cesium-137 inventory of the transect samples varied from 80 Bq m-2 to 403 Bq m-2. The sampling points in pasture presented soil losses. The sampling points in coffee plantation did not present losses or gains. The sampling points in soybean cultivated areas presented soil losses.
Key words: Soil redistribution, radionuclide, red latosol
∗ Author for correspondence
INTRODUCTION
Soil loss by erosion is one of agriculture’s greatest problems in Paraná State (Sorrenson and Montoya, 1989; Kronen, 1990). Although farmers are using soil conservation techniques, more frequently, erosion continues to be an important process in soil degradation (Eltz et al., 1984). Erosion degrades the topsoil, rich in organic matter and plant nutrients, and improves sedimentation reducing the storage of reservoirs.
Conventional erosion determination models (that use plots and are not a good representation of a field) need much data and require much time to determine variables, such as erodibility. These models are applicable only in regions close to experiments, as in the case of RUSLE (Revised Universal Soil Loss Equation) (Renard et al., 1990) and WEQ (Wind Erosion Equation)
benchmark or reference soils are difficult to find in regions with cultivated soil.
The most recent alternative method that has been used for soil erosion estimation is the 137Cs methodology (Ritchie and McHenry, 1990). This methodology has been applied in a wide range of environments in the north hemisphere, but only a few applications in Brazil are know (Guimarães, 1988; Andrello, 1997; Andrello et al, 1998; Bacchi et al, 2000; Guimarães et al, 2003; Andrello et al, 2003). The 137Cs is an artificial radionuclide which was introduced in the environment through surface nuclear tests and deposited as radioactive fallout.
It decays by β
to 137mBa, that is a gamma ray emitter with energy of 661.6 keV and half-life of 2.55 minutes. The 137Cs has a relatively long half-life of 30,2 years and, when in contact with the soil, is rapidly and strongly adsorbed by clay and organic particles. The mobility of the 137Cs in soils depends on the water movement and its interaction with soil components. Many studies have shown that the 137Cs distribution is strongly correlated to clay content (Tamura, 1964; Vlacke and Cremers, 1994) and the fraction of the adsorbed 137Cs increases when clay content increases. Moreover, the 137Cs penetrate the layers of clay minerals and cause them to collapse so that 137Cs became trapped or fixed. Because of this, the physical
processes of erosion, transport and deposition of soil particles and cultivation represent the major causes of 137Cs redistribution in the landscape (Ritchie and McHenry, 1990).
The 137Cs distribution in undisturbed soil profiles shows an exponential decrease with depth, whereas plowed soils show uniform distribution through the plow layer. Studies have reported a relation between soil loss (or gain) and the 137Cs inventory present in the soil. Whenever the 137Cs inventory for an individual sampling point is lower than the 137Cs reference value, erosion is indicated, whereas for a depositional site, the 137Cs inventory will be greater than the reference 137Cs value, except in the case of a non-uniform original deposition.
The objective of this work was to apply the 137Cs methodology for a watershed in the northern Paraná State (Brazil). Two empirical equations and one theoretical equation were used. The results obtained were contrasted to verify the applicability of these equations in the environmental conditions of that region in Brazil. Although there were other equations (Walling and He, 1997), it was not possible to use them in this study, because the sampling strategy realized in watershed in 1992 did not allow to use these equations.
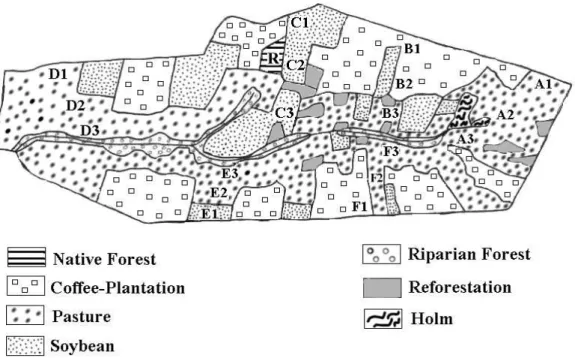
Figure 2 - Map of the Unda river watershed showing the use of the soil with several types of cultures and the sampling transects.
MATERIAL AND METHODS
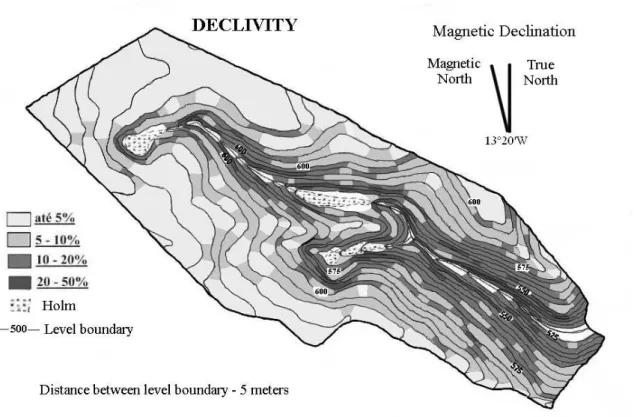
The study area was a small watershed in the district of Cambé (Brazil) located around the coordinates of 23016’ S and 51017’ W. The mean elevation of watershed is around 665 m above sea level. Figure 1 shows the relief and contour lines. The land uses of the watershed were divided in pasture, soybean and coffee plantation (Figure 2). The pasture and coffee plantation were sowed after the land ploughed was realized, so that the 137Cs was homogenized in the plough layer. The soybean was sowed every year after the land ploughed was realized. The predominant soil in the watershed is a dystrophic red latosol (Typic Haplortox) with a loamy texture.
The regional climate is classified as humid sub-tropical (mean temperature = 20.7 oC) with rainfall throughout the year, with a great probability of winter dryness (Corrêa et al., 1982). The average annual rainfall was 1615 mm yr-1, based on measurements carried out at surrounding meteorological sites, from 1975 to 1998.
The slope in the watershed is moderate, varying from 0 % to 10 %, from the upslope to the hillslope, and with an abrupt increase in slope
varying from 10 % to 50 % from the hillslope to the downslope.
Table 1 -137Cs input value determined for watershed studied in this work in comparison with other values determined for regions somewhat near to Cambé, Brazil.
Guimarães et al. (1988) Bacchi et al. (2000) This work
391,4 315,8 279,6
137
Cs input value (Bq m-2)
309,8
422 292
Then, it was possible to employ the 137Cs input value determined in the native forest to indicate soil losses or gains at the sampling points of the considered transects.
The point in the native forest was sampled down to 30 cm, in depth increments of 10 cm, but no significant 137Cs activity was detectable below 20 cm. Because of this, all sampling points of
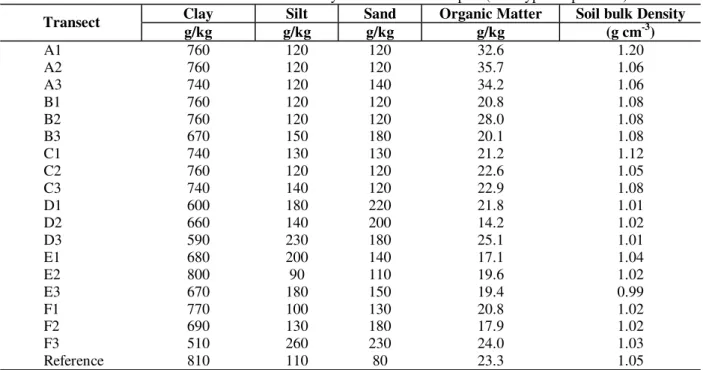
transects were collected from the 0 - 0.2 m depth, using five replicate cores, which were combined for analysis. Soil samples were crushed, sieved to < 2 mm, air dried for 48 h, and packed in Marinelli beakers for 137Cs activity measurements. Grain size analysis was carried out through the methodology described in EMBRAPA (1997), and the data are presented in Table 2.
Table 2 - Particle size distribution and soil bulk density of the transect samples (soil Typic Haplorthox).
Clay Silt Sand Organic Matter Soil bulk Density
Transect
g/kg g/kg g/kg g/kg (g cm-3)
A1 760 120 120 32.6 1.20
A2 760 120 120 35.7 1.06
A3 740 120 140 34.2 1.06
B1 760 120 120 20.8 1.08
B2 760 120 120 28.0 1.08
B3 670 150 180 20.1 1.08
C1 740 130 130 21.2 1.12
C2 760 120 120 22.6 1.05
C3 740 140 120 22.9 1.08
D1 600 180 220 21.8 1.01
D2 660 140 200 14.2 1.02
D3 590 230 180 25.1 1.01
E1 680 200 140 17.1 1.04
E2 800 90 110 19.6 1.02
E3 670 180 150 19.4 0.99
F1 770 100 130 20.8 1.02
F2 690 130 180 17.9 1.02
F3 510 260 230 24.0 1.03
Reference 810 110 80 23.3 1.05
The experimental arrangement for gamma ray detection consisted of: an HPGe detector with 10 % intrinsic efficiency, coaxial type, 2 ” diameter; a 1 k multichannel analyzer; standard gamma ray spectrometric electronic chain; low background plastic Marinelli beakers of 2 liters for the soil samples; lead and aluminum shields for the samples. Three replicates of gamma ray measurements were taken for each sample to increase the precision of the measurements of
137
Cs activity, using a counting time of 60 h. The energy resolution was 1.98 keV for the 661.6 keV 137Cs gamma line. The minimum detection
limit for 137Cs was 0.29 ± 0.03 Bq kg-1. The
detection efficiency is given by the following equation:
ε =
×
×
×
100
N
m
A
sf
(1)where:
ε
is the detection efficiency of the system; m is the mass of the sample (kg); As is the specificSince the gamma ray of 137Cs (661.6 keV) is the only line of interest, the
f
factor remainsconstant, and defining
α
=
100
(
ε
×
f
)
as the calibration factor, equation (1) becomes:α =
m
×
A
N
s
(2)
Four standards of known 137Cs concentration, which varied from 3 Bq kg-1 to 3500 Bq kg-1, were prepared for the determination of the calibration factor α.
The specific activities of the transects and reference samples were determined using equation (2) as follows:
m
N
A
=
α
×
(3)where: A is the specific activity (Bq kg-1);
α
is the average calibration factor, with a value of 291 Bq cps-1 obtained from the measurements with the gauged soil samples and N is the net area (in cps) of the 137Cs photo peak, obtained from the analysis of the gamma ray spectra of the samples and background.The total 137Cs inventory of samples was calculated through of the equation:
h
d
A
Cs
=
×
×
(4)where A is the 137Cs concentration (Bq kg-1), d is the soil density (kg m-3) and h is the depth increment (m) utilized for the sampling.
Soil losses (or gains) in the samples of transects were determined by three published equations. Ritchie and McHenry (1975) developed the first equation:
18 . 1 1
0
.
88
X
Y
=
×
(5)valid only for soil loss, where Y1 is the soil loss
(Mg ha-1 yr-1) and X is the 137Cs redistribution, given in percentage by the equation:
(
)
X
Cs
Cs
Cs
reference sample reference=
−
×
100
(6)
where Cssample is the 137Cs inventory for the
considered sample (Bq m-2) and Csreference is the 137
Cs inventory of reference sample (R).
De Jong et al. (1986) developed the second employed equation:
(
)
1000
1
T
S
h
d
Cs
Cs
Cs
Y
reference reference sample 2×
×
−
=
(7)where: Y2 represents the losses (negative sign) or
gains (positive sign) of the soil in Mg ha-1 yr-1; Cssample and Csreference are the same as defined for
equation (5); d is the bulk density of the soil (in kg m-3); h is the thickness of the plough layer (in m); S is the area of one-hectare (in m2) and T is the time elapsed between the main period of fallout (considered to be 1964) and the sampling date. Elliott et al. (1990) developed the third used equation:
(
)
X3
0
.
033854
1
.
076
Y
=
×
(8)which applies only for soil losses, where Y3 is the
soil loss in Mg ha-1 yr-1 and X is the 137Cs redistribution defined for equation (5).
The soil bulk density (d) of the analyzed samples is shown in Table 2. The thickness of the plough layer (h) was 0.2 m and the time elapsed (T) between the main period of fallout and the sampling date was 28 years, since sampling was carried out in 1992.
RESULTS AND DISCUSSION
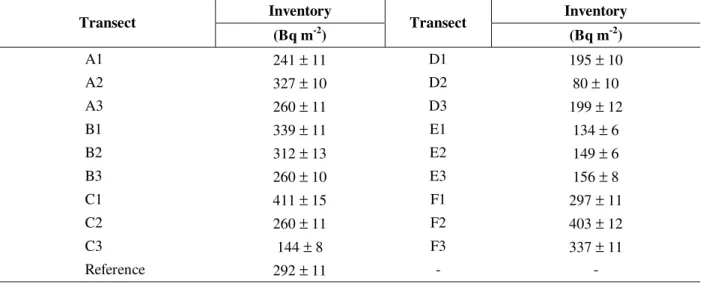
The 137Cs inventory for the reference sample (R) was 292 Bq m-2, with a standard deviation of 4 %. This result was consistent with other values reported for Brazilian soils that showed inventories in the range from 250 Bq m-2 to 1044 Bq m-2 (Sakai, 1977; Guimarães, 1988; Schuch et al., 1994; Bacchi et al, 2000). The 137Cs inventory of the 18 samples for the six transects varied from 80 Bq m-2 (with a standard deviation of 13 %) to 403 Bq m-2 (with a standard deviation of 3 %). The
137
Table 3 - 137Cs inventory for the samples ± standard deviation.
Inventory Inventory Transect
(Bq m-2) Transect (Bq m-2)
A1 241 ± 11 D1 195 ± 10
A2 327 ± 10 D2 80 ± 10
A3 260 ± 11 D3 199 ± 12
B1 339 ± 11 E1 134 ± 6
B2 312 ± 13 E2 149 ± 6
B3 260 ± 10 E3 156 ± 8
C1 411 ± 15 F1 297 ± 11
C2 260 ± 11 F2 403 ± 12
C3 144 ± 8 F3 337 ± 11
Reference 292 ± 11 - -
Table 4 - Measured values for soil losses (negative sign) or gains (positive sign) at the sampling sites using
equations (5), (7) and (8).
Y1 Equation (5)
Y3 Equation (8)
Y2 Equation (7) Transect
ton ha-1 yr-1 ton ha-1 yr-1 ton ha-1 yr-1
A1 -26 ± 4 -0.12 ± 0.02 -15 ± 4
A2 --- --- 9 ± 4
A3 -15 ± 8 -0.08 ± 0.02 -8 ± 4
B1 --- --- 12 ± 5
B2 --- --- 5 ± 5
B3 -15 ± 8 -0.07 ± 0.02 -8 ± 4
C1 --- --- 33 ± 6
C2 -15 ± 8 -0.08 ± 0.02 -8 ± 4
C3 -90 ± 7 -1.38 ± 0.05 -39 ± 3
D1 -55 ± 8 -0.39 ± 0.04 -24 ± 3
D2 -138 ± 8 -6.86 ± 0.13 -53 ± 3
D3 -53 ± 9 -0.35 ± 0.04 -23 ± 3
E1 -98 ± 6 -1.79 ± 0.05 -40 ± 2
E2 -87 ± 6 -1.21 ± 0.04 -36 ± 2
E3 -82 ± 7 -1.03 ± 0.05 -33 ± 2
F1 --- --- 1 ± 4
F2 --- --- 28 ± 5
F3 --- --- 11 ± 4
The erosion values were determined for each sampling site using equations (5) (Ritchie model) and (8) (Elliott model), and soil loss or gain by equation (7) (De Jong model). The 137Cs redistribution (X term) is given by equation (6). These results are presented in Table 4.
Analyzing the results obtained by the equations Y1, Y2 and Y3, a great difference among results obtained for each point of transects was observed.
The Elliott model was developed to represent the environmental conditions and the fallout level in Australia, and according to Walling et al. (1990) this reflected the estimates of soil loss for a given percentage 137Cs loss of about an order of magnitude lower than results obtained for Ritchie and de Jong model. Although Australian soils differed from Brazilian soils, the Elliott model was applied in this study for two reasons: it was only one deduced for a place in the south hemisphere and the fallout over the two countries was of the same order of magnitude.
Equation Y2 developed by de Jong et al. (1986) was not obtained empirically, but was based on the theoretical assumption that the soil transported by physical processes was directly proportional to the cesium-137 redistribution, where the proportionality was given by the characteristics of the soil. This theoretical assumption was based on the premise that 137Cs fallout inputs were completely mixed within the plough or cultivation layer. Although the assumptions of this model were a considerable oversimplification and the results were overestimated, it was easy to use. As this model required only information on plough depth, the 137Cs inventory values of the sampling points and the local reference inventory. Due to the sampling strategy, these were the only information obtained for the studied watershed and it was the more suitable theoretical model for application in this study.
Comparing results for Y1 and Y2 at Table 4, it was observed that the soil losses obtained by Y1 was twice of that by Y2, but standing at the same order of magnitude, although a much greater difference was expected due to the already discussed limitations of Y1 equation. On the other hand, comparing the results of Y1 and Y2 with Y3 at Table 4, it was observed that, besides the similar geographical positions and amount of fallout between Australia and Brazil, there was a difference of an order of magnitude lower between Y3 and Y1 or Y2 results that could only be attributed to the difference between soils of two countries.
Due to these limitations for equations Y1 and Y3, and also that they were valid only for soil loss calculation, we opted to use only values obtained with equation Y2 for results discussion.
The transect points that were sampled in the pasture (A1, A2, A3, B3, D1, D2, D3, E2, E3, F2 and F3) presented the highest levels of soil loss of all sampling points, according to the observed in
the field, where the pasture was degraded and with strips of bare soil, that allowed the erosive process to take place. The A2, F2 and F3 points in the pasture presented soil gain. The accumulation in A2 was due to this point being close to a contour line and in a relief with 0 - 5 % slope. The accumulation in F2 occurred because just above this point there was an area with soybean in a relief of 10 - 20 %, which probably contributed with soil gain in F2. Moreover this point was in a relief of 0 - 5 % slope. The accumulation in F3 occurred because the balance between soil loss and gain generated a positive value for gain, since if there was no erosion at this point, the accumulation in F3 should be larger than F2, and forasmuch F3 is below F2 in the relief.
Taking into consideration the deviation values, the transect points that were sampled in the coffee plantation (B1, B2 and F1) showed neither soil loss nor gain, as expected for coffee plantations which maintained good soil covering by canopy and minimum disturb by tillage.
C1, C2, C3 and E1, which were sampled in the soybean cultivation area, showed high soil loss; except for C1 that, due to its position in the relief and location in a sedimentation site, presented soil gain. These results were expected as the soil mechanization was still a conventional tillage, allowing the soil stay bare and weather exposure, susceptible to hydro-erosion.
Coffee plantation was the only cultivation successful in impeding erosion process at the basin. Figure 2 showed that the studied watershed had problems of soil loss and this was because the main crops grown in the watershed (pastures and soybean) were conducted in a bad soil tillage, whereas could be strongly controlled and minimized if land reclamation projects, conservation of pasture and new soil tillage techniques for the soybean, as no tillage, for instance, were implemented.
The results presented in this work showed that the
137
Cs methodology could be applied for the studied region, and special attention be given to the process of choosing the model to be used for erosion quantification through the caesium-137 redistribution technique.
RESUMO
adsorvido às partículas finas do solo. Este pode ser usado como um marcador para determinação da redistribuição do solo. Esta metodologia tem sido muito usada nos países desenvolvidos, porém ainda muito pouco difundida no Brasil. O objetivo deste estudo foi a aplicação desta metodologia para determinação de perdas e ganhos de solo em uma bacia no município de Cambe, Paraná. Esta bacia está localizada ao redor das coordenadas 23º16’ S e 51º17’ O e o solo cultivado com diferentes culturas. Uma amostragem em transectos foi utilizada para avaliar a influência dos diferentes cultivos na erosão do solo. Um ponto em área de floresta foi amostrado e analisado para determinar o inventário de referência de césio-137 depositado pelo “fallout”. O valor médio do inventário de referência foi de 292 Bq m-2. O inventário de césio-137 das amostras dos transectos variou de 80 Bq m-2 até 403 Bq m-2. Os pontos amostrados em pastagem e em cultura de soja apresentaram perdas de solo, e os pontos amostrados em plantação de café não apresentaram nem perda nem ganho de solo.
ACKNOWLEDGMENTS
We thank F. R. de Pádua for helping in samples preparation and data analysis, A. L. Passarin for soil sampling at the Unda river watershed and F. R. Espinoza Quinõnes for helping in the analysis and interpretation of the gamma spectroscopy data.
REFERENCES
Andrello, A. C. (1997), Metodologia do 137Cs para determinação da erosão e deposição de solo em uma bacia de solo LRd do Norte do Paraná. Dissertação (Mestrado), Universidade Estadual de Londrina, Paraná, Brasil.
Andrello, A. C.; Appoloni, C. R.; Parreira, P. S.; Coimbra, M. M. and Guimarães, M. F. (1997), Determinação da erosão/sedimentação do solo por meio da medida da concentração de 137Cs. Paper presented in International Symposium on Nuclear and Related Techniques in Agriculture, Industry, Health and Environment, 28-30 October, Havana, Cuba. Andrello, A. C.; Appoloni, C. R. and Guimarães, M. F.
(2003) Uso do césio-137 para avaliar taxas de erosão em cultura de soja, café e pastagem. R. Bras. Ci. Solo,
27, 223-229.
Bacchi, O. O. S.; Reichard, K.; Sparovek, G. and Ranieri, S. B. L. (2000), Soil erosion evaluation in a small watershed in Brazil through 137Cs fallout redistribution analysis and conventional models. Acta. Geo. Hisp., 35, 251-259.
Corrêa, A. R.; Godoy, H. and Bernardes, L. R. M. (1985), Características climáticas de Londrina. Londrina.
De Jong, E.; Wang, C. and Ress, H. W. (1986), Soil redistribution on three cultivated New Brunswick hillslopes calculated for 137Cs measurements, solum data and the USLE. Can. J. Soil. Scii,, 66, 721-730. Elliott, G. L.; Campbell, B. L. and Loughran, R. J.
(1990), Correlation of erosion measurements and soil caesium-137 content. Appl Rad Isotopes, 4, 713-717. Eltz, F. L. F.; Cassol, E. A.; Scopel, I.; Guerra, M.
(1984), Perdas de solo e água por erosão em diferentes sistemas de manejo e coberturas vegetais em solo Laterítico Bruno-Avermelhado Distrófico (São Jerônimo) sob chuva natural. Rev. Bras. Ci. Solo, 8, 117-125.
Empresa Brasileira de Pesquisa Agropecuária, (1997) Manual de métodos de análise de solo. Rio de Janeiro : Embrapa.
Foster, G. R. (1991), Advances in wind and water erosion prediction. J. Soil. Water Conserv., 46, 27-29. Gillete, D. A. (1986), Wind erosion. In M.G. Wolman, et al. (eds) Soil conservation, Nat. Washington : Academy Press. pp.129-158.
Guimarães, M. F. (1988), 137Cs da precipitação radioativa (“fallout”) no estudo da erosão e sedimentação de solo. Tese (Doutorado), ESALQ/USP, São Paulo, Brasil.
Guimarães, M. F.; Nascimento Filho, V. F. and Ritchie, J. (2003), Application of cesium-137 in a study of soil erosion and deposition in southeastern Brazil. Soil. Sci., 168, 45-53.
Kronen, M. A. (1990), Erosão do solo de 1952 a 1985 e seu controle no Paraná. Londrina.
Olson, K. R.; Norton, L. P.; Fenton, T. E. and Lal, R. (1994), Quantification of soil loss from eroded soil phases. J. Soil. Water Conserv., 49, 591-596.
Renard, K. G.; Foster, G. R.; Weesies, G. A. and Porter, J. P. (1990), RUSLE - Revised universal soil loss equation. J. Soil. Water Conserv., 46, 30-33.
Ritchie, J. C. and McHenry, J. R. (1975), Fallout 137Cs: a tool in conservation research. J. Soil. Water Conserv., 30, 283-288.
Ritchie, J. C. and McHenry, J. R. (1990) Application of radioactive fallout Cesium-137 for measuring soil erosion and sediment accumulation rates and patterns: A review. J. Environ. Quality, 19, 215-233.
Schuch, L. A.; Nordemann, D. J. R. and Barreto, N. O. (1994), Natural and artificial radionuclides in soils from Parana State, Brazil. J. Radioanal Nucl. Chem.,
177, 39-49.
Sorreson, W. J. and Montoya, L. J. (1989), Implicações econômicas da erosão do solo e do uso de algumas práticas conservacionistas no Paraná. Londrina: Tamura, T. (1964), Selective sorption reactions of
Cesium with mineral soil. Nucl. Safety, 5, 262-268. Vlacke, E. and Cremers, A. (1994), Sorption-desorption
dynamics of radiocaesium in organic matter soils. Sci. Total Environ., 157, 275-283.
Walling, D. E. and Quine, T. A. (1990), Calibration of caesium-137 measurements to provide quantitative erosion rate data. Land. Degrad. Rehab., 2, 161-175. Walling, D. E. and He, Q.(1997), Models for converting
137
Cs measurements to estimates of soil redistribution rates on cultivated and uncultivated soils. Vienna : IAEA.