Printed version ISSN 0001-3765 / Online version ISSN 1678-2690 http://dx.doi.org/10.1590/0001-3765201820170150
www.scielo.br/aabc | www.fb.com/aabcjournal
Dispersion and aggregation patterns of tree species in
Araucaria
Forest, Southern Brazil
JOÃO PAULO DE MAÇANEIRO1
, ANDRÉ LUÍS DE GASPER2
, FRANKLIN GALVÃO3
and LAURI A. SCHORN4
1
Universidade Federal do Paraná/UFPR, Programa de Pós-Graduação em Engenharia Florestal, Departamento de Engenharia Florestal, Avenida Prefeito Lothário Meissner, 900, Jardim Botânico, 80210-170 Curitiba, PR, Brazil
2
Fundação Universidade Regional de Blumenau/FURB, Centro de Ciências Exatas e Naturais, Departamento de Ciências Naturais, Rua Antônio da Veiga, 140, Victor Konder, 89012-900 Blumenau, SC, Brazil 3
Universidade Federal do Paraná/UFPR, Setor de Ciências Agrárias, Departamento de Engenharia Florestal, Avenida Prefeito Lothário Meissner, 900, Jardim Botânico, 80210-170 Curitiba, PR, Brazil 4
Fundação Universidade Regional de Blumenau/FURB, Centro de Ciências Tecnológicas, Departamento de Engenharia Florestal, Rua São Paulo, 3250, Itoupava Seca, 89010-971 Blumenau, SC, Brazil
Manuscript received on March 6, 2017; accepted for publication on June 23, 2017
ABSTRACT
Studies about dispersal syndromes and spatial distribution can provide information about species ecology.
However, few studies analyze these ecological patterns in different vegetation layers. In this work, we
verified the relationship between the dispersion syndromes and the spatial distribution in different layers
in
Araucaria
Forest. We sampled 180 plots with size and inclusion criteria that changed according to the
vegetative layer. We sampled 15,545 individuals in 103 tree species. We found significant differences
between the number of species in the dispersion syndromes (χ
2= 11.52;
P
≤ 0.05) and spatial distribution
patterns (χ
2= 10.94;
P
≤ 0.05), being zoochoric and tends to clustering the most predominant. We also
found a significant interaction between the dispersion syndromes and spatial distribution patterns in the
analyzed layers (
F
= 1,044;
P
< 0.0001), with anemochoric species characterized by random distribution,
autochoric in the cluster distribution and zoochoric in the tends to clustering. The results demonstrate that
the tree species of the different layers are related to the type of dispersion and the aggregation pattern.
Key words
:
Araucaria
forest, seed dispersal, spatial distribution, layers analysis.
Correspondence to: João Paulo de Maçaneiro E-mail: [email protected]
* Contribution to the centenary of the Brazilian Academy of Sciences.
INTRODUCTION
The Atlantic Forest hotspot covered ~1,300,000
km² of Brazilian territory and also a small portion
of Argentina – 9,950 km² (Chebez and Hilgert
2003, De Angelo 2009) and Paraguay – 11,618
km² (Cartes and Yanosky 2003, Huang et al. 2007,
2009). It has high biodiversity (Stehmann et al.
2009), but, due to a historical process of 500 years
of deforestation, it is currently highly fragmented,
with only 11.7% of its original covering in Brazil
(Ribeiro et al. 2011). Currently, the destruction of
these forests for urban expansion and agricultural
frontiers has resulted in high levels of fragmentation
The fragmentation process in tropical and
subtropical forests, change natural habitats, limit
seed dispersal and provide aggregation of tree
species, as well as promote a high loss of fauna
and flora diversity due to the structural complexity
of these forests (Nathan and Muller-Landau 2000,
Padilha et al. 2015). Changes in habitats may, for
example, reflect on the decline of populations
of frugivorous animals (Cox and Kesler 2012),
which are responsible for 80% of seed dispersion
in forest canopy species (Beckman and Rogers
2013). Another consequence of the fragmentation
is the strong tendency of aggregation of the tree
species, because in the absence of disperser agents,
the seeds tend to fall closer to its mother plant
(Wilson et al. 2004, Nathan 2006), as well as their
reproductive isolation and consequent reduction of
genetic diversity (Reis et al. 2012).
For many tree species, the spatial distribution
pattern is strongly correlated with seed morphology,
since it differs in its ability to disperse seeds
(Seidler and Plotkin 2006). In old growth tropical
and subtropical forests, between 50 and 75% of
tree species produce fleshy fruits, which facilitates
the animal feeding (Beckman and Rogers 2013,
Traveset et al. 2014). This dispersion by animals
can lead to occasional accumulations of propagules,
due to their behavior (Schupp et al. 2002). On the
other hand, the diaspore of wind-dispersed species
tends to travel long distances from its mother plant
and the success of the dispersal is conditioned
by the wind intensity and forest canopy pattern
(Nathan and Katul 2005).
The
Araucaria
Forest comprises a large part of
southern plateau (Klein 1960, IBGE 2012, Kersten
et al. 2015), and it is the greatest phytogeographic
unit in extension and the most fragmented in
the Brazilian Atlantic Forest.
Araucaria
forests
originally occupied 42,851 km² of the state of
Santa Catarina (Klein 1978), but due to the intense
fragmentation process it is currently reduced to
only 24.4% of its original covering (Vibrans et
al. 2012). In addition, these remnants are largely
represented by fragments of secondary forests in
the intermediate and late stages of regeneration,
with rare primary or initial forests (Sevegnani et al.
2012, Vibrans et al. 2013, Maçaneiro et al. 2015,
Maçaneiro et al. 2016a).
Considering the current state of
Araucaria
Forest’s fragmentation in Santa Catarina (see
Vibrans et al. 2012), studies that analyze the
correlation between dispersal syndromes and spatial
distribution patterns are significant since they can
provide information on the conservation status
of the current remnants and on the autoecology
of plant species (Cousens et al. 2008). In this
sense, we analyzed the relationship between the
dispersion syndromes and the spatial distribution
patterns of
Araucaria
Forest in Southern Brazil, in
order to contribute to the tree species’ population
ecology and answer the following questions: i)
Does the strategy of seed dispersal in the
Araucaria
Forest reflect the pattern of spatial distribution of
tree species? ii) Are there differences between the
forest layers with the dispersion syndromes and the
patterns of spatial distribution of tree species?
MATERIALS AND METHODS
STUDY AREA
The study area is located in RPPN Emilio Einsfeld
Filho, Campo Belo do Sul, Santa Catarina, Southern
Brazil with 6,328.60 ha and altitude ranging from
620 to 980 m, between 27°55’ and 28º05’S and
50°55’ and 50º44’W. The climate, according to
Köppen’s classification (Alvares et al. 2014), is Cfb
with 1,527 mm throughout the year (Pandolfo et
al. 2002).
The study area vegetation is constituted
by
Araucaria
Forest (also called as Mixed
Ombrophilous Forest - IBGE 2012), mainly
characterized by dense presence of Brazilian pine
[
Araucaria angustifolia
(Bertol.) Kuntze]. The area
was used for logging until 1985, and this exploration
concentrated on the Brazilian pine and other
species of economic interest (like
Ocotea porosa
(Nees & Mart.) Barroso,
Ocotea odorifera
(Vell.)
Rohwer and
Cedrela fissilis
Vell.). Currently, the
forest in the study area is characterized by degraded
vegetation remnants due to selective use in the
past. (Maçaneiro et al. 2016b) and characterized
as a continuous fragment formed by corridors,
especially through the river system.
DATA COLLECTION
We divided the vegetation in three layers: 1) upper
tree layer (UTL); 2) lower tree layer (LTL) and, 3)
natural regeneration (NR). In the first two layers,
tree individuals have reached maturity and in the
third layer, the plants are in the process of natural
regeneration. We randomly assigned 180 plots
of 10 x 50 m (500 m²) (including palms and tree
ferns) with diameter at breast height (DBH) ≥ 10
cm for UTS. In each part of the UTL we added a
subplot of 10 x 25 m (250 m²), to access the LTL,
characterized by individuals with 5 cm ≤ DBH < 10
cm. For the NR survey, a circular plot with 2.5 m
radius was inserted in the center of each UTL plot
(19.6 m²), where we sampled all individuals with
height ≥ 50 cm and DBH < 5 cm. These plots were
randomized and installed at a minimum distance of
20 m from the forest edge.
The botanical material was identified in the
Laboratory of Dendrology and Dr. Roberto Miguel
Klein Herbarium (FURB), from the Universidade
Regional de Blumenau (FURB), as well as in
available literature. We followed APG IV and PPG
I for species classification (APG IV 2016, PPG I
2016) and Brazilian Flora 2020 (2017) for scientific
names.
DATA ANALYSIS
We classified the species as anemochoric,
autochoric and zoochoric, following Pijl (1982),
based on
Araucaria
Forest studies, such as Paise
and Vieira (2005), Almeida et al. (2008), Liebsch
and Mikich (2009), Liebsch et al. (2009), Klauberg
et al. (2010), Negrini et al. (2012) and Ferreira et
al. (2013).
We calculated, for each population, the
McGuinnes index, to analyze the distribution
pattern. This index is based on the relationship
between the observed density and the expected
density of individuals of a given species in the
sample (McGuinnes 1934). Thus, when the value is
< 1 the distribution of the species is uniform; when
it is equal to 1 the distribution is random; when it
is > 1 and ≤ 2 the distribution tends to cluster and;
when > 2 the distribution is clustered.
In order to verify if the dispersion syndromes
and spatial distribution patterns differ in the
analyzed layers, a partitioned chi-square test was
applied using a level of significance α = 0.05. Then,
the existence of interaction between the dispersion
syndromes and the spatial distribution patterns was
tested through
two-way
ANOVA. In this analysis,
the number of individuals of each species in the plots
was considered, and a significance level of α = 0.05
was applied. We tested the assumptions of normality,
homoscedasticity and randomness (Zar 2010).
RESULTS
TABLE I
Analyzed parameters for the species in different layers of Araucaria Forest in Southern Brazil.
Parameters Upper tree layer
Lower tree layer
Natural regeneration Sample area
(m²) 90,000.00 45,000.00 3,534.30
Species number 98 85 89
Genus number 72 67 66
Families number 40 38 40
Individual
number 8,362 3,105 4,078
Tree density (ind.ha-1
) 929.1 690.0 11,538.4
Basal area (m².ha-1
) 42.77 2.68
-Figure 1 - Dispersion syndrome (%) and spatial distribution pattern (%) for upper tree layer (a, d); lower tree layer (b, e) and natural regeneration (c, f) of Araucaria Forest in Southern Brazil.
There were significant differences in the species
dispersion syndromes and spatial distribution
patterns in the analyzed layers (dispersion
syndromes: χ
2= 11.52;
p
≤ 0.05; spatial distribution
patterns: χ
2= 10.94;
p
≤ 0.05). Zoochoric is the
most common syndrome (UTL = 69.4%, LTL =
70.6% and NR = 70.8%) with a tends to cluster the
most common distribution pattern (UTL= 71.1%,
LTL = 54.1% and NR= 58.4%) (Figure 1).
There are significant interaction (ANOVA,
F
= 1,044;
p
< 0.0001) between the dispersion
syndromes and the patterns of spatial distribution in
all layers, indicating that the species are influenced
by these ecological characteristics (Figure 2). In
the zoochoric species, more than 75% have tends
to cluster spatial distribution.
DISCUSSION
Our results show that the dispersion syndromes and
the patterns of spatial distribution of tree species
vary according to the forest layer. In addition, the
distribution of tree species is conditioned by the
dispersion syndrome and the aggregation pattern.
Regarding the dispersion syndromes, the prevalence
of zoocoria is expected for the
Araucaria
Forest,
occurring with greater intensity in the forest’s
lower layers where it can represent up to 80% of
the tree species (Foster 1982, Beckman and Rogers
Table II
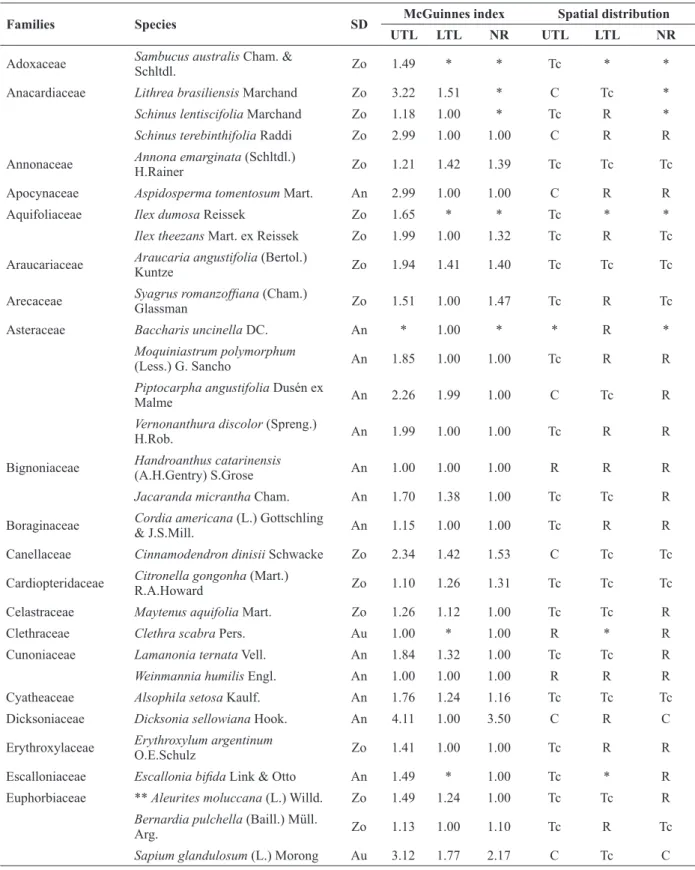
Families and species sampled in different layers of Araucaria Forest in Southern Brazil. SD = dispersion syndrome;
An = anemochoric; Au = autochoric; Zo = zoochoric; UTL = upper tree layer; LTL = lower tree layer; NR = natural regeneration; * = Species absent in the layer; C = clustered; R = random; Tc = tends to cluster.
Families Species SD McGuinnes index Spatial distribution
UTL LTL NR UTL LTL NR
Adoxaceae Sambucus australis Cham. &
Schltdl. Zo 1.49 * * Tc * *
Anacardiaceae Lithrea brasiliensis Marchand Zo 3.22 1.51 * C Tc *
Schinus lentiscifolia Marchand Zo 1.18 1.00 * Tc R *
Schinus terebinthifolia Raddi Zo 2.99 1.00 1.00 C R R
Annonaceae Annona emarginata (Schltdl.)
H.Rainer Zo 1.21 1.42 1.39 Tc Tc Tc
Apocynaceae Aspidosperma tomentosum Mart. An 2.99 1.00 1.00 C R R
Aquifoliaceae Ilex dumosa Reissek Zo 1.65 * * Tc * *
Ilex theezans Mart. ex Reissek Zo 1.99 1.00 1.32 Tc R Tc
Araucariaceae Araucaria angustifolia (Bertol.)
Kuntze Zo 1.94 1.41 1.40 Tc Tc Tc
Arecaceae Syagrus romanzoffiana (Cham.)
Glassman Zo 1.51 1.00 1.47 Tc R Tc
Asteraceae Baccharis uncinella DC. An * 1.00 * * R *
Moquiniastrum polymorphum
(Less.) G. Sancho An 1.85 1.00 1.00 Tc R R
Piptocarpha angustifolia Dusén ex
Malme An 2.26 1.99 1.00 C Tc R
Vernonanthura discolor (Spreng.)
H.Rob. An 1.99 1.00 1.00 Tc R R
Bignoniaceae Handroanthus catarinensis
(A.H.Gentry) S.Grose An 1.00 1.00 1.00 R R R
Jacaranda micrantha Cham. An 1.70 1.38 1.00 Tc Tc R
Boraginaceae Cordia americana (L.) Gottschling
& J.S.Mill. An 1.15 1.00 1.00 Tc R R
Canellaceae Cinnamodendron dinisii Schwacke Zo 2.34 1.42 1.53 C Tc Tc Cardiopteridaceae Citronella gongonha (Mart.)
R.A.Howard Zo 1.10 1.26 1.31 Tc Tc Tc
Celastraceae Maytenus aquifolia Mart. Zo 1.26 1.12 1.00 Tc Tc R
Clethraceae Clethra scabra Pers. Au 1.00 * 1.00 R * R
Cunoniaceae Lamanonia ternata Vell. An 1.84 1.32 1.00 Tc Tc R
Weinmannia humilis Engl. An 1.00 1.00 1.00 R R R
Cyatheaceae Alsophila setosa Kaulf. An 1.76 1.24 1.16 Tc Tc Tc
Dicksoniaceae Dicksonia sellowiana Hook. An 4.11 1.00 3.50 C R C
Erythroxylaceae Erythroxylum argentinum
O.E.Schulz Zo 1.41 1.00 1.00 Tc R R
Escalloniaceae Escallonia bifida Link & Otto An 1.49 * 1.00 Tc * R Euphorbiaceae ** Aleurites moluccana (L.) Willd. Zo 1.49 1.24 1.00 Tc Tc R
Bernardia pulchella (Baill.) Müll.
Arg. Zo 1.13 1.00 1.10 Tc R Tc
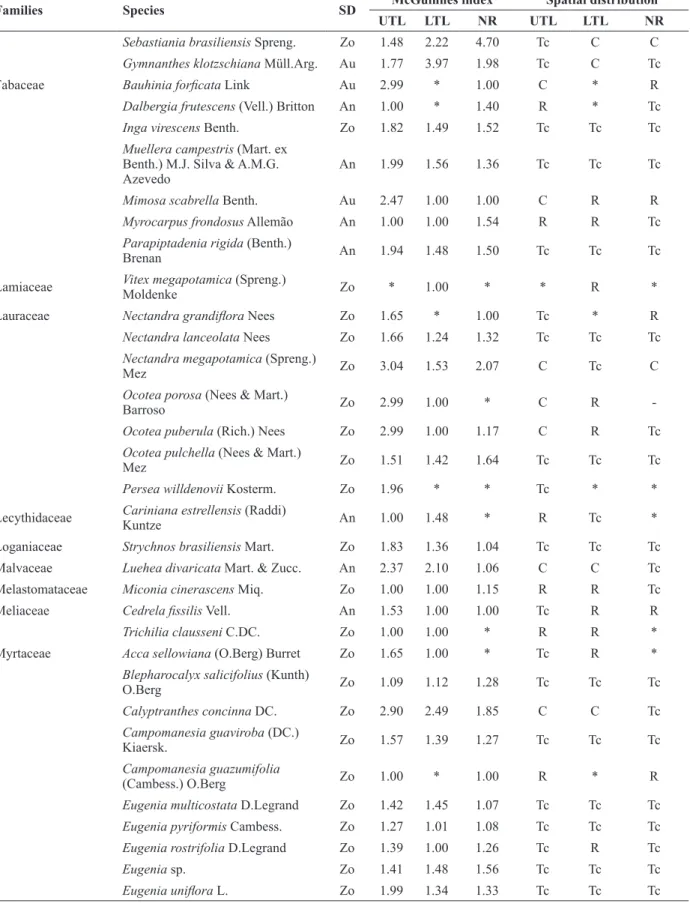
Families Species SD McGuinnes index Spatial distribution
UTL LTL NR UTL LTL NR
Sebastiania brasiliensis Spreng. Zo 1.48 2.22 4.70 Tc C C
Gymnanthes klotzschiana Müll.Arg. Au 1.77 3.97 1.98 Tc C Tc
Fabaceae Bauhinia forficata Link Au 2.99 * 1.00 C * R
Dalbergia frutescens (Vell.) Britton An 1.00 * 1.40 R * Tc
Inga virescens Benth. Zo 1.82 1.49 1.52 Tc Tc Tc
Muellera campestris (Mart. ex Benth.) M.J. Silva & A.M.G. Azevedo
An 1.99 1.56 1.36 Tc Tc Tc
Mimosa scabrella Benth. Au 2.47 1.00 1.00 C R R
Myrocarpus frondosus Allemão An 1.00 1.00 1.54 R R Tc
Parapiptadenia rigida (Benth.)
Brenan An 1.94 1.48 1.50 Tc Tc Tc
Lamiaceae Vitex megapotamicaMoldenke (Spreng.) Zo * 1.00 * * R *
Lauraceae Nectandra grandiflora Nees Zo 1.65 * 1.00 Tc * R
Nectandra lanceolata Nees Zo 1.66 1.24 1.32 Tc Tc Tc
Nectandra megapotamica (Spreng.)
Mez Zo 3.04 1.53 2.07 C Tc C
Ocotea porosa (Nees & Mart.)
Barroso Zo 2.99 1.00 * C R
-Ocotea puberula (Rich.) Nees Zo 2.99 1.00 1.17 C R Tc
Ocotea pulchella (Nees & Mart.)
Mez Zo 1.51 1.42 1.64 Tc Tc Tc
Persea willdenovii Kosterm. Zo 1.96 * * Tc * *
Lecythidaceae Cariniana estrellensis (Raddi)
Kuntze An 1.00 1.48 * R Tc *
Loganiaceae Strychnos brasiliensis Mart. Zo 1.83 1.36 1.04 Tc Tc Tc Malvaceae Luehea divaricata Mart. & Zucc. An 2.37 2.10 1.06 C C Tc Melastomataceae Miconia cinerascens Miq. Zo 1.00 1.00 1.15 R R Tc
Meliaceae Cedrela fissilis Vell. An 1.53 1.00 1.00 Tc R R
Trichilia clausseni C.DC. Zo 1.00 1.00 * R R *
Myrtaceae Acca sellowiana (O.Berg) Burret Zo 1.65 1.00 * Tc R *
Blepharocalyx salicifolius (Kunth)
O.Berg Zo 1.09 1.12 1.28 Tc Tc Tc
Calyptranthes concinna DC. Zo 2.90 2.49 1.85 C C Tc
Campomanesia guaviroba (DC.)
Kiaersk. Zo 1.57 1.39 1.27 Tc Tc Tc
Campomanesia guazumifolia
(Cambess.) O.Berg Zo 1.00 * 1.00 R * R
Eugenia multicostata D.Legrand Zo 1.42 1.45 1.07 Tc Tc Tc
Eugenia pyriformis Cambess. Zo 1.27 1.01 1.08 Tc Tc Tc
Eugenia rostrifolia D.Legrand Zo 1.39 1.00 1.26 Tc R Tc
Eugenia sp. Zo 1.41 1.48 1.56 Tc Tc Tc
Eugenia uniflora L. Zo 1.99 1.34 1.33 Tc Tc Tc
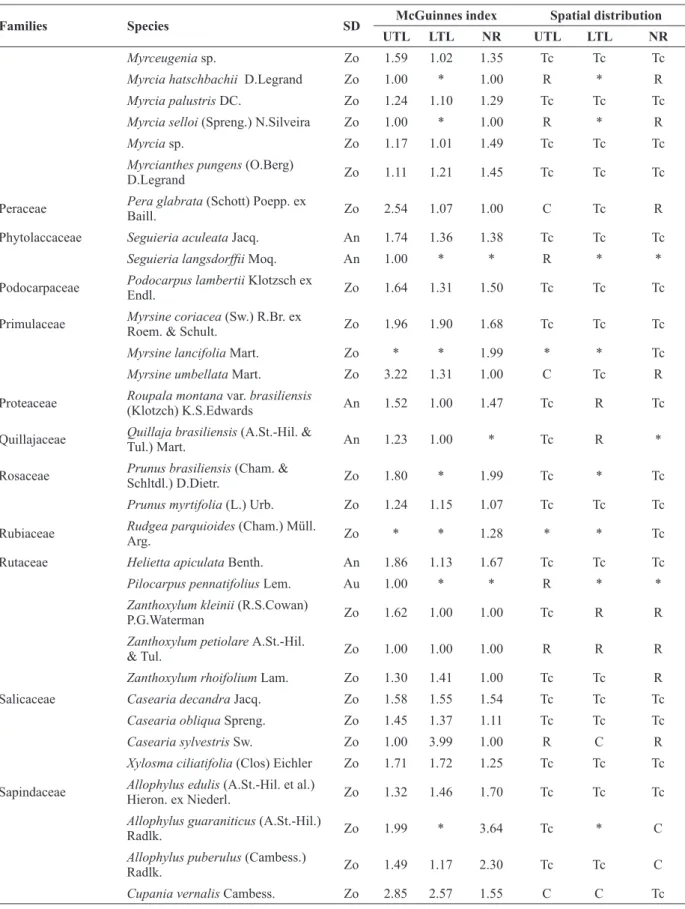
Families Species SD McGuinnes index Spatial distribution
UTL LTL NR UTL LTL NR
Myrceugenia sp. Zo 1.59 1.02 1.35 Tc Tc Tc
Myrcia hatschbachii D.Legrand Zo 1.00 * 1.00 R * R
Myrcia palustris DC. Zo 1.24 1.10 1.29 Tc Tc Tc
Myrcia selloi (Spreng.) N.Silveira Zo 1.00 * 1.00 R * R
Myrcia sp. Zo 1.17 1.01 1.49 Tc Tc Tc
Myrcianthes pungens (O.Berg)
D.Legrand Zo 1.11 1.21 1.45 Tc Tc Tc
Peraceae Pera glabrata (Schott) Poepp. ex
Baill. Zo 2.54 1.07 1.00 C Tc R
Phytolaccaceae Seguieria aculeata Jacq. An 1.74 1.36 1.38 Tc Tc Tc
Seguieria langsdorffii Moq. An 1.00 * * R * *
Podocarpaceae Podocarpus lambertii Klotzsch ex
Endl. Zo 1.64 1.31 1.50 Tc Tc Tc
Primulaceae Myrsine coriacea (Sw.) R.Br. ex
Roem. & Schult. Zo 1.96 1.90 1.68 Tc Tc Tc
Myrsine lancifolia Mart. Zo * * 1.99 * * Tc
Myrsine umbellata Mart. Zo 3.22 1.31 1.00 C Tc R
Proteaceae Roupala montana var. brasiliensis
(Klotzch) K.S.Edwards An 1.52 1.00 1.47 Tc R Tc
Quillajaceae Quillaja brasiliensis (A.St.-Hil. &
Tul.) Mart. An 1.23 1.00 * Tc R *
Rosaceae Prunus brasiliensis (Cham. &
Schltdl.) D.Dietr. Zo 1.80 * 1.99 Tc * Tc
Prunus myrtifolia (L.) Urb. Zo 1.24 1.15 1.07 Tc Tc Tc
Rubiaceae Rudgea parquioides (Cham.) Müll.
Arg. Zo * * 1.28 * * Tc
Rutaceae Helietta apiculata Benth. An 1.86 1.13 1.67 Tc Tc Tc
Pilocarpus pennatifolius Lem. Au 1.00 * * R * *
Zanthoxylum kleinii (R.S.Cowan)
P.G.Waterman Zo 1.62 1.00 1.00 Tc R R
Zanthoxylum petiolare A.St.-Hil.
& Tul. Zo 1.00 1.00 1.00 R R R
Zanthoxylum rhoifolium Lam. Zo 1.30 1.41 1.00 Tc Tc R
Salicaceae Casearia decandra Jacq. Zo 1.58 1.55 1.54 Tc Tc Tc
Casearia obliqua Spreng. Zo 1.45 1.37 1.11 Tc Tc Tc
Casearia sylvestris Sw. Zo 1.00 3.99 1.00 R C R
Xylosma ciliatifolia (Clos) Eichler Zo 1.71 1.72 1.25 Tc Tc Tc Sapindaceae Allophylus edulis (A.St.-Hil. et al.)
Hieron. ex Niederl. Zo 1.32 1.46 1.70 Tc Tc Tc
Allophylus guaraniticus (A.St.-Hil.)
Radlk. Zo 1.99 * 3.64 Tc * C
Allophylus puberulus (Cambess.)
Radlk. Zo 1.49 1.17 2.30 Tc Tc C
Cupania vernalis Cambess. Zo 2.85 2.57 1.55 C C Tc
Families Species SD McGuinnes index Spatial distribution
UTL LTL NR UTL LTL NR
Matayba elaeagnoides Radlk. Zo 2.43 1.98 1.37 C Tc Tc
Solanaceae Brunfelsia pilosa Plowman Zo 1.00 1.00 1.26 R R Tc
Capsicum flexuosum Sendtn. Zo 1.06 1.00 1.54 Tc R Tc
Solanum mauritianum Scop. Zo 1.00 1.00 1.00 R R R
Solanum sanctaecatharinae Dunal Zo 1.97 2.54 1.18 Tc C Tc
Solanum sp. Zo 1.00 1.00 1.00 R R R
Styracaceae Styrax leprosus Hook. & Arn. Zo 2.38 1.45 1.60 C Tc Tc
Thymelaeaceae Daphnopsis racemosa Griseb. Zo * * 1.00 * * R
Winteraceae Drimys brasiliensis Miers Zo 1.48 1.24 1.32 Tc Tc Tc ** Alien species.
TABLE II (continuation)
proportion of zoochoric species tends to increase
according to the progression in the successional
process (Liebsch et al. 2008). The Myrtaceae,
Lauraceae and Sapindaceae families are generally
identified as the most important of the
Araucaria
Forest in Santa Catarina (Klein 1978, Gasper et
al. 2013), mainly because it represents a great part
of the species with zoochoric dispersion (Liebsch
and Mikich 2009, Klauberg et al. 2010, Negrini et
al. 2012). These families are also typical of
well-conserved forests and exhibit the characteristic of
high abundance of individuals under the
Araucaria
Forest canopy, which are an important source of
resources for the frugivorous animals (Klein 1960,
Reitz and Klein 1966, Paise and Vieira 2005).
Most species in the analyzed layers tend to
cluster in the forest. This characteristic has already
been reported for 65% of the species by Kanieski et
al. (2012). However, regenerating species may have
a tends to cluster and, adult trees to occur in groups
(see Nascimento et al. 2001). This may occur due to
the interactions with the dispersing agents or because
of a density-dependent competition increase, where
population fluctuations of plants depend directly
on the size of the previous population, which in
turn is determined by intrinsic ecological processes
(see Berryman 1999, Knape and Valpine 2012).
For example, Beckman and Rogers (2013) mention
that some animals can deposit seeds in favorable
environments for their germination (clearings, tree
trunks, forest edges), or even in the same place, as
in the case of tapirs (Giombini et al. 2009), where
they generate an aggregate pattern of palm
Syagrus
romanzoffiana
(Cham.) Glassman. Boyer et al.
(2006) point out that some primates follow mental
maps and choose their path according to a criterion
of maximum efficiency to find scarce resources
(fruits and seeds) in a heterogeneous environment,
such as tropical forests. These animals may deposit
seeds in aggregate at some sites, however, the
foraging patterns are generalized and seed dispersal
in the forest may be random (Boyer et al. 2006).
Furthermore, the aggregation pattern of many
tree species will depend on the secondary dispersion
event, promoted by insects or rodents on the soil
(Forget et al. 2005, Vander Wall et al. 2005, Silva
et al. 2012). For example, the aggregation of seeds
dispersed by animals at specific sites depends on the
number of seeds per defecation, the aggregation of
defecations and the persistence of seed entering the
deposition sites over time, among others (Beckman
and Rogers, 2013). In altered secondary forests, the
tendency of aggregation of zoochoric species may
occur due to habitat fragmentation, for absence of
dispersant animals the seeds of the trees tend to
be dispersed near the mother plant (Wilson et al.
2004, Nathan 2006). However, in well-conserved
secondary forests where dispersal animals are
present, seed aggregation may occur in greater
proportion under nests or along paths used by
animals that travel small and long distances (Schupp
et al. 2002, Boyer et al. 2006) and in environments
similar to the mother plant (Cavallero et al. 2012).
In the present study, several ecological factors may
be contributing to the aggregation of zoochoric
species (see Boyer et al. 2006, Beckman and Rogers
2013). However, detailed studies on the interactions
between dispersing agents and tree species should be
performed to confirm this hypothesis.
The anemochoric dispersion was characterized
by the predominance of species with random
distribution. In forest ecosystems, this result is
usually expected, since the seeds of anemochoric
species have winged structures that favor transport
by the wind (Barbosa et al. 2012). Moreover, these
seeds can reach long distances from their point of
origin according to the intensity of the wind and
the distribution of treetops (Nathan et al. 2001,
Beckman and Rogers 2013). The higher proportion
of anemochoric species with a random distribution
suggests that these species, once dispersed by
the wind and not having a specific place for their
The clustered distribution was the most
representative in autochoric species. These species
have explosive mechanisms of dispersion or are
dispersed by gravity (Barbosa et al. 2012), in
addition to having small dispersion distance in
relation to other means, which results in a high
density of seeds and seedlings near the mother
plant (Narbona et al. 2005, Nathan 2006). Due to
these ecological traits, generally autochoric species
tend to present a clustered distribution pattern
(Ricklefs 2010, Barbosa et al. 2012). However,
although autochoric is uncommon in Neotropical
forests (see Howe and Smallwood 1982, Talora and
Morellato 2000, Barbosa et al. 2012), these species
are important for forest fragments regeneration.
For example, Lopes et al. (2012) verified that, in
the absence of anemochoric and zoochoric species,
the succession of fragmented forests is driven by
the dynamics of some autochoric species, which
gradually move to more distant places. The results
show that the species of different layers of forest are
related to the type of dispersion and the aggregation
pattern, since the existence of a significant
interaction between the dispersion syndromes
and the spatial distribution patterns was verified.
The distribution of the dispersion syndromes and
the spatial distribution patterns of the species
presented significant differences in the analyzed
layers and most of the species showed a zoochoric
distribution and a tends to cluster distribution. The
anemochoric species characterized the pattern of
random distribution, followed by the autochoric
species with clustered distribution pattern. We
conclude that further studies on the dispersion and
aggregation of tree species in neotropical forests
take into account the interaction between these
ecological traits.
ACKNOWLEDGMENTS
The authors are grateful to Universidade Regional
de Blumenau, Universidade Federal do Paraná, and
Conselho Nacional de Desenvolvimento Científico
e Tecnológico (CNPq) for their research fellowship
grant (306216/2013-2 and 141232/2018-8). We
also thank Luiz Henrique da Silva from FURB
Idiomas and Daiana Vogel for English review.
REFERENCES
ALMEIDA SR, WATZLAWICK LF, MYSZKA E AND VALERIO AF. 2008. Plants and dispersal syndromes of a remanent Mixed Ombrophilous Forest in a field system. Ambiência 4: 289-297.
ALVARES CA, STAPE JL, SENTELHAS PC, GONÇALVEZ JLM AND SPAROVEK G. 2014. Köppen’s climate classification map for Brazil. Meteorol Z 22: 711-728. APG IV. 2016. An update of the Angiosperm Phylogeny Group
classification for the orders and families of flowering plants: APG IV. Bot J Linn. Soc 181: 1-20.
BARBOSA JM, EISENLOHR PV, RODRIGUES MA AND BARBOSA KC. 2012. Ecologia da dispersão de sementes em florestas tropicais. In: Martins SV (Ed), Ecologia De Florestas Tropicais do Brasil, Viçosa: Editora UFV, p. 85-106.
BECKMAN NG AND ROGERS HS. 2013. Consequences of seed dispersal for plant recruitment in tropical forests: interactions within the seedscape. Biotropica 45: 666-681. BERRYMAN AA. 1999. Principles of population dynamics
and their application. Cheltenham: Stanley Thornes, 256 p. BOYER D, RAMOS-FERNÁNDEZ G, MIRAMONTES O, MATEOS JL, COCHO G, LARRALDE H, RAMOS H AND ROJAS F. 2006. Scale-free foraging by primates emerges from their interaction with a complex environment. Proc Biol Sci 273: 1743-1750.
BRAZILIAN FLORA. 2020. In construction. Rio de Janeiro Botanical Garden. Available in: < http://floradobrasil.jbrj. gov.br/ >. Accessed in: 21 Jun. 2017.
CARTES JL AND YANOSKY A. 2003. Dynamics of biodiversity loss in the Paraguayan Atlantic Forest: an introduction. In: Galindo-Lean C and Câmara IG (Eds), The Atlantic Forest of South America: biodiversity status, threats, and outlook. Washington: Island Press, p. 267-269. CAVALLERO L, AIZEN MA AND RAFFAELE E. 2012.
Endozoochory decreases environmental filtering imposed to seedlings. J Veg Sci 23: 677-689.
CHEBEZ JC AND HILGERT N. 2003. Brief history of conservation in the Paraná Forest. In: Galindo-Lean C and Câmara IG (Eds), The Atlantic Forest of South America: biodiversity status, threats, and outlook. Washington: Island Press, p. 141-159.
COX AS AND KESLER DC. 2012. Prospecting behavior and the influence of forest cover on natal dispersal in a resident bird. Behav Ecol 23: 1068-1077.
DE ANGELO C. 2009. El paisaje del Bosque Atlántico del Alto Paraná y sus efectos sobre la distribución y estructura poblacional del jaguar (Panthera onca) y el puma (Puma concolor), Buenos Aires: Universidad de Buenos Aires, 252 p.
FERREIRA PI, GOMES JP, BATISTA F, BERNARDI AP, COSTA NCF, BORTOLUZZI RLC AND MANTOVANI A. 2013. Potential species for recovery of permanent preservation areas in the highlands of Santa Catarina state, Brazil. Floresta Ambient 20: 173-182.
FOSTER RB. 1982. The seasonal rhythm of fruitfall on Barro Colorado Island. In: Leight EG et al. (Eds), The ecology of a tropical forest: seasonal rhytms and long-term changes. Washington: Smithsonian Institution Press, p. 151-172. FORGET PM, LAMBERT JE, HULME PE AND VANDER
WALL SB. 2005. Seed fate: Predation, dispersal and seedling establishment. Wallingford: CAB International, 432 p.
GASPER AL ET AL. 2013. Flora of the mixed ombrophyllous forest in Santa Catarina state, according of the forest and floristic inventory of Santa Catarina. Rodriguésia 62: 201-210.
GIOMBINI MI, BRAVO SP AND MARTÍNEZ MF. 2009. Seed dispersal of the palm Syagrus romanzoffiana by tapirs in the Semi-deciduous Atlantic Forest of Argentina. Biotropica 41: 408-413.
HOWE HF AND SMALLWOOD J. 1982. Ecology of seed dispersal. Ann Rev Ecolog Syst 13: 201-228.
HUANG CQ ET AL. 2007. Rapid loss of Paraguay’s Atlantic Forest and the status of protected areas: a landsat assessment. Remote Sens Environ 106: 460-466.
HUANG CQ ET AL. 2009. Assessment of Paraguay’s forest cover change using landsat observations. Glob Planet Chang 67: 1-12.
IBGE. 2012. Manual técnico da vegetação brasileira. Rio de Janeiro: Instituto Brasileiro de Geografia e Estatística, 275 p.
KANIESKI MR, LONGHI SJ, NARVAES IS, SOARES PRC, LONGHI-SANTOS T AND CALLEGARO RM. 2012. Diversidade e padrões de distribuição espacial de espécies no estágio de regeneração natural em São Francisco de Paula, RS, Brasil. Floresta 42: 509-518.
KERSTEN RA, BORGO M AND GALVÃO F. 2015. Floresta Ombrófila Mista: aspectos fitogeográficos, ecológicos e métodos de estudo. In: Eisenlohr PV et al. (Eds), Fitossociologia no Brasil: métodos e estudos de casos. Viçosa: Editora UFV, p. 156-182.
KLAUBERG C, PALUDO GF, BORTOLUZZI RLC AND MANTOVANI A. 2010. Floristics and structure of a
Mixed Rain Forest remnant on the Catarinense Plateau Biotemas 23: 35-47.
KLEIN RM. 1960. O aspecto dinâmico do Pinheiro Brasileiro. Sellowia 12: 17-44.
KLEIN RM. 1978. Mapa fitogeográfico do Estado de Santa Catarina. In: Flora Ilustrada Catarinense. Itajaí: R. Reitz, p. 1.
KNAPE J AND VALPINE P. 2012. Are patterns of density dependence in the Global Population Dynamics Database driven by uncertainty about population abundance? Ecol Lett 15: 17-23.
LIEBSCH D, MARQUES MCM AND GOLDENBERG R. 2008. How long does the Atlantic Rain Forest take to recover after a disturbance? Changes in species composition and ecological features during secondary succession. Biol. conserv. 141: 1717-1725.
LIEBSCH D, MIKICH SB, POSSETTE RFS AND RIBAS OS. 2009. Floristic survey and dispersal syndromes in Araucaria Forest remnants of Parana state, Brazil. Hoehnea 36: 233-248.
LIEBSCH D AND MIKICH SB. 2009. Reproductive phenology of plant species of Mixed Ombrophilous Forest in Paraná, Brazil. Rev Bras Bot 32: 375-391.
LOPES CGR, FERRAZ EMN, CASTRO CC, LIMA EN, SANTOS JMFF, SANTOS DM AND ARAÚJO EL. 2012. Forest succession and distance from preserved patches in the Brazilian semiarid region. For Ecol Manage 271: 115-123.
MAÇANEIRO JP, SEUBERT RC AND SCHORN LA. 2015. Phytosociology of a primary Subtropical Rain Forest in southern Brazil. Floresta 45: 555-566.
MAÇANEIRO JP, OLIVEIRA LZ, SEUBERT RC, EISENLOHR PV AND SCHORN LA. 2016a. More than environmental control at local scales: do spatial processes play an important role in fl oristic variation in subtropical forests? Acta Botanica Brasilica 30: 183-192.
MAÇANEIRO JP, SEUBERT RC, HEILMANN A AND SCHORN LA. 2016b. Regeneration of a Mixed Ombrophilous Forest on the Santa Catarina Plateau. Biotemas 29: 31-42.
MCGUINNES WG. 1934. The relation between frequency index and abundance as applied to plant populations in a semiarid region. Ecology 15: 263-282.
NARBONA E, ARISTA M AND ORTIZ PL. 2005. Explosive seed dispersal in two perennial Mediterranean Euphorbia
species (Euphorbiaceae). Am J Bot 92: 510-516.
NASCIMENTO ART, LONGHI SJ AND BRENA DA. 2001. Structure and spatial distribution patterns of tree species in a Mixed Ombrophylous Forest sample in Nova Prata, RS. Ciênc Florest 11: 105-119.
consequences for recruitment. Trends Ecol Evol 15: 278-285.
NATHAN R, SAFRIEL UN AND NOY-MEIR I. 2001. Field validation and sensitivity analysis of a mechanistic model for tree seed dispersal by wind. Ecology 82: 374-388. NATHAN R AND KATUL GG. 2005. Foliage shedding in
deciduous forests lifts up long-distance seed dispersal by wind. Proc Natl Acad Sci USA 102: 8251-8256.
NATHAN R. 2006. Long-distance dispersal of plants. Science 313: 786-788.
NEGRINI M, AGUIAR MD, VIEIRA CT, SILVA AC AND HIGUCHI P. 2012. Dispersion, spatial distribution and vertical stratification of the tree community in a forest fragment in “Planalto Catarinense” region. Rev. Árvore 36: 919-929.
PADILHA DL, LOREGIAN AC AND BUDKE JC. 2015. Forest fragmentation does not matter to invasions by
Hovenia dulcis. Biodivers Conserv 24: 2293-2304. PAISE G AND VIEIRA EM. 2005. Fruit production and
spatial distribution of animal-dispersed angiosperms in a Mixed Ombrophilous Forest in State of Rio Grande do Sul, Brazil. Rev Bras Bot 28: 615-625.
PANDOLFO C, BRAGA HJ, SILVA JÚNIOR VP, MASSIGNAN AM, PEREIRA ES, THOMÉ VMR AND VALCI FV. 2002. Atlas Climatológico do Estado de Santa Catarina. Florianópolis: Epagri. 1 CD-ROM.
PIJL LVD. 1982. Principles of dispersal in higher plants. New York: Springer-Verlag, 218 p.
PPG I. 2016. A community-derived classification for extant lycophytes and ferns. J Syst Evol 54: 563-603.
REIS MS ET AL. 2012. Distribuição da diversidade genética e conservação de espécies arbóreas em remanescentes florestais de Santa Catarina. In: Vibrans AC et al. (Ed), Inventário Florístico Florestal de Santa Catarina: Diversidade e Conservação dos remanescentes florestais. Blumenau: Edifurb, p. 143-169.
REITZ R AND KLEIN RM. 1966. Araucariáceas. In: Reitz R (Ed), Flora Ilustrada Catarinense. Itajaí: Herbário Barbosa Rodrigues, p. 1-62.
RIBEIRO MC, MARTENSEN AC, METZGER JP, TABARELLI M, SCARANO F AND FORTIN MJ. 2011. The Brazilian Atlantic forest: a shrinking biodiversity hotspot. In: Zachos FE and Habel JC (Eds), Biodiversity hotspots. Heidelberg: Springer, p. 405-434.
RICKLEFS RE. 2010. A Economia da Natureza. Rio de Janeiro: Guanabara Koogan, 572 p.
SCHUPP EW, MILLERON T AND RUSSO SE. 2002. Dissemination limitation and the origin and maintenance
of species-rich tropical forests. In: Levey DJ et al. (Eds), Seed Dispersal and Frugivory: Ecology, Evolution and Conservation. New York: CABI Publishing, p. 19-33. SEIDLER TG AND PLOTKIN JB. 2006. Seed dispersal and
spatial pattern in tropical trees. PLoS Biol 4: 2132-2137. SEVEGNANI L, VIBRANS AC AND GASPER AL. 2012.
Considerações finais sobre a Floresta Ombrófila Mista em Santa Catarina. In: Vibrans AC et al. (Eds), Inventário Florístico Florestal de Santa Catarina: Floresta Ombrófila Mista. Blumenau: Edifurb, p. 275-278.
SILVA KE, MARTINS SV, SANTOS NT AND RIBEIRO CAAS. 2012. Padrões espaciais de espécies arbóreas tropicais. In: Martins SV (Eds), Ecologia de Florestas Tropicais do Brasil, p. 326-354.
STEHMANN JR, FORZZA RC, SALINO A, SOBRAL M, COSTA DP AND KAMINO LHY. 2009. Plantas da Floresta Atlântica. Rio de Janeiro: Instituto de Pesquisas Jardim Botânico do Rio de Janeiro, 516 p.
TABARELLI M, AGUIAR AV, RIBEIRO MC, METZGER JP AND PERES CA. 2010. Prospects for biodiversity conservation in the Atlantic Forest: Lessons from aging human-modified landscapes. Biol Conserv 10: 2328-2340. TALORA DC AND MORELLATO PC. 2000. Phenology of
coastal-plain forest tree from Southeastern Brazil. Rev Bras Bot 23: 13-26.
TRAVESET A, HELENO R AND NOGALES M. 2014. The ecology of seed dispersal. In: Gallagher RS (Eds), Seeds: the ecology of regeneration in plant communities. London: CABI Publishing, p. 62-93.
VANDER WALL SB, KUHN KM AND BECK MJ. 2005. Seed removal, seed predation, and secondary dispersal. Ecology 86: 801-806.
VIBRANS AC, MCROBERTS RE, LINGNER DV, NICOLETTI AL AND MOSER P. 2012. Extensão original e remanescentes da Floresta Ombrófila Mista em Santa Catarina. In: Vibrans AC et al. (Eds), Inventário Florístico Florestal de Santa Catarina: Floresta Ombrófila Mista. Blumenau: Edifurb, p. 25-31.
VIBRANS AC, MCROBERTS RE, MOSER P. AND NICOLETTI AL. 2013. Using satellite image-based maps and ground inventory data to estimate the area of the remaining Atlantic forest in the Brazilian state of Santa Catarina. Remote Sens Environ 130: 87-95.
WILSON RJ, THOMAS CD, FOX R, ROY DB AND KUNIN WE. 2004. Spatial patterns in species distributions reveal biodiversity change. Nature 432: 393-396.