Acta Scientiarum
http://www.uem.br/acta ISSN printed: 1679-9275 ISSN on-line: 1807-8621
Doi: 10.4025/actasciagron.v38i4.30855
Effects of row spacing and nitrogen topdressing fertilization on the
yield of upland rice in a no-tillage system
Mabio Chrisley Lacerda and Adriano Stephan Nascente*
1
Embrapa Arroz e Feijão, Rod. GO-462, Km 12, Cx. Postal 179, 75375-000, Fazenda Capivara, Santo Antônio de Goiás, Goiás, Brazil. *Author for correspondence. Email: [email protected]
ABSTRACT. This study aimed to evaluate the effect of row spacing and nitrogen topdressing fertilization of two materials (genotype 07SEQCL441 CL and cultivar BRS Esmeralda) on the plant height, yield components, grain yield, and quality of an upland rice crop grown in a no-tillage system. Trials were conducted for two growing seasons under field conditions in a 3 x 4 factorial, randomized, complete block design, with four replications. For each material, treatments consisted of the combination of row spacing (0.225, 0.35, and 0.45 m) with nitrogen (N) applied as topdressing (0, 50, 100, and 150 kg ha-1). The lowest
row spacing (0.225 m) for genotypes 07SEQCL441 CL and BRS Esmeralda provided a higher number of tillers, number of panicles m-2, and grain yield of rice. Increasing rates of N in the topdressing improved
the rice grain yield for both cultivars, but for 07SEQCL441 CL, the grain yield was positively affected only to applications up to 50 kg N ha-1. Row spacing and N rates did not affect the rice grain quality. Therefore,
these results indicate that the narrowest row spacing used (0.225 m) with N fertilization as topdressing increased the rice grain yield most in the no-tillage system.
Keywords:Oryza sativa L., plant population, NTS, Cerrado.
Espaçamento e adubação de cobertura com nitrogênio afetando produtividade do arroz de
terras altas em sistema de plantio direto
RESUMO. O estudo teve como objetivo estudar o efeito do espaçamento e adubação nitrogenada em cobertura de dois materiais (genótipos 07SEQCL441 CL e BRS Esmeralda) na altura de planta, componentes de produção, produtividade e qualidade de grãos no arroz de terras altas em sistema plantio direto. Os experimentos de campo foram conduzidos em duas safras em blocos completos casualizados, em esquema fatorial 3 x 4, com quatro repetições. Para cada material, os tratamentos consistiram na combinação de espaçamentos entrelinhas (0,225; 0,35 e 0,45 m) com doses de nitrogênio (N) aplicadas em cobertura (0, 50, 100 e 150 kg ha-1). O menor espaçamento entrelinhas (0,225 m) para os genótipos 07
SEQCL441 CL e BRS Esmeralda proporcionaram maior número de perfilhos, número de panículas m-2, e
produtividade de arroz. O aumento das doses de N na adubação de cobertura melhorou a produtividade nas duas cultivares, mas para 07SEQCL441 CL a produtividade de grãos foi positivamente impactada até a dose de 50 kg N ha-1. Espaçamento entrelinhas e doses de N não afetou a qualidade de grãos de arroz.
Portanto, esses resultados indicam que o espaçamento mais estreito (0,225 m) com adubação nitrogenada em cobertura aumentou mais a produtividade do arroz em sistema plantio direto.
Palavras-chave:Oryza sativa L., população de plantas, SPD, Cerrado.
Introduction
The majority of rice cultivated in the world is under flooded conditions (Prasad, 2011). Upland rice is cultivated in Asia, Africa, and the Americas (Nascente, Crusciol, & Cobucci, 2013). However, as water availability for rice irrigation by flooding decreases, mainly in China and India, upland rice cultivation is increasing in importance (Feng et al., 2007; Prasad, 2011). According to Bouman et al. (2007), irrigated lowland rice receives approximately 24 to 30% of the freshwater consumed worldwide, and these rice systems are threatened because of the
increasing demand for freshwater by humans, industry, and animals. Therefore, the development of technologies that conserve water, such as growing rice under aerobic conditions in a no-tillage system (NTS) instead of flooding (Nascente et al., 2013), would augment and stabilize upland rice yields in addition to consuming less water (Crusciol, Soratto, & Mateus, 2006; Heinemann, Stone, & Fageria, 2011).
2008). Proper row spacing depends on the interactions among cultivars, crop management, and the environment. Upland rice crops under conventional tillage (plowing and disking) is recommended with a range in distance of 0.40-0.50 m between rows and a seeding rate of 60 to 70 seeds per meter (Santos, Stone, & Vieira, 2006). However, with the introduction of modern varieties of rice with upright leaves and intermediate height, we have to study the proper row spacing in an NTS because rice plants grown under this soil management typically exhibit slower growth, which encourages weed infestation that negatively affects the grain yield (Nascente et al., 2013). For example, for the cultivar BRSMG Conai, Carvalho et al. (2008) found that increased productivity under an NTS was obtained at row spacing of 0.30 m. In this sense, under an NTS, upland rice cultivars may need smaller row spacing to avoid the infestation of weeds and subsequent reduced productivity and to provide better use of environmental resources (Jadoski, Carlesso, Petry, Woishick, & Cervo, 2000).
The application of larger amounts of nitrogen at sowing time with reduced spacing can perform as a starter and allow an early closed canopy, thus reducing weed infestation (Fageria, 2014). However, if nitrogen is reported to provide significant increases in the productivity of upland rice grain (Arf et al., 2005; Cazetta, Arf, Buzetti, Sá, & Rodrigues, 2008; Cancellier et al., 2011; Nascente et al., 2011), then nitrogen applied at rates higher than recommended could create adequate conditions for the overgrowth of plants and thus increase lodging (Arf et al., 2005; Nascimento et al., 2009; Alvarez, Crusciol, Nascente, Rodrigues, & Habermann, 2012). Furthermore, the excess of N may enable the development of diseases and adversely affect grain yield (Crusciol et al., 2006; Marzari et al., 2007).
The appropriate combination of row spacing with nitrogen rate can provide significant increases in grain yield of upland rice. However, few studies have evaluated these two variables, especially for new rice cultivars with types of intermediate plants (plants with high height and susceptible to lodging when grown on fertile soils or when fertilized with high rates of N) and modern plants (smaller plants and less susceptible to lodging). The objective of this study was to determine the effect of row spacing and nitrogen topdressing fertilization on the plant height, yield components and grain yield, and quality of two new genotypes of upland rice cultivated under no-tillage systems.
Material and methods
Site description
The experiments were conducted at Capivara Farm of the Embrapa Rice and Beans Unit, which is located in Santo Antônio de Goiás, Goiás State, Brazil, at 16º28'00"S and 49º17'00"W and 823 m of elevation. The climate is tropical savanna and is considered Aw according to the Köppen classification. There are two well-defined seasons: a normally dry season from May to September (autumn/winter) and a rainy season from October to April (spring/summer). The average annual rainfall is between 1,500 and 1,700 mm, and the average annual temperature is 22.7°C, ranging annually from 14.2 to 34.8°C. During the period of this study, the temperature and the amount of rainfall data were recorded (Figure 1).
The soil is classified as a clay loam (kaolinitic, thermic Typic Haplorthox) acidic soil. Prior to the study, in 2012 and 2013, chemical analyses were performed in a depth range of 0-0.20 m for the initial characterization of the area (Table 1). Chemical analyses were performed according to the methodology proposed by Claessen (1997).
The experimental area had been cultivated in a crop-livestock integration using a no-tillage system for seven consecutive years, followed by a crop rotation program of soybean (summer), rice (summer) and irrigated common bean (winter), corn + Brachiaria (summer), and two years of grazing pasture. The installation of experiments was conducted in plots where the upland rice was the crop to be grown following the established program of crop rotation.
Experimental design and treatments
Two trials were conducted in rainfed conditions: one with the mutant line 07SEQCL441 CL, which was derived from a Primavera variety and was resistant to the Imazapyr + Imazapic herbicide, and other, the BRS Esmeralda, which is commonly used by farmers in Brazil. Trials were arranged in a factorial, randomized, complete block design with four replications during two growing seasons (2012/13 and 2013/14). The treatments consisted of the combination of three row spacings (0.225, 0.35, and 0.45 m) with four rates of nitrogen (0, 50, 100, and 150 kg N ha-1) applied as topdressing
Row spacing and nitrogen in rice 495
Table 1. Chemical characteristics of soil in the experimental areas. Growing seasons 2012/13 and 2013/14.
Growing season 2012/13
Ca Mg Al H+Al K CEC pH (CaCl2)
---cmolc kg-1---
3.4 1.5 0.0 3.1 0.16 8.16 5.6
BS¹ SOM² P Zn Cu Fe Mn
% g kg-1 ---mg kg-1---
62.00 35.7 15.8 3.8 2.3 27.1 34.3
Growing season 2013/14
Ca Mg Al H+Al K CEC pH (CaCl2)
---cmolc kg
-1---
3.2 1.4 0.0 3.7 0.38 8.68 4.9
BS SOM¹ P Zn Cu Fe Mn
% g kg-1
---mg kg-1
---
57.37 27.0 7.7 5.4 2.0 32.0 26.0
¹BS – Base saturation, ²SOM – soil organic matter.
Rice crop management
Cover crops were desiccated with a glyphosate application (1.8 kg ha-1 acid equivalent) 30 days before
sowing of the upland rice. The sowing was performed mechanically using 230 seeds m-2 of rice. The seed was
sown on December 2, 2012 and on December 5, 2013. Rice plant emergence occurred five days after sowing for the growing seasons. The base fertilization, to be applied in the sowing furrows, was calculated according to the soil chemical characteristics and the recommendations of Sousa and Lobato (2003). Therefore, sowing fertilization was 15 kg ha-1 of N as
urea, 90 kg ha-1 of P
2O5 as triple superphosphate, and
45 kg ha-1 of K
2O, as potassium chloride, in both years.
Nitrogen topdressing fertilization (as urea) was done 40 days after the rice emergence, according to each treatment. Cultural practices were performed according to standard recommendations for a rice crop to keep the area free from weeds, diseases, and insects.
Trait Measurements
Rice harvest was carried out by hand after physiological maturity (March 21, 2013 and March 25, 2014) of the grain in the usable area of each plot. Plots were evaluated for the plant height (m), which was determined by measuring five plants per plot at the time when the crop was at the phonological stage of pasty grains, with the distance between the soil surface and the top end of the highest panicle being recorded; the number of panicles m-1, which was determined by
counting the number of panicles within 1.0 linear m of one of the rows in the useful area of each plot; the mass of 1000 grains, which was randomly evaluated by collecting and weighing 1000 grains from each plot, corrected to 13% of water content; and the grain yield, which was determined by weighing the harvested grain of each plot, corrected to 13% of the water content and converted to kg ha-1.
The milling yield was determined only in the 2014/14 growing season by collecting a sample of 100 g of rice grains in each plot, which was processed in a test mill for 1 minute; then, the polished grains were weighed, and the value obtained was regarded as the effective performance, with the results being expressed as a percentage. Subsequently, these polished grains were placed on a grain "Trieur" 2 machine, and the separation of the grains was processed for 30 seconds; the grains remaining in the "Trieur" were weighed to obtain the yield of broken grains, which was also expressed as a percentage.
Statistical analysis
For statistical analysis, the SAS Statistical Software, SAS Institute, Cary, NC, USA (SAS
Institute, 1999) was used. In qualitative variables (upland rice yield components, grain yield, milling yield, and broken grains), data were subjected to an analysis of variance, and when the F test proved significant, the data were compared by a Tukey test at p < 0.05. In this case, the factor was row spacing. In the quantitative variables (N rates), results were submitted to regression analysis when p < 0.05.
Results and discussion
Row spacing
The row spacing significantly affected the number of tillers, number of panicles, and grain yield of the genotype 07SEQCL441 (Table 2) and the number of tillers, plant height, number of panicles, and grain yield for the genotype BRS Esmeralda (Table 3). In the narrowest spacing (0.225 m), the highest number of tillers (365 tillers m-2 for genotype 07SEQCL441 and 314 tillers m-2
for BRS Esmeralda), plant height (95.5 m for genotype BRS Esmeralda), number of panicles (364 panicles m-2 for genotype 07SEQCL441 and 314
panicles m-2 for BRS Esmeralda), and grain yield
(4129 kg ha-1 for genotype 07SEQCL441 and 4,697
kg ha-1 for BRS Esmeralda) were found.
Nitrogen rates
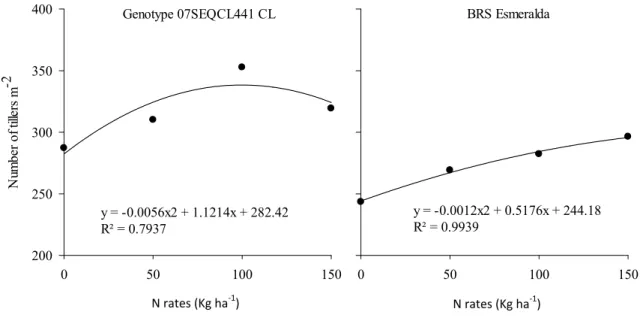
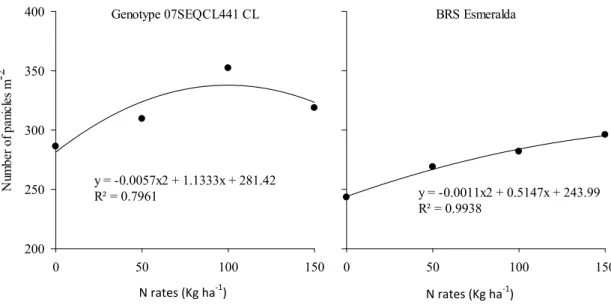
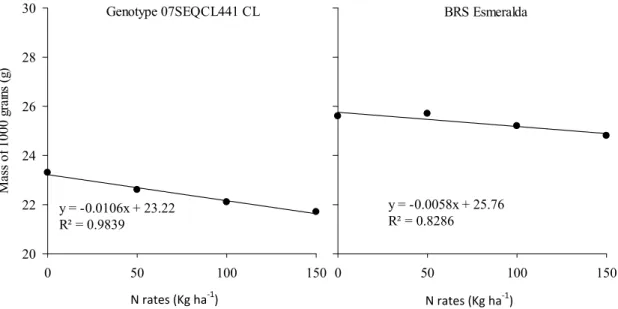
The rate of nitrogen application provided a significant effect on the number of tillers and panicles for both genotypes (Tables 2 and 3), with a quadratic effect (Figures 2 and 3) being observed. Increasing nitrogen rates provided a significant increase in the plant height with the linear fit of the data equation for both genotypes (Figure 4). Nitrogen rates contributed to a decrease in the mass of 1,000 grains for both genotypes (Table 2 and 3), with data fit to quadratic regressions (Figure 5). The genotype 07SEQCL441 CL had a quadratic response with higher yield approximately 50 kg ha-1 of N,
whereas the genotype BRS Esmeralda had a linear response, and the rate of 150 kg ha-1 was not
enough to allow the total potential of this genotype (Figure 6). The row spacing and nitrogen rates did not significantly affect the milling yield or the broken grains for either genotype (Tables 4 and 5).
Growing seasons
Row spacing and nitrogen in rice 497
Table 2. Plant height (PH), number of tillers (NT), number of panicles m-2 (PAN), mass of 100 grains (MGRAIN), and grain yield (YIELD) of the upland rice genotype 07SEQCL441 CL in a no-tillage system as a function of row spacing and nitrogen rates. Santo Antônio de Goiás, Brazil. Growing seasons 2012/13 and 2013/14.
Treatments NT PH PAN MGRAIN YIELD
Row spacing no. m-2 cm no. m-2 g kg ha-1
0.225 m 365 a 100.6 364 a 22.5 4129 a
0.35 m 311 b 100.4 310 b 22.3 3431 b
0.45 m 274 c 99.1 274 c 22.6 3374 b
Growing season
2012/13 330 a 91.1 b 329 a 22.7 a 3753 a
2013/14 304 b 109.0 a 304 b 22.2 b 3536 b
Factors ANOVA – F Probability
Row spacing (RS) <0.0001 0.092 <0.0001 0.083 <0.0001
N rates (NR) 0.002 0.039 0.002 <0.0001 0.002
Growing season (GS) 0.027 <0.0001 0.030 <0.0001 0.034
RS x NR 0.907 0.676 0.904 0.424 0.801
RS x GS 0.048 0.045 0.052 0.813 0.039
NR x GS 0.067 0.764 0.064 0.429 0.489
NR x RS x GS 0.134 0.979 0.137 0.852 0.814
¹Means followed by the same letter in a column do not differ by Tukey’s test for p ≤ p 0.05.
Table 3. Plant height (PH), number of tillers (NT), number of panicles m-2
(PAN), mass of 100 grains (MGRAIN), and grain yield (YIELD) of upland rice genotype BRS Esmeralda in a no-tillage system as a function of row spacing and nitrogen rates. Santo Antônio de Goiás, Brazil. Growing seasons 2012/13 and 2013/14.
Treatments NT PH PAN MGRAIN YIELD
Row spacing no. m-2
cm no. m-2
g kg ha-1
0.225 m 314 a 95.5 a 314 a 25.4 4697 a
0.35 m 265 b 92.6 b 265 b 25.1 4215 b
0.45 m 241 bc 91.1 b 241 bc 25.6 3961 c
Growing season
2012/13 298 a 82.9 b 297 a 24.1 b 4083 b
2013/14 248 b 103.2 a 248 b 26.6 a 4482 a
Factors ANOVA – F Probability
Row spacing (RS) <0.0001 <.0001 <0.0001 0.2278 0.0002
N rates (NR) 0.0003 <.0001 0.0003 0.0286 0.0071
Growing season (GS) <0.0001 <.0001 <0.0001 <0.0001 0.0056
RS x NR 0.5271 0.5606 0.5387 0.8019 0.8730
RS x GS 0.5865 0.3029 0.5824 0.7654 0.0352
NR x GS 0.2103 0.1449 0.2058 0.7492 0.5996
NR x RS x GS 0.8014 0.0390 0.8147 0.6150 0.4217
¹Means followed by the same letter in a column do not differ by Tukey’s test for p ≤ 0.05.
Genotype 07SEQCL441 CL
N rates (kg.ha-1)
0 50 100 150
N
um
b
er
of
t
ill
er
s m
-2
200 250 300 350
400 BRS Esmeralda
N rates (kg.ha-1)
0 50 100 150
y = -0.0056x2 + 1.1214x + 282.42 R² = 0.7937
y = -0.0012x2 + 0.5176x + 244.18 R² = 0.9939
Figure 2. Number of tillers of rice plants of the genotypes 07SEQCL441 CL and BRS Esmeralda in a no-tillage system as a function of the nitrogen rate. Santo Antônio de Goiás, Brazil. Growing seasons 2012/13 and 2013/14.
Genotype 07SEQCL441 CL
N rates (kg.ha-1)
0 50 100 150
N
um
b
er
of
pan
icl
es
m
-2
200 250 300 350
400 BRS Esmeralda
N rates (kg.ha-1)
0 50 100 150
y = -0.0057x2 + 1.1333x + 281.42
R² = 0.7961 y = -0.0011x2 + 0.5147x + 243.99
R² = 0.9938
Figure 3. Number of panicles of the rice plants of the genotypes 07SEQCL441 CL and BRS Esmeralda in a no-tillage system as a function of the nitrogen rate. Santo Antônio de Goiás, Brazil. Growing season 2013/14.
Genotype 07SEQCL441 CL
N rates (kg.ha-1)
0 50 100 150
P
la
nt
he
ig
ht
(
c
m
)
80 90 100 110
BRS Esmeralda
N rates (kg.ha-1)
0 50 100 150
y = -0.0002x2 + 0.0372x + 98.61 R² = 0.9209
y = -0.0002x2 + 0.0556x + 90.28 R² = 0.9903
Figure 4. Plant height (cm) of rice plants of the genotypes 07SEQCL441 CL and BRS Esmeralda in a no-tillage system as a function of the nitrogen rate. Santo Antônio de Goiás, Brazil. Growing seasons 2012/13 and 2013/14.
Table 4. Milling yield (MY) and broken grains (BG) of rice plants in the genotype 07SEQCL441 CL in a no-tillage system as a function of the row spacing and nitrogen rate. Santo Antônio de Goiás, Brazil. Growing season 2013/14.
Treatments MY BG
Row spacing ---%---
0.225 m 67.5 5.3
0.35 m 67.6 5.8
0.45 m 67.9 5.8
Factors ANOVA – F Probability
Row spacing (RS) 0.9379 0.7927
N rates (NR) 0.2543 0.3223
RS x NR 0.9867 0.9693
¹Means followed by the same letter in a column do not differ by Tukey’s test for p ≤ 0.05.
Table 5. Milling yield (MY) and broken grains (BG) of rice plants of the genotype BRS Esmeralda in a no-tillage system as a function of the row spacing and nitrogen rates. Santo Antônio de Goiás, Brazil. Growing season 2013/14.
Treatments MY BG
Row spacing ---%---
0.225 m 61.2 9.9
0.35 m 62.2 8.8
0.45 m 63.7 8.8
Factors ANOVA – F Probability
Row spacing (RS) 0.2441 0.3248
N rates (NR) 0.3472 0.0653
RS x NR 0.7943 0.5484
¹Means followed by the same letter in a column do not differ by Tukey’s test for p ≤ 0.05.
N rates (Kg ha‐1) N rates (Kg ha‐1)
Row spacing and nitrogen in rice 499
Genotype 07SEQCL441 CL
N rates (kg.ha-1)
0 50 100 150
M
as
s of
1000
g
ra
in
s (
g)
20 22 24 26 28
30 BRS Esmeralda
N rates (kg.ha-1)
0 50 100 150
y = -0.0058x + 25.76 R² = 0.8286 y = -0.0106x + 23.22
R² = 0.9839
Figure 5. Mass of 1000 grains (g) of rice plants of the genotypes 07SEQCL441 CL and BRS Esmeralda in a no-tillage system as a function of the nitrogen rate. Santo Antônio de Goiás, Brazil. Growing seasons 2012/13 and 2013/14.
BRS Esmeralda
N rates (kg.ha-1)
0 50 100 150
Genotype 07SEQCL441 CL
N rates (kg.ha-1)
0 50 100 150
Yie
ld
(
k
g.
ha
-1 )
3000 3500 4000 4500 5000
Y= -0.0627x2 + 7.2202x + 3651 R² = 0.9911
Y=4.4258x + 3952.4 R² = 0.9995
Figure 6. Yield (kg ha-1) of rice plants of the genotypes 07SEQCL441 CL and BRS Esmeralda in a no-tillage system as a function of the nitrogen rate. Santo Antônio de Goiás, Brazil. Growing seasons 2012/13 and 2013/14.
No interaction was observed between the row spacing and N rates. Therefore, we discussed the single effects of each factor.
Row spacing
The resulting greater values of the variables in the smallest row spacing may reflect the greater competition among plants in the larger row spacing (0.45 m), as the population per square meter for both genotypes was the same in all row spacing (230 seeds m-2). Therefore, the greater row spacing (0.45
m) had the highest number of plants per row and provided more competition among them. On the
other hand, in the smallest row spacing (0.225 m), a better distribution of the plants occurred in the area. According to Jadoski et al. (2000) and Freitas, Nascente, and Santos (2013), a larger number of plants provides increased competition for light and photoassimilates. According to Sangoi (2001), plants equidistantly spaced compete minimally for nutrients, light, and other factors. Jadoski et al. (2000) also observed that reduced spacing, within certain limits, provides a more equidistant distribution between plants to reduce the competition for environmental resources, thus more completely and efficiently exploiting a given area of
N rates (Kg ha‐1) N rates (Kg ha‐1)
soil. Therefore, we can infer that for these genotypes (07SEQCL441 CL and BRS Esmeralda) the row spacing of 0.225 m provided better distribution of the plants in the area and allowed higher grain yield than the other row spacing (0.45 and 0.35 m). Furthermore, the low plant competition in the narrowest row spacing (0.225 m) in comparison to the other row spacings, allows an increase in the number of tillers and, as a result, the number of panicles per area and grain yield. Freitas et al. (2013) reported that larger row spacing entails the reduction in the solar radiation trapping efficiency per area and can provide increased yield per plant; however, a reduction in the productivity per area also occurs. Conversely, the smallest row spacing provides a higher yield per unit area and reductions in the productivity per individual. We provided proper weed control, which was not tested in this research, and therefore, an evaluation of the influence of row spacing on weed infestation was not possible.
The rice grain yield is determined by three components: the number of panicles m-2, number of
grain spikelets per panicle, and mass of 1,000 grains (Yoshida, 1981). Thus, from the results obtained of the higher number of panicles m-2, rice cultivation
in the row spacing of 0.225 m was expected to provide the highest yield, which was confirmed, as the highest values were observed (4,129 kg ha-1 for
genotype 07SEQCL441 CL and 4,697 kg ha-1 for
genotype BRS Esmeralda) under this condition (Table 3). Carvalho et al. (2008) also observed higher grain yield in the cultivar BRSMG Conai at the narrowest row spacing (0.30 m) compared to the greatest row spacing (0.40 m).
Nitrogen rates
Nitrogen had a marked effect on the number of tillers and panicles for both genotypes. According to Larrosa, Felipe, Marchezan, Aita, and Coradini (2001), nitrogen application increases the number of tillers and panicles. Nitrogen is essential for cell structures and functions, for all enzymatic reactions in the plant, and for part of the chlorophyll molecule (photosynthesis), among other functions (Fageria, 2014). Therefore, increasing the N rates likely provided better conditions for plant growth and improved the number of tillers and panicles per area.
According to Arf et al. (2005), nitrogen is the nutrient that most affects plant height. Corroborating this information, Buzetti et al. (2006); Hernandes, Buzetti, Andreotti, Arf, and Sá (2010); and Mattje, Fidelis, Aguiar, Brandão, and
Santos (2013) also reported significant increases in the height of rice plants with increasing rates of N. Despite this increase in plant height, no lodging was observed. Nitrogen can make plants more susceptible to lodging, as reported by Fidelis et al. (2012). However, the genotypes used showed great resistance to lodging under high rates of nitrogen application. Moreover, under the NTS, plants grow less than with conventional tillage (Nascente et al., 2013), and in this study, the plants probably did not grow high enough to cause lodging.
The nitrogen rates provided decreases in the mass of 1,000 grains for both genotypes. This may have occurred because, when the number of panicles increases, a tendency occurs for the mass of grains to decrease (Santos et al., 2006). The grain yield showed a positive effect from increasing N rates. Increased N rates typically provide significant increases in the productivity of rice grains, as reported by several authors (Arf et al., 2005; Cazetta et al., 2008; Cancellier et al., 2011; Nascente et al., 2011). The current results show that the genotypes responded differently to the nitrogen rates. Lower rates of N were required for 07SEQCL441 CL to achieve high yield (approximately 3,900 kg ha-1)
compared to BRS Esmeralda, which required higher rates of N (150 kg ha-1) to achieve higher grain yield
(>4,500 kg ha-1).
In both years, the rice grain yield without N application was high (3,659 and 3,947 kg ha-1 for the
growing season 2012/13 and 2013/14, respectively). This yield could be attributable to the high soil fertility of the places where the trials were performed (Table 1, Sousa & Lobato, 2003). According to Santos et al. (2006), in soils with high fertility and adequate soil moisture (Figure 1), rice can achieve high grain yields, as observed in this study. Furthermore, the high soil fertility resulted from the use of the areas for crop-livestock rotation, where an input of soil organic matter occurs every year.
Row spacing and nitrogen in rice 501
neither the spacing nor the N levels affect the quality of rice grain. Neves, Buzetti, Arf, and Sá (2004); Marzari et al. (2007); and Artigiani, Crusciol, Arf, Alvarez, and Nascente (2012) also reported no effect of the N application rate on the grain quality of rice. In addition, Santos, Castro, Soares, and Cornélio (2002) reported no response in the quality of upland rice grain due to row spacing.
Growing seasons
The higher grain yield achieved by the genotype 07SEQCL441 CL in the 2012/2013 growing season could be explained by the higher number of panicles m-2 and grain mass obtained in this growing season.
On the other hand, for the genotype BRS Esmeralda, which yielded more in the growing 2013/2014 season, the higher grain yield could be due to the greater mass of 1,000 grains in the growing season 2013/14 compared to 2012/13. Regarding rainy conditions, in both years, the amount of rain and its distribution was appropriate to the development of the upland rice. According to Reichardt (1987), rice plants need from 450 to 700 mm of rain, during the crop cycle. In our trials, 937.4 and 1044.8 mm of rain was recorded for the 2012/2013 and 2013/2014 growing seasons, respectively. In addition, Rodrigues, Soratto, and Arf (2004) suggested that the rainfall should be well distributed during the crop cycle, and such distributions of rain were observed in both years of the current study (Figure 1).
Conclusion
The 0.225 m row spacing provided the highest yield of the upland rice grain, and the nitrogen application rates allowed increasing yield of the upland rice grain for both genotypes. However, for the genotype 07SEQCL441 CL, the yield increased only until reaching the rate of 50 kg N ha-1.
Therefore, row spacing and nitrogen rates do not affect the grain quality of rice.
References
Alvarez, R. C. F., Crusciol, C. A. C., Nascente, A. S., Rodrigues, J. D., & Habermann, G. (2012). Gas exchange rates, plant height, yield components, and productivity of upland rice as affected by plant regulators. Pesquisa Agropecuária Brasileira, 47(10), 1455-1461.
Arf, O., Bastos, J. C. H. A. G., Silva, M. G., Sá, M. E., Rodrigues, R. A. F., & Buzetti, S. (2005). Manejo do solo e época de aplicação de nitrogênio na produção de arroz de terras altas. Acta Scientiarum. Agronomy, 27(2), 215-223.
Artigiani, A. C. C. A., Crusciol, C. A. C., Arf, O., Alvarez, R. C. F., & Nascente, A. S. (2012). Upland rice yield and milled quality as affected by hydric availability and fertilization. Pesquisa Agropecuária Tropical, 42(3), 340-349. Bouman, B. A. M., Feng, L., Tuong, T. P., Lu, G., Wang,
H., & Feng, Y. (2007). Exploring options to grow rice using less water in northern China using a modeling approach II: Quantifying yield, water balance components, and water productivity. Agricultural and Water Management, 88(1-3), 23-33.
Buzetti, S., Bazanini, G. C., Freitas, J. G., Andreotti, M., Arf, O., Sá, M. E., & Meira, F. A. (2006). Response of rice cultivars to nitrogen and growth regulator chlormequat chloride. Pesquisa Agropecuária Brasileira,
41(12), 1731-1737.
Cancellier, E. L., Barros, B. H., Kischel, E., Gonzaga, L. A. M., Brandão, D. R., & Fidelis, R. R. (2011). Agronomic efficiency of mineral nitrogen by upland rice cultivars. Revista Brasileira de Ciências Agrárias, 6(4), 650-656.
Carvalho, J. A., Soares, A. A., & Reis, M. S. (2008). Effect of sowing spacing and density on yield and production components of rice cultivar BRSMG Conai. Ciência e Agrotecnologia, 32(3), 785-791.
Cazetta, D. A., Arf, O., Buzetti, S., Sá, M. E., & Rodrigues, R. A. F. (2008). Performance of upland rice to the nitrogen rates after different cover crops in no-till system. Bragantia, 67(2), 471-479.
Claessen, M. E. C. (1997). Manual de métodos de análise de solo, (2a ed.). Rio de Janeiro, RJ: Embrapa Solos. Crusciol, C. A. C., Soratto, R. P., & Mateus, G. P. (2006).
Yield of upland rice cultivars in rainfed and sprinkler-irrigated systems in the Cerrado region of Brazil.
Australian Journal of Experimental Agriculture, 46(11), 1515-1520.
Fageria, N. K. (2014). Nitrogen management in crop production. Boca Raton, FL: CRC Press.
Feng, L. P., Bouman, B. A. M., Tuong, T. P., Cabangon, R. J., Li, Y. L., Lu, G. A., & Feng, Y. H. (2007). Exploring options to grow rice under water-short conditions in northern China using a modeling approach. I: field experiments and model evaluation.
Agricultural Water Management, 88(1-3), 1-13.
Fidélis, R. R., Rodrigues, A. M., Silva, G. F., Barros, H. B., Pinto, L. C., & Aguiar, R. W. S. (2012). Nitrogen efficiency on upland rice genotypes. Pesquisa Agropecuária Tropical, 42(1), 124-128.
Freitas, R. J., Nascente, A. S., & Santos, F. L. S. (2013). Population of maize plants intercropped with Urochloa ruziziensis. Pesquisa Agropecuária Tropical, 43(1), 79-87. Heinemann, A. B., Stone, L. F., & Fageria, N. K. (2011).
Transpiration rate response to water deficit during vegetative and reproductive phases of upland rice cultivars. Scientia Agricola, 68(1), 24-30.
Jadoski, S. O., Carlesso, R., Petry, M. T., Woishick, D., & Cervo, L. (2000). Plant population and row spacing for irrigated drybean. I: plant morphological characteristics. Ciência Rural, 30(4), 559-565.
Larrosa, M., Felipe, R., Marchezan, E., Aita, C., & Coradini, J. Z. (2001). Efficiency of nitrogen application on rice tillering under water management systems. Ciência Rural, 31(5), 745-749.
Marzari, V., Marchezan, E., Silva, L. S., Villa, S. C. C., Santos, F. M., & Teló, G. M. (2007). Plant densities, nitrogen rates and foliar fungicide on grain production of irrigated rice. II. Seed and grain quality. Ciência Rural, 37(4), 936-941.
Mattje, V. M., Fidelis, R. R., Aguiar, R. W. S., Brandão, D. R., & Santos, M. M. (2013). Evaluation of rice cultivars contrasting in doses of nitrogen in soils of irrigated lowland. Journal of Biotechnology and Biodiversity, 4(2), 126-133.
Nascente, A. S., Kluthcouski, J., Rabelo, R. R., Oliveira, P., Cobucci, T., & Crusciol, C. A. C. (2011). Upland rice yield under different soil management systems and nitrogen application times. Pesquisa Agropecuária Tropical, 41(1), 60-65.
Nascente, A. S., Crusciol, C. A. C., & Cobucci, T. (2013). The no-tillage system and cover crops - alternatives to increase upland rice yields. European Journal of Agronomy, 45(2), 124-131.
Nascimento, V., Arf, O., Silva, M. G., Binotti, F. F. S., Rodrigues, R. A. F., & Alvarez, R. C. F. (2009). Use of trinexapac-ethyl growth regulator in upland rice.
Bragantia, 68(4), 921-929.
Neves, M. B., Buzetti, S., Arf, O., & Sá, M. E. (2004). Doses and periods of sidedressing nitrogen application in two rice cultivars under sprinkle irrigation. Acta Scientiarum. Agronomy, 26(4), 429-435.
Prasad, R. (2011). Aerobic rice systems. Advances in Agronomy, 111(1), 207-236.
Reichardt, K. (1987). Relações solo-água-planta para algumas culturas. In K. Reichardt (Ed.), A água em sistemas agrícolas, (p. 157-171). São Paulo, SP: Manole. Rodrigues, R. A. F., Soratto, R. P., & Arf, O. (2004).
Water management strategies on upland rice in no-tillage system, using the pan evaporation method.
Engenharia Agrícola, 24(3), 546-556.
Sangoi, L. (2001). Understanding plant density effects on maize growth and development: an important issue to maximize grain yield. Ciência rural, 31(1), 159-168. Santos, A. B., Stone, L. F., & Vieira, N. R. A. (2006). Rice
crop in Brazil, (2a ed.). Santo Antônio de Goiás, GO: Embrapa Arroz e Feijão.
Santos, P. G., Castro, A. P., Soares, A. A., & Cornélio, V. M. O. (2002). Effect of spacing and seed density on yield of sprinkler–irrigated upland Rice. Ciência e Agrotecnologia, 26(3), 480-487.
SAS Institute. (1999). Procedure guide for personal computers. Version 5. Cary, NC: SAS Institute Inc.
Sousa, D. M. G., & Lobato, E. (2003). Cerrado: soil correction and fertilization. Planaltina, DF: Embrapa Cerrados. Yoshida, S. (1981). Fundamentals of rice crop science. Los
Baños, Laguna: IRRI.
Received on February 24, 2016. Accepted on April 14, 2016.