1Universidade de São Paulo, Faculdade de Medicina de Riberão Preto, Departamento de Medicina Interna. Av. Bandeirantes,
3900, 14049-900, Ribeirão Preto, SP, Brasil. Correspondência para/Correspondence to: GSF CASTRO. E-mails: <[email protected]>; <[email protected]>.
2Universidade de São Paulo, Faculdade de Medicina de Riberão Preto, Departamento de Patologia. Ribeirão Preto, SP, Brasil.
Association between hepatic cholesterol
and oleic acid in the liver of rats treated
with partially hydrogenated vegetable oil
Associação entre colesterol hepático e ácido oleico
no fígado de ratos tratados com gordura
vegetal parcialmente hidrogenada
Gabriela Salim Ferreira de CASTRO1
Bianca Bellizzi de ALMEIDA1
Daphne Santoro LEONARDI2
Paula Payão OVÍDIO1
Alceu Afonso JORDÃO1
A B S T R A C T
Objective
The aim of the present study was to investigate the lipid profiles of the hepatic and adipose tissues of Wistar
rats treated for 21 days with a diet high in saturated fat (high saturated fat, n=6) or high in hydrogenated fat, that is, having 50% partially hydrogenated vegetable oil in its composition (high hydrogenated fat, n=6), and compare them to those of a control group (control group, n=6).
Methods
Adipose tissue and total hepatic fat were higher in the saturated fat group than in the hydrogenated fat group. Hepatic lipid peroxidation was greatest in the saturated fat group, with consequent lower hepatic vitamin E and A levels. In contrast, serum vitamin A was highest in the saturated fat group. Analysis of hepatic lipid fractions found more cholesterol and less high density lipoprotein-cholesterol in the hydrogenated fat group. The hydrogenated fat group had the highest levels of triacylglycerols, followed by the saturated fat group.
Results
hydrogenated vegetable oil promotes greater accumulation of cholesterol and triacylglycerols in the liver than saturated fats.
Conclusion
Trans fatty acids were incorporated into hepatocytes and adipocytes in a highly efficient manner. Indexing terms: Fatty liver. Fats, saturated. Lipoproteins.Trans fatty acids.
R E S U M O
Objetivo
Esta pesquisa investigou a composição lipídica dos tecidos hepático e adiposo de ratos Wistar tratados durante 21 dias com uma dieta rica em gordura saturada (grupo gordura saturada, n=6) ou rica em gordura hidrogenada, ou seja, 50% da gordura consistindo de gordura vegetal parcialmente hidrogenada (grupo gordura hidrogenada, n=6) e compará-los a um grupo-controle (grupo-controle, n=6).
Métodos
As quantidades de tecido adiposo e gordura hepática total foram maiores no grupo gordura saturada do que no grupo gordura hidrogenada. A peroxidação lipídica hepática foi maior no grupo gordura saturada, com consequente diminuição dos níveis hepáticos de vitaminas E e A. Por outro lado, o nível sérico de vitamina A foi maior no grupo gordura saturada do que nos outros grupos. A análise das frações lipídicas hepáticas revelou mais colesterol e menos colesterol da lipoproteína de alta densidade no grupo gordura hidrogenada. O grupo gordura hidrogenada apresentou os maiores níveis de triglicérides, seguido do grupo gordura saturada. Quantidades significativas de ácidos graxos trans foram detectados nos tecidos hepático e adiposo do grupo gordura hidrogenada.
Resultados
Dentre os ácidos graxos identificados, o 18:1n9 apresentou uma associação positiva maior com o colesterol hepático e triglicérides, e uma associação negativa maior com o colesterol da lipoproteína de alta densidade. A gordura vegetal parcialmente hidrogenada promove um maior acúmulo de colesterol e triglicérides no fígado do que a gordura saturada.
Conclusão
Os ácidos graxos trans foram incorporados aos hepatócitos e adipócitos de forma altamente eficiente.
Termos de indexação: Fígado gorduroso. Gorduras saturadas. Lipoproteínas. Ácidos graxos trans.
I N T R O D U C T I O N
Nonalcoholic Fatty Liver Disease (NAFLD) is a common cause of chronic liver disease in North America1. The main feature of nonalcoholic fatty
liver is the accumulation of fat in the liver, called steatosis, whereas Nonalcoholic Steatohepatitis (NASH) is the inflammatory phase of steatosis2.
NAFLD can potentially progress through the inflammatory phase of NASH to fibrosis, cirrhosis, and hepatocellular carcinoma3,4.
Accumulation of triacylglycerols in hepatocytes can regress once the cause is eliminated2. NAFLD arises mainly from insulin
resistance, abnormal secretion of some hormones
that govern the glucose and lipid metabolism (leptin, adiponectin), and increased release of inflammatory cytokines (tumor necrosis factor-D - TNF- D, interleukins)5,6.
NAFLD is highly prevalent in individuals with mild (Body Mass Index - BMI of 25-30kg/m2)
or severe central obesity (BMI>30kg/m2) and in
patients with diabetes mellitus type 2 or dyslipidemia3,7,8.
The “two hit hypothesis” for the pathogenesis of NASH has become quite popular. With the first hit, when insulin resistance develops, free fatty acids are inappropriately accumulated in non-adipose tissues, including the liver. Insulin resistance increases free fatty acid flow to the liver by decreased inhibition of lipolysis as well as increased de novo lipogenesis9. Insulin resistance
and visceral obesity also result in decreased levels of adiponectin, which hinder fatty acid oxidation and increase fat accumulation in the liver10.
The second hit is associated with apoptosis and oxidative stress, which may contribute to the development and progression of NASH10. Several
studies have shown that oxidative stress has a central role in the pathogenesis of NASH because the increased production of Reactive Oxygen Species (ROS), which act as free radicals, leads to lipid peroxidation and subsequent inflammatory response11.
High-fat diets predispose to overweight and obesity, insulin resistance and fatty liver disease12. Animal studies have shown that a
high-fat diet is capable of inducing steatosis analogous to human NAFLD in terms of oxidative stress and fibrosis11-13.
Dietary fat has long been implicated in the etiology of several diseases14. Dietary fats, like
saturated and trans fats, may affect lipoprotein metabolism and cardiovascular risk. The adverse effects of saturated and trans fats on vascular function are widely known15, but their effects on
the development of hepatic steatosis and oxidative stress are less understood.
The aim of this study was to investigate the fatty acid composition and liver lipid fractions of rats fed a high saturated fat diet or a high partially hydrogenated vegetable fat diet and assess their biochemical parameters.
M E T H O D S
Diets
The diets were based on the American Institute of Nutrition (AIN-93)16 recommendations
for laboratory studies on growing rodents. The fat content of the high-fat diet was increased from 7g/100g of diet, recommended by AIN-93, to 50g/ 100g diet, and the carbohydrate content was reduced from 62g/100g of diet to 12.94g/100g of diet. The remainder nutrient contents, such as proteins, fibers, vitamins and minerals, were those recommended by AIN-93.
The three experimental diets were distributed as follows: the Control Group (CG) was fed the diet containing soybean oil; the high Saturated Fat Group (SFG) was fed the 50% lard diet; and the high Hydrogenated Fat Group (HFG) was fed the 50% Partially Hydrogenated Vegetable Oil Diet (PHVO).
Animals and collections
Newly weaned male Wistar rats from the Central Animal House of the Ribeirão Preto Campus,Universidade de São Paulo, were housed in individual cages on a 12-hour light-12-hour dark cycle at a controlled temperature of Mean (M)=24, Standard Deviation (SD)=2ºC. Animal care and use were approved by the local Animal Experimentation Ethics Committee. Diets and water were supplied ad libitum. The cages were cleaned weekly. The diets were weighed three times a week, replacing the amounts consumed. The animals were divided into three groups of six animals each and given 7 days to adapt to the new diets by decreasing the amounts of the standard diet and increasing the amounts of the experimental diets until the groups were only consuming the experimental diets, which were then provided for 21 days. After the experimental period, the animals were euthanized by decapitation, with subsequent collection of blood samples and removal of the liver and adipose tissues (mesenteric, epididymal and perirenal).
Food efficiency rate was calculated by dividing weight gain (g) by food intake (g).
Biochemical analyses
Total fat was determined as recommended by Bligh & Dyer17. Hepatic tissue (500mg sample)
was homogenized with 0.8mL distilled water in 10mL tubes, adding 1mL of chloroform and 2mL of methanol. The samples were vortexed for 2 minutes and 1mL of chloroform and 1mL of a 1.5% sodium sulfate solution were added. The mixture was vortexed again for 2 minutes and then centrifuged at 3500rpm for 10 minutes.
Centrifugation separated the mixture into two phases. The upper phase was discarded and the lower phase (chloroform) was transferred to another tube containing 1g of anhydrous sodium sulfate to remove traces of water. An aliquot of the water-free chloroform phase (0.5mL) was transferred to a previously weighed vial and kept in an oven at 75ºC until all chloroform evaporated. The vial was then weighed again.
Total liver fat was given by the difference between vial weights in relation to the initial tissue mass used.
The lipid fractions in the liver were determined after total fat liver extraction, as recommended by Bligh & Dyer15. High Density
Lipoprotein-cholesterol (HDL-c), total cholesterol and triacylglycerols were determined by commercial Labtest® kits (Labtest Diagnóstica S.A.,
Brazil).
Tissue fatty acids were determined by direct trans-etherification method adapted from Lewis et al.18 using 50mg of hepatic or adipose
tissues. A 3mL solution containing methanol, hydrochloric acid and chloroform (10/1/1, v/v) was added to each sample and shaken. The mixture was then heated in a water bath (90ºC) for one hour, followed by cooling in water and addition of 1mL of distilled water.
Next, 2mL of hexane/chloroform (4/1, v/v) was added to each tube. The samples were
centrifuged at 3.500rpm for 5 minutes. This procedure was repeated two more times for fatty acid extraction. The supernatant was dried under nitrogen flow and the samples were resuspended in 150µL of chloroform. Fatty acids were determined by gas chromatography using an external standard (Supelco 37 component FAME Mix).
The fatty acid contents of the soybean oil and fats used to prepare the diets were determined by an adaptation of Andreoli’s et al.19
method which uses hexane extraction.
Initially, 50PL oil and/or fat samples were hydrolyzed in a closed tube containing 1mL of 0.5M KOH in methanol and heated to 100ºC for 5 minutes. The samples were esterified by adding a solution of 400µL of hydrochloric acid and methanol (4:1, v/v) and heated once more to 100ºC for 15 minutes.
The samples were esterified by adding a solution of 400mL HCl and methanol (4:1, v/v) and once more heated to 100ºC for 15 minutes.
Next, the samples were chilled and 2mL of water was added for the esterified fatty acid extraction with hexane at the proportion of 2x3mL.
The organic phase (supernatant) was passed through a funnel with anhydrous sodium sulfate and evaporated and the samples were dissolved in 500µL of chloroform.
Total fatty acids in the liver and adipose tissues and fatty acids in the experimental diets were determined by gas chromatography using a gas chromatograph (Shimadzu Europe, Duisburg, Germany) fitted with a polar SGE International (SGE Europe Ltd., United Kingdom) BPX70 column (30m, 0.25mm I.D., film thickness 0.25mm). Helium was used as carrier gas and make-up air. Synthetic air was used for detecting flame ionization at 280ºC. Sample injections of 1µL were made in the split mode. The injector and detector temperatures were 250°C.
reactive substance (TBARS) levels, as recommended by Buege and Aust20.
For the TBARS assay, hepatic tissue (100mg) was homogenized in 1mL of 1.15% potassium chloride solution and 1.0mL of the homogenate was immediately mixed with 2.0mL of the TCA-TBA-HCL reagent and vortexed. The solution was heated in boiling water (100ºC) for 15 minutes and, after cooling, was centrifuged at 3,000rpm for 10min, collecting the supernatant. To obtain free TBARS, 0.2mL of tissue homogenate was added to 0.3mL of Milli-Q water and 0.5mL of a 2M sodium hydroxide solution. After shaking, the tube was heated to 60ºC for 30 minutes and neutralized with 0.5mL of a 2M hydrochloric acid solution, then adding it to 1mL of the TCA-TBA-HCl solution. The remainder of the reaction followed the free TBARS steps described above. Absorbance of the sample was determined at 535nm against a blank. TBARS concentration in the sample was calculated using a Malonaldehyde (MDA) calibration curve and expressed as MDA/g tissue.
Protein in 50mg of hepatic tissue samples was determined by homogenizing these samples in 0.5mL of water by the Biuret method, using a commercial kit (Labtest Diagnóstica, Brazil). This method reacts copper ions (Biuret reagents) with the peptide bonds of serum proteins in an alkaline environment. After the reaction, the solution becomes purple, with maximum absorbance at 545nm. Color intensity is directly proportional to protein concentration.
Plasma and liver D-tocopherol and retinol levels were determined by high-performance liquid chromatography (HPLC) (LC-20A; Shimadzu) as described by Jordão et al.21. The
HPLC column was ODS (18) 25cm by 4.6mm with a flow of 1.0mL/minute and a visible UV detector. The wavelengths used for D-tocopherol and retinol were 292nm and 325nm, respectively.
Briefly, 0.5g of tissue was homogenized with 2.0mL of pure ethanol or 0.5mL of serum plus 1.0mL of pure ethanol, with the addition of 2.0mL of hexane. The mixture was vortexed for 2
minutes and centrifuged for 15 minutes at 3000rpm. A 0.5mL aliquot of the supernatant was taken and dried under nitrogen flow. The dried residue was resuspended with a mobile phase (acetonitrile/dichloromethane/methanol at 70:20:10) and injected into the HPLC apparatus. The concentration was calculated using external
D-tocopherol and retinol standards.
The desaturation rate used to measure the enzyme activity in the liver and adipose tissue was calculated by Pamplona’s et al.22 method, based
on the fatty acid ratio.
The 20:4n-6/18:2n-6 ratio expresses the activity coefficient of enzymes in the linoleic acid to arachidonic acid synthesis pathway; the 16:1n-7/16:0 ratio expresses that of palmitic acid to palmitoleic acid synthesis pathway; and the 18:1n-9c/18:0 ratio expresses that of stearic acid to oleic acid synthesis pathway.
The data of the groups were compared by one-way analysis of variance followed by the Tukey post-test. The Pearson’s correlation coefficients were calculated to determine possible intragroup associations between variables. The level of significance for all analyses was p<0.05.
R E S U L T S
The fatty acid composition of the fats and oils used for preparing the diets is presented in Table 1. As expected, the partially Hydrogenated Vegetable Oil (PHVO) diet had high trans fatty acid content (40% of the total), more Saturated Fatty Acids (SFA) and less Monounsaturated Fatty Acids (MUFA) and Polyunsaturated Fatty Acids (PUFA) than lard. In turn, lard contained more SFA and MUFA and less PUFA than the soybean oil used in the control diet.
Table 2 also shows that the liver weight among the groups did not vary. The SFG (p<0.001) and HFG (p<0.01) had more adipose tissue than the CG. In contrast, SFG had more hepatic fat than the CG (p<0.001) and HFG (p<0.05), and the HFG had more than the CG (p<0.05).
Table 1. Fatty acid composition of the oils and fats used in the diets. Ribeirão Preto (SP, Brazil), 2010.
14:0 16:0 16:1 18:0 18:1n9t 18:1n9c 18:2n6t 18:2n6c 18:3n6 18:3n3 21:0 22:0 Others SFA MUFA PUFA tFA Fatty acids ND 12.26 ND 03.35 ND 23.61 ND 58.96 00.55 0.0.38 00.47 00.15 00.27 16.23 23.61 59.89 ND Soybean oil 01.40 24.53 02.39 10.07 ND 43.23 ND 16.54 ND 00.58 00.53 00.22 00.51 36.75 45.61 17.12 ND Lard 00.88 43.00 00.12 03.87 39.76 ND 00.24 10.90 ND 00.27 ND ND 00.54 47.74 39.87 11.41 40.00 PHVO
PHVO: Partially Hydrogenated Vegetable Oil; SFA: Saturated Fatty Acids; MUFA: Monounsaturated Fatty Acids; PUFA: Polyunsaturated Fatty Acids; tFA: Trans Fatty Acids.
Table 2. Body, liver and total adipose tissue (mesenteric, epididymal and perirenal) weights, hepatic oxidative stress parameters and hepatic cholesterol, HDL-C and triacylglycerol levels. Ribeirão Preto (SP, Brazil), 2010.
Food efficiency rate Food intake (g/day) Final body weight (g) Liver weight (g) Adipose tissue weight* (g) Hepatic fat (mg/g tissue)
Total hepatic MDA (nmoL/g protein) Free hepatic MDA (nmoL/g protein) Hepatic vitamin E (µmoL/g tissue) Hepatic vitamin A (µmoL/g tissue) Serum vitamin E (µmoL/L) Serum vitamin A (µmoL/L) Hepatic cholesterol (mg/g tissue) Hepatic HDL-cholesterol (mg/g tissue) Hepatic triacylglycerols (mg/g tissue)
0.44 20.74 296.50 9.37 2.88 61.06 49.19 9.91 37.10 8.23 20.78 1.47 3.25 1.16 6.26
00.07a
03.58a
50.01a
01.42a
01.10a
8.81a
10.22a
01.27a
13.73a
01.54a
04.30a
00.19a
00.87a
00.27a
01.45a
M SD CG 000.50 017.83 315.67 011.36 013.52 126.27 094.93 014.35 004.24 004.56 015.58 001.73 004.28 000.95 014.37
00.13a,b
02.75a,b
073.12a,b
01.83a,b
04.84b,b
19.96b,b
21.75b,b
03.51b,b
02.44b,b
01.35b,b
05.42a,b ,b0.08b,b ,b0.87a,b ,b0.11a,b
,b4.96b,b
M SD SFG 000.50 015.80 288.67 010.23 011.28 092.94 059.26 007.48 028.75 010.48 016.57 001.47 007.27 000.77 027.21
00.04b
01.83b
38.43b
01.15b
02.94b
15.34c
09.96a
01.80a
10.84a
02.46a
04.33b
00.04a
01.48b
00.29b
15.25c
M SD
HFG
Food efficiency rate [weight gain (g)/diet consumed (g)];* Adipose tissues (mesenteric, epididymal and perirenal). a,b,cValues followed by different
letters on the same line differed significantly (p<0.05, ANOVA followed by the Tukey post-test). CG: Control Group; SFG: High Saturated Fat Group; HFG: High Hydrogenated Fat Group; MDA: Malonaldehyde; M: Mean; SD: Standard Deviation.
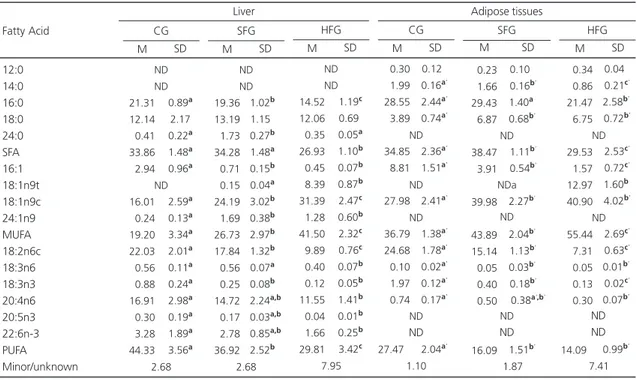
than in the CG (p<0.05). Palmitoleic acid levels were lower in the HFG (p<0.001) and SFG (p<0.001) than in the CG. Trans 18:1n9t acid levels were high in the HFG, low in the SFG and undetectable in the CG (p<0.0001 for both). Oleic acid levels were higher in the HFG than in the CG (p<0.001) and SFG (p<0.01), followed by the SFG in relation to the CG (p<0.001). Linoleic acid levels were lower in the HFG than in the other groups (p<0.001 for CG and SFG) and lower in the SFG than in the CG (p<0.001). Mean J-linoleic acid levels were lower in the HFG than in the SFG and CG (p<0.05 for both groups) and D-linolenic acid levels were lower than those in the CG and SFG (p<0.001 for both). The SFG had lower D-linolenic acid levels than the CG (p<0.001). Arachidonic Acid (ARA), eicosapentaenoic acid and docosahexaenoic acid levels were lower in the HFG than in the CG (p<0.01, p<0.05 and p<0.05, respectively).
than in the CG (p<0.001) and HFG (p<0.01) and the same pattern was observed for the mean concentration of free TBARS, which was higher in the SFG than in the CG (p<0.05) and HFG (p<0.001).
Total hepatic cholesterol levels were higher in the HFG than in the CG (p<0.001) and SFG (p<0.01) and hepatic HDL cholesterol was lower in the HFG than in the CG (p<0.05). Hepatic triacylglycerol content was higher in the SFG and HFG than in the CG (p<0.05 and p<0.001 for SFG and HFG, respectively), characterizing promotion of NAFLD, as indicated in Table 2. The HFG also had higher levels of triacylglycerols than the SFG (p<0.05).
Table 3 shows the fatty acid contents of the liver and adipose tissues. Total liver fatty acids differed in terms of various fatty acids. Palmitic acid levels were lower in the HFG than in the SFG (p<0.001) and CG (p<0.001) and lower in the SFG
Table 3. Fatty acid concentrations in liver and adipose tissues. Ribeirão Preto (SP, Brazil), 2010.
12:0 14:0 16:0 18:0 24:0 SFA 16:1 18:1n9t 18:1n9c 24:1n9 MUFA 18:2n6c 18:3n6 18:3n3 20:4n6 20:5n3 22:6n-3 PUFA Minor/unknown Fatty Acid 21.31 12.14 00.41 33.86 02.94 16.01 00.24 19.20 22.03 00.56 00.88 16.91 00.30 03.28 44.33 0.89a 2.17 0.22a 1.48a 0.96a 2.59a 0.13a 3.34a 2.01a 0.11a 0.24a 2.98a 0.19a 1.89a 3.56a ND ND ND 2.68 M SD CG 19.36 13.19 01.73 34.28 00.71 00.15 24.19 01.69 26.73 17.84 00.56 00.25 14.72 00.17 02.78 36.92
1.02b,b
1.15a,b
0.27b,b
1.48a,b
0.15b,b
0.04a,b
3.02b,b
0.38b,b
2.97b,b
1.32b,b
0.07a,b
0.08b,b
2.24a,b
0.03a,b
0.85a,b
2.52b,b
ND ND 2.68 M SD SFG 14.52 12.06 00.35 26.93 00.45 08.39 31.39 01.28 41.50 09.89 00.40 00.12 11.55 00.04 01.66 29.81 1.19c 0.69c 0.05a 1.10b 0.07b 0.87b 2.47c 0.60b 2.32c 0.76c 0.07b 0.05b 1.41b 0.01b 0.25b 3.42c ND ND 7.95 M SD HFG 00.30 01.99 28.55 03.89 34.85 08.81 27.98 36.79 24.68 00.10 01.97 00.74 27.47 0.12ª’ 0.16a’ 2.44a’ 0.74a’ 2.36a’ 1.51a’ 2.41a’ 1.38a’ 1.78a’ 0.02a’ 0.12a’ 0.17a’ 2.04a’ 1.10 M SD CG ND ND ND ND ND 00.23 01.66 29.43 06.87 38.47 03.91 39.98 43.89 15.14 00.05 00.40 00.50 16.09 0.10b’,,,b
0.16b’,,b’
1.40a’,,,b’
0.68b’,,,b’
1.11b’,,b’
0.54b’,,b’
2.27b’,,,b’
2.04b’,,,b’
1.13b’bb’
0.03b’,,,b’
0.18b’,,b’
0.38a’,b’
1.51b’,,,b’
1.87 M SD SFG ND ND ND ND NDa 0.04c’ 0.21c’
2.58b’,
0.72b’
2.53c’
0.72c’
1.60b’
4.02b’
2.69c’
0.63c’
0.01b’,
0.02c’
0.07b’,
0.99b’,
7.41 M SD HFG ND 00.34 00.86 21.47 06.75 29.53 01.57 12.97 40.90 55.44 07.31 00.05 00.13 00.30 14.09 ND Adipose tissues Liver
Fatty acids reported as mean±SD in % of total fatty acids. a,b,c values followed by different letters on the same line were significantly different for hepatic tissue; a’,b’,c’ values followed by different letters on the same line were significantly different for adipose tissues (p<0.05, ANOVA followed
by the Tukey post-test). SFA: Saturated Fatty Acids; MUFA: Monounsaturated Fatty Acid; PUFA: Polyunsaturated Fatty Acids; CG: Control Group; SFG: High Saturated Fat Group; HFG: High Hydrogenated Fat Group; M: Mean; SD: Standard Deviation.
The sum of SFA was lower in the HFG than in the CG (p<0.01) and SFG (p<0.01) and the sum of MUFA was higher than that of the CG (p<0.001) and SFG (p<0.001). The sum of MUFA was higher in the SFG than in the CG (p<0.01), whereas the sum of PUFA was lower in the HFG than in the CG (p<0.001) and SFG (p<0.01) and lower in the SFG than in the CG (p<0.01).
The HFG has less myristic acid in adipose tissues than the other groups (p<0.001 for the CG and SFG) and the SFG had less than the CG (p<0.05). Palmitic acid levels were lower in the HFG than in the other groups (p<0.001). Stearic acid levels were higher in the SFG and HFG than in the CG (p<0.001 for both). Palmitoleic acid levels were lower in the SFG and HFG than in the CG (p<0.001 for both) and lower in the HFG than in the SFG (p<0.01). Only the HFG had trans oleic acid (p<0.001) and the SFG and HFG had higher cis oleic acid levels than the CG (p<0.001 for both). Linolenic acid concentrations were lower in the HFG and SFG than in the CG (p<0.001 for both), and lower in the HFG than in the SFG (p<0.001). D-Linoleic acid levels were lower in the SFG and HFG than in the CG (p<0.01 for both).
D-Linolenic acid levels were also lower in the SFG and HFG than in the CG (p<0.001 for both), and the HFG had lower levels than the SFG (p<0.01). ARA was lower in the HFG than in the CG (p<0.05).
The mean sum of SFA in the SFG was higher than that in the CG (p<0.05) and HFG (p<0.001) and the HFG had a lower mean value than the CG (p<0.01). The mean sum of MUFA in the HFG was higher than in the other groups (p<0.001 for both) and the mean value in the SFG was higher than that in the CG (p<0.001). The SFG and HFG had lower sums of PUFA than the CG (p<0.001 for both).
Figure 1 shows the linear regression for hepatic fatty acids. The lipid fractions found in the liver revealed that oleic acid had the highest positive association with hepatic cholesterol (r0.81; p<0.0001), a negative association with HDL-C content (r-0.62; p<0.005), and a positive
Figure 1. Linear regression showing a positive association between hepatic oleic acid and total hepatic cholesterol (r0.81; p<0.0001), a negative association between oleic acid and hepatic HDL-cholesterol (r-0.62; p<0.005), and a positive association between hepatic oleic acid and hepatic triacylglycerols (r0.69; p<0.003). Ribeirão Preto (SP, Brazil), 2010.
Note: HDL: High Density Lipoprotein. r0.81 p<0.001
2 3 4 5 6 7 8 9
10 20 30 40
Hepatic C18:1n9c
Hepatc cholester
ol
0,4 0,6 0,8 1 1,2 1,4 1,6
10 15 20 25 30 35
Hepatic 18:1n9c
Hepatic HDL Cholester
ol
r-0.62 <0.005
p
0 5 10 15 20 25 30 35 40
10 15 20 25 30 35
Hepatic 18:1n9c
Hepatic T
riacylglycer
ols
r0.069 <0.003
association with hepatic triacylglycerols (r0.69; p<0.003).
The conversion of palmitic acid to palmitoleic acid was given by the ratios between these two fatty acids, with subsequent determination of the desaturation activity. This ratio in the liver was lower in the SFG and HFG than in the CG (p<0.001 for both). In adipose tissues, the ratio was lower in the HFG than in the CG and SFG (p<0.001 and p<0.01, respectively), and the SFG had a lower mean value than the CG (p<0.001). The mean oleic acid/ stearic acid ratio was higher in the livers of the HFG than in the other groups (p<0.001 for the CG and p<0.01 for the SFG) and lower in the adipose tissues of the SFG and HFG than in the
CG (p<0.05 for both). In contrast, the arachidonic acid/linoleic acid ratio not only reflects desaturation but also the elongation that occurs in the omega-6 fatty acid pathways. This ratio was higher in the livers of the HFG than in the other groups (p<0.01 for the CG and p<0.05 for the SFG) but was similar in adipose tissues. These results are shown in Figure 2.
D I S C U S S I O N
The groups presented similar growth, but those consuming high-fat diets tended to eat less during the experimental period.
The SFG had the lowest mean vitamin E concentrations and the highest free and total
Figure 2. Activity of desaturation enzymes determined by fatty acid ratios. Ribeirão Preto (SP, Brazil), 2010.
Note:a,b Bars of the same color and with different letters were significantly different for the liver; a’,b’,c’ bars of the same color and with different
letters were significantly different for adipose tissues (p<0.05, ANOVA followed by the Tukey post-test). CG: control group; HS: high saturated fat diet group; HH: high hydrogenated fat diet group.
0 1 2 3 4 5 6 7 8 9
C HS HH C HS HH
Liver Adipose tissues a
b b
b b
b’
b’
b’ a’
a’
a a
a a
c’
Desaturation index
18:1/18:0 20:4n6/18:2n6
hepatic MDA concentrations, indicating greater lipid peroxidation and vitamin E utilization to neutralize peroxyl and lipid radicals21.
Other compounds, such as acetone, also decrease hepatic antioxidant levels with a concomitant increase in the amount of fat in the liver, indicating that the formation of endogenous fatty acids is linked to NAFLD and NASH23.
MDA has been extensively studied as a marker of lipid peroxidation because it is involved in various degenerative biological processes and has the ability to react with various compounds, DNA being one of them24. The present study
found that when the PHVO diet was offered as the single lipid source, it did not induce lipid peroxidation or the utilization of antioxidants, clearly showing that dietary saturated fat is strongly related to oxidative stress13.
Although the animals had similar mean weights, the SFG and HFG had more adipose tissue and hepatic fat levels. Many studies reported that excessive fat intake causes accumulation of triacylglycerols in the liver, characterizing non-alcoholic fatty liver disease12,
which was detected in the SFG and HFG. However, the HFG group had higher triacylglycerol and total cholesterol levels than the SFG and lower HDL cholesterol levels than the CG, revealing that, despite similar body weights, type of fat is directly related to NAFLD severity and to the type of lipid stored.
The lower 16:1/16:0 ratio in the liver and adipose tissues of the groups fed high-fat diets reflects lower de novo synthesis of fatty acids, since the CG consumed less palmitic acid and had more of it in the liver. Stearic acid and oleic acid levels were higher in the adipose tissues of the SFG and HFG. Although the PHVO diet contained more palmitic acid than the other diets, the HFG had lower levels of this acid and higher levels of cis oleic acid in the liver and adipose tissues, indicating that elongation and desaturation enzymes in this group were more active.
Liver and adipose tissue regulation of the enzyme Stearoyl-CoA Desaturase (SCD) seem to
differ25. The endogenous synthesis of MUFA by
SCD-1 is responsible for the formation of hepatic triacylglycerols and cholesterol26. Of all the studied
fatty acids, oleic acid, one of the products of hepatic SCD-1, had the greatest association with high hepatic cholesterol and triacylglycerols and low hepatic HDL-cholesterol.
Oleic acid can induce steatosis in a liver cell line (HepG2) in a dose-dependent manner, as demonstrated by Cui et al.27, in which there was
also an increased expression of TNF-D and increased secretion of this factor to the culture medium. Oleic acid also decreased the expression of PPAR-D? (peroxisome proliferator-activated receptors) and superoxide dismutase-1, increased lipid peroxide production and decreased cell proliferation27.
When compared with palmitic acid, oleic acid promoted greater accumulation of triacylglycerols in the cell lines HepG2, WRL-68 and HuH-7, and also increased PPAR-y and SREBP-1 (sterol regulatory element-binding protein) expression, transcription factors linked to fatty liver28.
Thus, the strong positive correlation between oleic acid and liver triacylglycerol and total cholesterol levels appears to be linked to fatty liver in animals from the SFG and HFG, all with high liver fat content.
The higher hepatic conversion of stearic acid to oleic acid in the HFG clearly shows that lower oleic acid intake caused increased SCD-1 activity. In adipose tissues, this ratio was lower in groups consuming high-fat diets because, compared with the SFG, saturated fat provided more stearic acid, which was efficiently stored, whereas in the HFG, there was probably more elongation and desaturation of palmitic acid. The PHVO diet had high palmitic acid content, as shown by the smaller reserves of palmitic and palmitoleic acids and increased oleic acid in the adipose tissues of the HFG.
was due to the smaller intake of linoleic acid, since the calculation was based on the ratios of these two fatty acids.
C O N C L U S I O N
The PHVO diet promoted greater accumulation of cholesterol and triacylglycerols in the liver than the saturated fat diet. Trans fatty acids were incorporated into hepatocytes and adipocytes in a highly efficient manner, indicating that, in addition to aggregating to membranes, these fatty acids may exert cell functions that have not been fully elucidated.
C O N T R I B U T I O N S
GSF CASTRO, PP OVÍDIO, BB ALMEIDA and DS LEONARDI designed the protocol, performed the technical procedures and data analysis, and were responsible for manuscript preparation and writing. AA JORDÃO designed the protocol, performed the technical procedures, supervised all phases of the study and critically reviewed the manuscript.
A C K N O W L E D G E M E N T S
This study was sponsored by the Conselho Nacional de Desenvolvimento Científico e Tecnológico
(CNPq), Brazil.
R E F E R E N C E S
1. Browning JD, Szczepaniak LS, Dobbins R, Nuremberg P, Horton JD, Cohen JC, et al. Prevalence of hepatic steatosis in an urban population in the United States: impact of ethnicity. Hepatology. 2004; 40(6):1387-95.
2. Grattagliano I, Portincasa P, Palmieri VO, Palasciano G. Managing nonalcoholic fatty liver disease: recommendations for family physicians. Can Fam Physician. 2007; 53(5):857-63.
3. Marchesini G, Bugianesi E, Forlani G, Cerrelli F, Lenzi M, Manini R, et al. Nonalcoholic fatty liver, steatohepatitis, and the metabolic syndrome. Hepatolgy. 2003; 37(4):917-23.
4. Caldwell SH, Crespo DM. The spectrum expanded: cryptogenic cirrhosis and the natural history of non-alcoholic fatty liver disease. J Hepatol. 2004; 40(4): 578-84.
5. Friedman JM, Halaas JL. Leptin and the regulation of body weight in mammals. Nature. 1998; 395(6704):763-70.
6. Marra F. NASH: are genes blowing the hits? J Hepatol. 2004; 40(5):853-6.
7. Jasen PLM. Nonalcoholic steatohepatitis. Neth J Med. 2004; 62(7/8):2214-24.
8. Angulo P, Keach JC, Batts KP, Lindor KD. Independent predictors of liver fibrosis in patients with nonalcoholic steatohepatitis. Hepatology. 1999; 30(6):1356-62.
9. Utzschneider KM, Kahn SE. Review: the role of insulin resistance in nonalcoholic fatty liver disease. J Clin Endocrinol Metab. 2006; 91(12):4753-61. 10. Kim CH, Younossi ZM. Nonalcoholic fatty liver
disease: a manifestation of the metabolic syndrome. Clevelend Clin J Med. 2008; 75(10): 721-8.
11. Oliveira CP, Coelho AM, Barbeiro HV, Lima VMR, Soriano F, Ribeiro C, et al. Liver mitochondrial dysfunction and oxidative stress in the pathogenesis of experimental nonalcoholic fatty liver disease. Braz J Med Biol Res. 2006; 39(2):189-94. 12. Larter CZ, Yeh MM. Animal models of NASH:
getting both pathology and metabolic context right. J Gastroenterol Hepatol. 2008; 23(11): 1635-48.
13. Fan JG, Qiao L. Commonly used animal models of non-alcoholic steatohepatitis. Hepatobil Pancreat Dis Int. 2009; 8(3):233-40.
14. Brehm BJ, Seeley RJ, Daniels SR, D’Alessio DA. A randomized trial comparing a very low carbohydrate diet and a calorie-restricted low fat diet on body weight and cardiovascular risk factors in healthy women. J Clin Endocrinol Metab. 2003; 88(4): 1617-23.
15. Zivkovic AM, German JB, Sanyal AJ. Comparative review of diets for the metabolic syndrome: implications for nonalcoholic fatty liver disease. Am J Clin Nutr. 2007; 86(2):285-300.
16. Reeves PG, Nielsen FH, Fahey GC. AIN-93 purified diets for laboratory rodents: final report of the American Institute of Nutrition ad hoc writing committee on the reformulation of the AIN-76A rodent diet. J Nutr. 1993; 123(11):1939-51. 17. Bligh EG, Dyer WJ. A rapid method of total lipid
18. Lewis T, Nichols PD, McMeekinTA. Evaluation of extraction methods for recovery of fatty acids from lipid-producing microheterotrophs. J Microbiol Meth. 2000; 43(2):107-16.
19. Andreoli MF, Scalerandi MV, Borel IM, Bernal CA. Effects of CLA at different dietary fat levels on the nutritional status of rats during protein repletion. Nutrition. 2007; 23(11-12):827-35.
20. Buege JA, Aust SD. Microsomal lipid peroxidation. Meth Enzymol. 1978; 52:302-10.
21. Jordão AA Jr, Chiarello PG, Arantes MR, Meirelles MS, Vannucchi H. Effect of an acute dose of ethanol on lipid peroxidation in rats: action of vitamin E. Food Chem Toxicol. 2004; 42(3):459-64.
22. Pamplona R, Portero-Otín M, Riba D, Ruiz C, Prat J, Bellmunt MJ, et al. Mitochondrial membrane peroxidizability index is inversely related to maximum life span in mammals. J Lipid Res. 1998; 39(10):1989-94.
23. Almeida BB, Mathias MG, Portari GV, Jordão AA. Chronic acetonemia alters liver oxidative balance and lipid content in rats: a model of Nash? Exp Clin Endocrinol Diabetes. 2010; 118(1):61-3. 24. Del Rio D, Stewart AJ, Pellegrini N. A review of
recent studies on malondialdehyde as toxic
molecule and biological marker of oxidative stress. Nutr Metab Cardiov Dis. 2005; 15(4):316-28. 25. Warensjo E, Rosell M, Hellenius ML , Vessby B , De
Faire U, Risérus U. Associations between estimated fatty acid desaturase activities in serum lipids and adipose tissue in humans: links to obesity and insulin resistance. Lipids Health Dis. 2009; 8:37. 26. Jeyakumar SMP, Lopamudra P, Padmini S,
Balakrishna N, Giridharan NV, Vajreswar A. Fatty acid desaturation index correlates with body mass and adiposity indices of obesity in Wistar NIN obese mutant rat strains WNIN/Ob and WNIN/GR-Ob. Nutr Metab. 2009; 6:27.
27. Cui W, Chen SL, Hu KQ. Quantification and mechanisms of oleic acid-induced steatosis in HepG2 cells. Am J Transl Res. 2010; 2(1):95-104. 28. Ricchi M, Odoardi MR, Carulli L, Anzivino C, Ballestri
S, Pinetti A, et al. Differential effect of oleic and palmitic acid on lipid accumulation and apoptosis in cultured hepatocytes. J Gastroenterol Hepatol. 2009; 24(5):830-40.
Received on: 27/8/2010