David Rodríguez Lago
A contribution for the understanding and
measurement of production sustainability
David Rodríguez Lago
junho de 2015 UMinho | 2015 A contr ibution for t he under st anding and measur ement of pr oduction sus tainability
Universidade do Minho
Escola de Engenharia
junho de 2015
Dissertação de Mestrado
Ciclo de Estudos Integrados Conducentes ao
Grau de Mestre em Engenharia e Gestão Industrial
Trabalho efetuado sob a orientação do
Professor Doutor Sílvio do Carmo Silva
David Rodríguez Lago
A contribution for the understanding and
measurement of production sustainability
Universidade do Minho
iii
Acknowledgments
I thank my family for the unceasing encouragement, attention and support during the difficult moments.
I also express my warm thanks to Silvio do Carmo Silva, my supervisor, for his support and guidance working in this dissertation. I am extremely thankful to him for sharing expertis, and sincere and valuable guidance and encouragement extended to me.
Finally I should like to thank Enrique Ares for giving me the opportunity to live the Erasmus experience in Portugal at the Universidade do Minho.
iv
Abstract
Sustainability is an imperative of present and future production activity. Sustainability is concerned with the environment protection, safety and welfare of present and future generations. Business success, both in manufacturing and services, must be measured against results contributing to sustainability. This means that business practices must be based on strategies that assertively address not only economic issues but also social and environmental ones, the three dimensions being referred as the triple-bottom-line approach (TBL). A company must therefore strive to measure and evaluate its sustainability stand and the effects of strategies on sustainability evolution on the TBL dimensions. In the literature there are a lot of studies, guidelines and recommendations on sustainability of companies and production and sustainability reporting, but apparently there is a serious difficulty in measuring the sustainability stand and evolution of companies and production dependent on strategies, and therefore difficulty to manage production activity towards sustainability. This dissertation gives an overview of the available literature on sustainability of companies, focusing on indicators of sustainability on the TBL dimensions and on composite indicators of these dimensions, with an emphasis on production sustainability. Finally an attempt to create an index to evaluate sustainability of a company is made. This index is based on the Analytical Hierarchy Process (AHP). An example of application of this index for sustainability evaluation of a company on the TBL dimensions is presented.
Keywords
v
Resumo
As atividades industriais devem reger-se por normas e estratégias de sustentabilidade socioeconómica e ambiental. Esta preocupa-se com a proteção ambiental, segurança e bem-estar das gerações presentes e futuras. O sucesso de uma organização, na produção de bens e de serviços, deve ser avaliado à luz da sua contribuição para as três dimensões de sustentabilidade, i.e., económica, social e ambiental, referidas como o “Tripple Bottom Line” (TBL). Para tal uma organização deve implementar estratégias de sustentabilidade e ser capaz de medir e avaliar esta e a sua evolução com base indicadores relevantes. Na literatura existem muitos estudos, recomendações e orientações referentes a sustentabilidade organizacional, mas existe uma grande dificuldade em medir a sustentabilidade das empresas e da produção. Consequentemente, as estratégias para a sustentabilidade empresarial e produtiva são difíceis de definir e estabelecer. Esta dissertação apresenta uma visão geral da literatura em relação à sustentabilidade empresarial, com focagem na produção e nos indicadores de sustentabilidade associados ao TBL. Como forma de facilitar a medição sustentabilidade empresarial e produtiva desenvolve-se neste trabalho um índice flexível de medição de sustentabilidade baseado na técnica Analytical Hierarchy Process (AHP). Um exemplo de aplicação deste índice na avaliação da sustentabilidade de uma organização é também apresentado.
Palavras chave
Abordagens à sustentabilidade, Indicadores de sustentabilidade, medição de sustentabilidade, AHP
vi
Contents
Glossary of terms ... ix
Introduction ... 1
1.1. Scope and objectives of the work ... 1
1.2. Structure of the dissertation ... 2
2. Sustainable production – fundamental concepts and definitions ... 3
2.1. Definitions of sustainable production ... 3
2.2. The function of the society in sustainable development. ... 4
2.2.1. What characterizes the "Sustainable Company"? ... 4
2.2.2. What is Corporate Social Responsibility? ... 5
2.3. Life cycle assessment concepts and methodology ... 7
2.4. Ecological footprint ... 12
3. Decision indicators and frameworks to measure sustainability ... 14
3.1. Introduction ... 14
3.2. Selecting and Defining Key Performance Indicators - KPIs ... 15
3.3. OEE, definition and methodology ... 17
3.4. TEEP (Total Effective Equipment Performance) ... 23
3.5. Sustainable indicators – classes and dimensions ... 23
3.6. Lowell Center for Sustainability Production ... 30
3.7. Global Reporting Initiative (GRI) ... 34
3.8. International organization for standardization ISO14031 ... 37
3.9. Others indicator frameworks ... 38
4. Composite indicators ... 41
4.1. Introduction ... 41
4.2. Economic and Functional Efficiency Index of a sustainable production line ... 42
4.3. Integrated Assessment of Sustainable Development ... 48
5. A contribution for measuring and improving manufacturing sustainability of companies 54 5.1. Critical vision of chapters 3 and 4 ... 54
5.2. A proposed approach to evaluate production/company sustainability ... 56
5.3. Example analysis of sustainability of a company ... 58
6. Conclusions and future work ... 62
vii
Table’s index
Table 1 .Different definitions of sustainable manufacturing. ... 3
Table 2. The evolution from the conventional perspective of doing business to what we would call a "sustainable business” ... 4
Table 3. Indicators for 8 stakeholders groups. ... 6
Table 4. Impact profiles for two refrigerator designs. ... 11
Table 5. Six big losses ... 21
Table 6. Calculation of each big loss ... 21
Table 7. Different reasons for each big loss. ... 22
Table 8. Indicators of sustainable production ... 25
Table 9. Indicator examples of each dimension of sustainability repository (NIST). ... 29
Table 10. Core indicators of LCSP sustainable method. ... 32
Table 11. Categories and aspects in the Guidelines ... 37
Table 12. Variables of the production indicator. ... 43
Table 13. Input conversion factors ... 44
Table 14. Outputs conversion factors ... 45
Table 15. Variables of the emvironmental. ... 45
Table 16. Type of stakeholder and its variable. ... 46
Table 17. Definitions of symbols and indices. ... 49
Table 18. Notation used in the definition of sustainability indicators. ... 50
Table 19. Comparison scale of analytic hierarchy process ... 52
Table 20. Matrix A, with p= factor of preference ... 52
Table 21. Data base of each indicator. ... 60
Table 22. Weights of each indicator using AHP and Matrix A. ... 60
Table 23. Normalized indicators. ... 61
Table 24. Normalized indicator multiplied by its weight ... 61
viii
Figure´s index
Figure 1. The CSR wheel of a company.. ... 6
Figure 2.The product system or life cycle of a product. ... 8
Figure 3.The framework of life cycle assessment according to the ISO 14040 standard ... 9
Figure 4. Product life cycle, based on EU LCA platform. ... 9
Figure 5. Modelling of the impacts, which emissions cause on areas of protection. ... 11
Figure 6.Seven steps to develop a KPI ... 16
Figure 7. Avaliable operating time ... 21
Figure 8. Division of the sustainability indicators in social, environmental and economic aspects. ... 24
Figure 9. Flows in manufacture ... 24
Figure 10. NIST sustainable indicator categorization.. ... 28
Figure 11. Main dimensions of an indicator. ... 30
Figure 12. Lowell Center for Sustainable Production indicator framework... 31
Figure 13. Continuous-loop model for defining and measuring sustainability performance of organizations. ... 33
Figure 14. The hierarchical structure of the global reporting initiative (GRI) framework. ... 34
Figure 15. The United Nations Commission for Sustainable Development (UNCSD) theme indicator framework. . ... 39
Figure 16. The Institute of Chemical Engineers (IChemE) sustainability metrics. ... 39
Figure 17. The Wuppertal sustainable development indicator framework. ... 40
Figure 18. The Input and Output process of the SMS ... 42
Figure 19. Generic hierarchy scheme for calculation of composite sustainable development index. ... 49
ix
Glossary of terms
Recycling: is defined as a resource recovery method involving the collection and
treatment of waste products for use as raw material in the manufacture of the same or a similar product.
Triple Bottom Line: The TBL is an accounting framework that incorporates three
dimensions of performance: social, environmental and financial.
Environmental accounting is designed to bring environmental costs to the attention of
the corporate stakeholders who may be able and motivated to identify ways of reducing or avoiding those costs while at the same time improving environmental quality and profitability of the organization.
Eco-efficiency: is the delivery of competitively priced goods and services that satisfy
human needs and bring quality of life, while progressively reducing ecological impacts and resource intensity throughout the life cycle, to a level at least in line with the earth’s estimated carrying capacity. It is based on the concept of ‘‘doing more with less’’ representing the ratio between economy and environment, with the environment in the denominator.
Social responsibility: refers to safe, respectful, liberal, equitable and equal human
development, contributing to humanity and the environment.
Eco-design: a product development process that takes into account the complete life
cycle of a product and considers environmental aspects at all stages of a process, striving for products, which make the lowest possible environmental impact throughout the product’s life cycle.
Life cycle: addresses all stages and the life time of products, their environmental
impacts as well as services, manufacturing processes, and decision-making.
Life cycle assessment (LCA): is the method/process for evaluating the effects that a
product has on the environment over the entire period of its life, thereby increasing resource-use efficiency and decreasing liabilities.
Waste minimization: is defined as measures or techniques that reduce the amount of
wastes generated during industrial production processes.
Supply chain management: is defined as a process of planning, implementing, and
controlling the operations of the supply chain with the purpose of satisfying consumer requirements.
Environmental Management Strategy (EMS): is a set of management tools and
principles designed to guide the allocation of resources, assignment of responsibilities and ongoing evaluation of practices, procedures and processes, and environmental concerns that industries, companies, or government agencies need to integrate into their daily business or management practices.
ISO 14000 series: is a family of environmental management standards developed by
the International Organization for Standardisation (ISO). The ISO 14000 standards are designed to provide an internationally recognized framework for environmental management, measurement, evaluation and auditing.
x
Sustainable production: is creating goods by using processes and systems that are
non-polluting, that conserve energy and natural resources in economically viable, safe and healthy ways for employees, communities, and consumers and which are socially and creatively rewarding for all stakeholders for the short- and long-term future.
Sustainable development: development that meets the needs of the present without
compromising the ability of future generations to meet their own needs. Sustainable development emphasizes the evolution of human society from the responsible economic point of view, in accordance with environmental and natural processes.
1
1. Introduction
1.1. Scope and objectives of the work
Sustainability is about building a society in which a proper balance between economic, social and ecological or environmental dimensions, i.e. the Triple Bottom Line (TBL) need to be achieved (Gunasekaran and Spalanzani, 2011).
Sustainability has become an important issue in all spheres of life. Companies have been under increasing pressure to seriously think about their sustainable business practices, both in manufacturing and services. The pressure for promoting sustainable business practices is both external (government regulations, profit and non-profit organizations) and internal (strategic objectives, top management vision, employee safety and well-being, cost savings, productivity and quality) (Gunasekaran and Spalanzani, 2011). Today is just as important to get a good profit as to be eco-efficient and to be careful with environment and the society. A good company is also a company which cares about its employees and cares about its impact on the society. Sustainability is a reality whose results support companies’ competitiveness. Sustainability and Corporate Social Responsibility (CSR) are important issues and must be equated in managing a company and setting company strategies for success.
Production sustainability is nowadays a requirement for the success of companies and a contribution for preserving earth resources for future generations, improving the quality of life and meet stakeholders’ expectations. Moreover it is a requirement for sustainable competition of companies.
It is not easy to transform a company into a sustainable company. There are some issues and questions that are difficult to answer:
How can a company become a sustainable company?
How can sustainability be measured?
How and which sustainability metrics and targets can be used and set?
How does sustainability evolve over time?
A company is, therefore, confronted with the difficulty of measuring and evaluating its sustainability stand and evolution to assess the strategies set for improving production sustainability.
Strategies to overcome the difficulties and solve the problems raised must be aligned with different dimensions of sustainability. One possible view of such dimensions is the triple bottom line which identifies the environmental, economic, and social dimensions. Other views can be considered.
The problem of defining and setting suitable sustainability targets needs to take into account the dimensional framework of metrics which is adopted.
2 Finding a model to measure sustainability is a difficult problem to solve if sustainability within and across companies and through time need to be compared.
In the literature there is a lot of information about sustainability, but there are still quite a few issues and difficulties needing attention. Some of these have to do with measuring and evaluating company and or production sustainability in relevant dimensions as an instrument for better decision making and accomplishment of corporate social responsibility.
This master project is focused on the difficulties and problems above raised and directed towards a contribution to overcome and solve them. One planned contribution is an attempt to develop a procedure for measuring and evaluating sustainability of production. However its main contribution is the result of a literature review which 1) study and analyse frameworks and models for measuring sustainability, 2) identify and study sustainable performance indicators that are or may be used for measuring, in general, sustainable development and, in particular, the sustainability of production. The study is extended to 3) models that are used for evaluating the sustainability performance behaviour of companies and production. This evaluation is required to assess the sustainability stand of companies and also the effect of strategies designed for increasing sustainability. It can be done exploring different perspectives, among them , evaluating sustainability over time and in comparison to targets.
1.2. Structure of the dissertation
After this introduction, the 2nd chapter gives an overall view of concepts of sustainability and raises the problematic of sustainability and of related issues relevant to manufacturing companies.
Chapter 3 focusses on indicators of sustainability ranging from environmental to social and economic indicators. In this chapter we define what key performance indicators (KPIs) are, their features and some related issues. We also will talk about some lists examples of sustainable indicators that companies are using today. The same chapter also looks inside the frameworks to measure, evaluate and report sustainability based on sustainable indicators. Chapter 4 speaks about indices or composite indicators, that provide a method for integrated sustainability assessment. These indicators integrate economic indicators, social indicators, and environment indicators, and blends of them in composite indicators. These, together with other indicators can help companies in decision-making relative to sustainable development or sustainable production.
Chapter 5 attempts to give a critical overview about frameworks and methods described in chapters 3 and 4. The same chapter tries to develop an approach to evaluate sustainability of a company. It finishes with an example analysis of the sustainability of the Grupo Bimbo in a period of three years.
3
2. Sustainable production – fundamental concepts
and definitions
2.1. Definitions of sustainable production
Sustainable production is part of the broader concept of sustainable development that emerged in the early 1980s in response to increased awareness raising and concern about the environmental and social impact of economic growth and expansion of the global economy. According to a UN document (web site [1]) sustainable development is the development which satisfies the needs of the present without compromising the ability of future generations to meet their own needs.
At the 1992 United Nations Conference on Environment and Development (UNCED) held in Rio de Janeiro, sustainable production was introduced and adopted as one of the guiding principles for business and governments in transitioning towards and achieving sustainable development.
As sustainability is becoming an expected business practice by companies, large and small, sustainable manufacturing or production is being defined, developed and implemented by manufacturing companies and their networks of suppliers and customers. Some definitions are summarized in Table 1:
Table 1 .Different definitions of sustainable manufacturing(Leahu-Aluas, 2010)
Reference definition
Department Of Commerce USA
Sustainable manufacturing is the creation of manufactured products that use processes that minimize negative environmental impacts, conserve energy and natural resources, are safe for employees, communities, and consumers and are economically sound (Leahu-Aluas, 2010)
Lowell Center for sustainable production
Sustainable manufacturing is the creation of goods and services using processes and systems that are:
Non-polluting
Conserving of energy and natural resources Economically viable
Safe and healthful for workers, communities, and consumers Socially and creatively rewarding for all working people.
Institute For Manufacturing, University of Cambridge
Sustainable manufacturing is the developing technologies to transform materials without emission of greenhouse gases, use of non-renewable or toxic materials or generation of waste.
Sustainable Manufacturing Consulting, Indianapolis
Sustainable manufacturing is a business practice of the industrial sector, which expands all the company’s processes and decisions into the social and natural environments it operates in and affects, with the explicit objective of reducing or eliminating any negative impact, while pursuing the desired level of technological and economic performance.
4 Sustainable manufacturing involves making more efficient use of natural resources and energy, besides reducing emissions of greenhouse gases and other environmental consequences. The goal is to serve basic needs for goods and services, at the same time improving the quality of life and guaranteeing for the future generations sufficient resources.
Development of a sustainable manufacturing system adds more parameters to be handled simultaneously. This is a problem if the decision-makers need to handle a multitude of different parameters that are not incorporated into the analysis of one single simulation (Mason and Hill, 2008).
2.2.
The function of the society in sustainable
development.
Working for sustainable development means not only partially compensate negative externalities of the company through philanthropic projects, considering these like collateral damage effects which may be “compensate” by, for example, sponsorship of tree plantations. The company can go beyond compensation in the environmental field, because the model of sustainable development must also respect the balance between economic and social dimensions and between it and the protection of the environment (Alfaya and Blasco, 2002).
2.2.1. What characterizes the "Sustainable Company"?
A sustainable company is one that obtains economic benefits designing products and services that improve quality of life for its customers, employees, suppliers, local communities and other groups involved, works for a possible future providing value for society that tries to serve. To walk in this direction, Alfaya and Blasco (2002) say that a company to be socially responsible needs a system of government suitably aligning the organization and the value chain of its products and services accordingly,
Table 2.
Table 2. The evolution from the conventional perspective of doing business to what we would call a "sustainable business"(Alfaya and Blasco, 2002).
Conventional company socially responsible company Sustainable company
Maximize profit for shareholders
Maximize profit for shareholders reversing a portion to the society where it operates in order to partly compensate the negative
externalities that produces
Maximize profit for society where it operates creating new products and services
Enforce the rules of the game
avoid harmful effects that may have the products and services it offers on the market
takes advantage of
opportunities that better quality of life offers for business Meet demands for
information Show their social commitment
promote participation of society on the company to jointly seek solutions
5
New responsibilities should involve new laws that must be enforced for all
We need few rules We need few rules
Reactive position Proactive position Leadership
2.2.2. What is Corporate Social Responsibility?
Corporate Social Responsibility (CSR) is a management concept whereby companies integrate social and environmental concerns in their business operations and interactions with their stakeholders. CSR is generally understood as being the way through which a company achieves a balance of economic, environmental and social imperatives (“Triple-Bottom-Line- Approach”), while at the same time addressing the expectations of shareholders and stakeholders.
Thus, CSR appears as a form of voluntary commitment of the company with the internal and external environments to achieve sustainable development and agreement between both parts (Freeman and Hasnaoui, 2010). In brief, CSR search a relationship of the company that is responsible, transparent and based on mutual respect, with each of the stakeholders or parties involved as shown in Figure 1(Kakabadse et al. 2005).
Thus, it is necessary to analyse the different ways in which CSR is developed, which can split the company's CSR as follows (Davies 2003, Kotler and Lee 2005):
CSR Internal: it refers to responsible behaviour in the internal context of the company and affects two key elements: the governability of the organization, it means the significant improvement of their systems of government, and labour relations in the company.
CSR external: it refers to responsible behaviour in the iteration of the company with their external stakeholders regarding sustainable economic growth, fight against corruption, protection and conservation of the environment and search for greater social equality.
As shown in the CSR wheel of a company, Figure 1 there are 8 stakeholders groups, and in each group there are some indicators, that totally account 56, Table 3
6 Figure 1. The CSR wheel of a company (adapted from Kakabadse et al. 2005).
Table 3. Indicators for 8 stakeholders groups. Vilanova and Dinarès (2009)
stakeholder Indicator impact on the company
employeers
economic value generated salary of the employees labor conditions on the workplace evaluation of the results
work absenteeism
profile of the group of workers training of the staff
rotation of staff
conciliation of the work life, personal,and family
human rights
equally oportunity programs
waste produced
independent external environmental verification
Recycling
workplace accidents and diseases Formal representation of workers in management syndicate or collective representation health and safety policy at work
harassment and abuse
COMPANY Customers Society Environment Suppliers Employees Local authority Markets Shareholders
7
Supplier
conditions and average payment time training of the staff
human rights
good practices with local suppliers selection, evaluation, and association with suppliers
customers
customer satisfaction
human rights
product liability
retention and customer loyalty
product claims
impact social marketing environmental management system
customers privacity
communicative product liability selection, evaluation, and association with suppliers
local authority
economic value generated investments and services that provide a social benefit relations with political authorities and lobby
government subsidies
Society
human rights
economic value generated relationship with the community awards and distinctions for responsible acting investments and services that provide a social benefit Market communicative product liability
shareholders
economic value generated
customers privacity
communicative product liability selection, evaluation, and association with suppliers
environment
Energy and water consumption environmental conditions in the workplace independent external environmental verification
Recycling
environment management system
gas emissions
effluent emissions
Biodiversity
If a company wants to apply the CSR, it must analyse first which of these key CSR issues have greater impact, second, those which manages currently and, finally, where would advance the future.
2.3. Life cycle assessment concepts and methodology
Sustainable manufacturing must be eco-efficient. One method used for evaluating this is Life Cycle Assessment (LCA). Life cycle assessment was developed as an analytical tool to help
8 assess the environmental impacts from products or services. For a product to perform its function it must be developed, manufactured, distributed to its users and maintained during use (Hauschild et al., 2005). In order to get an impression of the total environmental impacts caused by the product, the analysis must focus on the product system or the life cycle of the product which is shown, in a general form,as shown in Figure 2.
Figure 2.The product system or life cycle of a product (Hauschild et al, 2005).
In an attempt to support a global dissemination of the interest in environmental performance of products, the United Nations Environment Program in 2002, in collaboration with The Society of Environmental Toxicology and Chemistry (SETAC), launched the Life Cycle Initiative under the United Nations Environment Program (UNEP) Program for Sustainable Consumption. The initiative has the mission: ‘To develop and disseminate practical tools for evaluating the opportunities, risks, and trade-offs associated with products and services over their whole life cycle’ (Hauschild et al. 2005). A global user survey performed for guiding the definition of the Life Cycle Initiative revealed that for the impact assessment phase of Life Cycle Assessment (LCA), the highest priorities of users are( Stewart and Jolliet, 2004):
Transparency in the methodology.
Scientific confidence and co-operation.
Development of recommended factors and methodologies with uncertainty described.
Development of methodology for impact categories with specific relevance for developing countries (salinization, erosion, soil depletion).
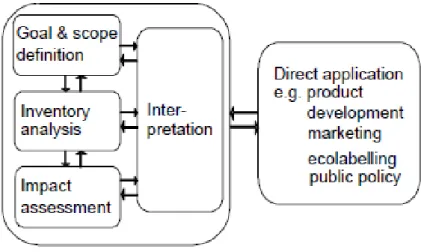
The Life Cycle initiative was organised in three pillars addressing respectively life cycle inventory analysis, life cycle impact assessment, and life cycle management (the use of life cycle assessment information in management decisions), Figure 3. The tasks addressed by each one are:
Life Cycle Inventory (LCI): Agreement on data quality characterisation and data
reporting formats facilitation of access to existing LCI databases and to LCA studies which have been published in some form.
Life Cycle Impact Assessment (LCIA): Facilitation of access to existing LCIA methods in
the short term and development of recommendable practice for the different impact categories and for assessment of resource consumption in the medium and long term (2-5 years).
Life Cycle Management (LCM): Integration of existing tools and concepts for decision
9 framework, communication of life cycle information to relevant stakeholders, training modules for SMEs and developing countries.
Figure 3.The framework of life cycle assessment according to the ISO 14040 standard (Hauschild et al, 2005).
LCA methodology
The LCA methodology in important to evaluate the environmental performance of products, services and processes and it is considered a powerful tool for decision makers. Waste treatment options are frequently evaluated using LCA methodologies in order to determine the option with the lowest environmental impact. Typically, industrial modelling with LCA describes static models compared to discrete event simulation (DES)(Mason and Hill, 2008). A product should be examined from the initial extraction and processing of raw materials through manufacturing, distribution and use to final disposal, including the transport involved, i.e. its whole life cycle (Figure 4).
10 Persson and Karlsson (2007), Alvemark and Persson (2007), and Ingvarsson and Johansson (2006) used DES as a tool for environmental measurements in food production. A combination of LCA and DES was employed.
There are five LCA metrics that were incorporated in the DES models: 1- Carbon Emissions, tons CO2 Equivalent
2- Air Pollutant Emissions, tons or kg 3- Liquid Waste Generate, tons or kg 4- Solid Waste Generate, tons or kg 5- % Recycled Waste, percent
These metrics can be applied in the fabrication phase, at the factory level or even in a single manufacturing phase.
The life cycle impact assessment proceeds through four steps (Hauschild et al, 2005):
First step is Selection of impact categories and classification. Here, categories of environmental impacts of relevance to the study are defined. In most LCA studies, existing impact categories can just be adopted. Next, the substance emissions from the inventory are assigned to the impact categories according to their ability to contribute to different environmental problems. Figure 5 illustrates environmental impact categories which are often modelled in LCIA
Second step is Characterisation where the impact from each emission is modelled according to the environmental mechanism (Figure 5) and expressed as an impact score in a unit common to all contributions within the impact category (e.g. kg CO2-equivalents for all greenhouse gases).
Third step is Normalisation. Normalisation expresses the magnitude of the impact scores on a scale, which is common to all the categories of impact (typically the background impact from society’s total activities). In the example of
Table 4 the impact scores are expressed in person equivalents, PE. The unit PE represents the annual impact from an average person and is useful for bringing the rather diverse environmental impacts on a common scale.
11 Table 4. Impact profiles for two refrigerator designs. All impacts are normalised and expressed in a
common unit– the person equivalent, PE (or rather milli PE).
Fourth and final step of the impact assessment is Valuation where a ranking or weighting is performed of the different environmental impact categories and resource consumptions reflecting the relative importance they are assigned in the study. The valuation is needed when trade-off situations occur as described under normalisation. Where normalisation expresses the relative magnitudes of the impact scores and resource consumptions, valuation expresses their relative significance considering the goal of the study.
12 Figure 5. Modelling of the impacts, which emissions cause on areas of protection (Hauschild et al,
2005).
2.4. Ecological footprint
As Wackernagel and Rees (1996) point out:
Human demand on ecosystem services continues to increase, and there are indications that its demand is outpacing the regenerative and absorptive capacity of the biosphere. For this reason the productivity of natural capital may increasingly become a limiting factor for the human endeavour. Therefore, metrics tracking human demand on, and availability of, regenerative and waste absorptive capacity within the biosphere are needed to track minimum sustainability conditions. The ecological footprint is a measure of human demand on the Earth's ecosystems. It is a standardized measure of demand for natural capital that may be contrasted with the planet's ecological capacity to regenerate. It represents the amount of biologically productive land and sea area necessary to supply the resources a human population consumes, and to assimilate associated waste. Using this assessment, it is possible to estimate how much of the Earth (or how many planet Earths) it would take to support humanity if everybody followed a given lifestyle.
Ecological Footprint and biocapacity calculation covers six land use types: cropland, grazing land, fishing ground, forest land, built-up land, and the uptake land to accommodate the carbon Footprint. For each land use type, the demand for ecological products and services is divided by the respective yield to arrive at the Footprint of each land use type [Ewing B. et al. 2010]. Ecological Footprint and biocapacity are scaled with yield factors and equivalence factors to convert this physical land demanded to world average biologically productive land, usually expressed in global hectares (gha). This allows for comparisons between various land use types with differing productivities.
13
The National Footprint Accounts calculate the Ecological Footprint and biocapacity for more than 200 countries and the world. According to the 2010 Edition of the National Footprint Accounts, humanity demanded the resources and services of 1.51 planets in 2007; such demand has increased 2.5 times since 1961. This situation, in which total demand for ecological goods and services exceeds the available supply for a given location, is known as overshoot. On the global scale, overshoot indicates that stocks of ecological capital may be depleting and/or that waste is accumulating.
Ecological Footprint accounting is based on six fundamental assumptions (Wackernagel et al. 2002):
The majority of the resources people consume and the wastes they generate can be quantified and tracked.
An important subset of these resource and waste flows can be measured in terms of the biologically productive area necessary to maintain flows. Resource and waste flows that cannot be measured are excluded from the assessment, leading to a systematic underestimate of humanity’s true Ecological Footprint.
By weighting each area in proportion to its bioproductivity, different types of areas can be converted into the common unit of global hectares, hectares with world average bioproductivity.
Because a single global hectare represents a single use, and each global hectare in any given year represents the same amount of bioproductivity, they can be added up to obtain an aggregate indicator of Ecological Footprint or biocapacity.
Human demand, expressed as the Ecological Footprint, can be directly compared to nature’s supply, biocapacity, when both are expressed in global hectares.
Area demanded can exceed area supplied if demand on an ecosystem exceeds that ecosystems regenerative capacity.
14
3. Decision indicators and frameworks to measure
sustainability
3.1. Introduction
Achievements are evaluated by performance or decision metrics. These can serve as basic tools to guide a company to keep or become sustainable. they may include essentially two types: indicators and indices. Indicators, indices, and parameters are frequently referred as the same. However, in general, there are many parameters, less indicators and only a few indices. A parameter is a variable carrying some useful information about the system or system operation with which it is related. We could say that it is little more than a datum useful for system understanding, characterization and performance evaluation. For example, the total number of manufacturing employees of a company and the production output are parameters. Although parameters may be useful, alone they tell very little about the system and its performance or business achievements. Indicators are metrics that relate, in a simple and linear manner, two or more parameters for providing quantitative and or qualitative information about a system operation or activity performance during a given period. For example the relation between output and the number of employees is an important indicator, i.e. productivity. Che B. Joung, et. al 2012 define an indicator as a measure or an aggregation of measures from which conclusions on a phenomenon of interest can be inferred.
Unless otherwise said or taken from context, in this dissertation, we use the term indicator to refer a decision metric, either indicator or index.
Indicators of an organisation activity or performance can be characterized by the following attributes (Che B. Joung et al., 2012):
Identification (ID): the unique alphanumeric identifier
Name: the word(s) for the distinctive designation
Definition: the statement expressing the essential characteristics and function.
Measurement type: the type of metric: quantitative or qualitative.
Unit of measure: the unit of the value measured.
References: citable documents of existing metrics set(s) or specific metrics(s), based
on which a metric is based.
Application level: the level in a hierarchical organization that the indicator is applied.
Parameters and indicators are useful to develop indices. Real indices are variables or metrics giving a good overall and aggregated understanding or evaluation of system performance or activity. Complex models of supposed indices that do not give this understanding are of little use.
Indices relate parameters and or indicators through mathematical models of several degrees of complexity. Examples of indices are, Overall Equipment efficiency (OEE) (Puvanasvaran et al., 2013),the Ecological Footprint (EF) (Wackernagel and Rees, 1997) Environmental
15 Sustainability Index (ESI) (Esty et al. ,2005), composite sustainable development index (Damjan Krajnc, Peter Glavic,2003).
Sustainability indicators are indicators that measure sustainability. While the number of sustainability indicators in the literature is growing, none of them advances our understanding of corporate sustainability. It is not possible to have a set of sustainability indicators, applicable to all organizations because organizations vary enormously in their business activities and objectives. Therefore, frameworks for measuring sustainability performance are necessary to help a company to achieve sustainability. Frameworks give guidelines and support for companies that help them to define targets and to evaluate and achieve sustainability.
Some of the best-known indicator frameworks are the International Organization for Standardization ISO 14031, Global Reporting Initiative (GRI), Lowell Center for Sustainability Production (LCSP) indicator framework, Dow Jones Sustainability Indexes (DJSI), Ford Product Sustainability Index (Ford PSI), European Environmental Agency Core Set of Indicators (EEA-CSI) etc. In this dissertation we make a brief description of some, i.e. GRI, LCSP.
In the next section we define what KPIs are, and we also give examples of sustainable indicators that companies are using today.
3.2. Selecting and Defining Key Performance Indicators -
KPIs
It has become popular in the last decades to refer to metrics, either indicators or indices, measuring the degree of goals or objectives’ achievements, i.e. of success, of a company or production, as key performance indicators (KPI) (web site [2]). Thus, KPIs are metrics used to quantify the results of a particular action aligned to the objectives that are key or very important to a company.
Companies can design their KPIs based on the SMART criterion of Peter Drucker (Bogue, 2013):
Specific: The criterion stresses the need for a specific goal rather than a more general one.
Measurable: By definition a KPI should be measurable.
Achievable: The objectives that we will consider when we are setting our KPIs must be
credible.
Relevant: Sometimes the excess of information can be a problem and we have dozens
of KPIs to choose but few of this give information of interest; if it is enough four KPIs, better than six.
Timely: The KPIs must conform to a reasonable timeframes. For example, if my goal is
to increase sales by about 20% in the first quarter of the year, I can´t use as KPI the number of annual sales.
Indicators can measure efficiency and effectiveness. The concept of efficiency loss is usually interpreted as the "level of waste", considering that a process is said efficient when many
16 products with few inputs are generated. Effectiveness is similar to efficiency, although it relates the amount of resources used to achieve business objectives.
To develop simple and meaningful KPIs, the seven simple steps shown in Figure 6 and below described, are recommended (web site [3]):
Figure 6.Seven steps to develop a KPI (web site [3]).
Step 1 – Create Objective: An easy start, for any given area within the business, think of something that needs to be done to improve activities in that area and write it down. For example, in sales you may want to “Improve Sales Productivity”.
Step 2 – Describe Results: Often objectives are written as activities, the example above “Improve Sales Activity” is exactly this case. Worse still, objectives are often written as actions or projects, for example “Implement a Sales Plan”. This may be a worthwhile activity, but it is not a measurable objective. An Objective is not an activity or a project, it is a result. Step 2 takes the Objective and refines it to use terms oriented around results and language that is specific to outputs that can be measured. For example from the aspirational objective “Improve Sales Productivity” several objectives may be derived including “Reduce the time it takes to convert a qualified lead into a sale”.
Step 3 – Identify Measures: For each objective there may be several KPIs. The selection of the KPIs must be based on things that can actually be counted or calculated. The KPIs, like the objectives need to be written clearly. For the example above “Reduce the time it takes to convert a qualified lead into a sale” there are several things that can be counted like the number of qualified leads, or the number of sales related to the leads etc.
Step 4 – Define Thresholds: A performance measure is meaningless unless it can be compared to something. The actual value of the measure has to be compared to what would be considered good, bad or indifferent. The comparator could be a target based on previous performance or on a notional future performance. Whatever the target, it needs to be considered as reasonable and achievable. Step 4 goes through the
17 reasoning behind setting a target value and then on to define ‘threshold’ values. These enable the performance measure to be viewed not only as a number, currency or percentage but also visually.
Step 5 – Upload Structure/Data: It is only at this stage that the objectives and metrics ‘structure’ should be loaded into a performance management system. Most systems will allow you to move objectives and performance measures around after they have been loaded so it is not yet necessary to have a complete view as to what the overall structure should look like. Step 5 shows how to build a scorecard structure, entering objectives and related performance measures and then arranging them for ease of access.
Step 6 – Interpret Results: Once a set of objectives and performance measures has been entered into the system then the job of interpreting the results can be started. There are two phases to this activity, first to create a set of meaningful dashboards and reports from the data and second to interpret the results as displayed on the dashboard and in the reports when actual values have been entered. The first task, creating dashboards and reports, is not a one-off activity, it will require modification over time. The second, interpretation, is an on-going activity that occurs during the reporting cycle, usually monthly.
Step 7 – Take Action: Any performance measure that shows (through the correct interpretation) that an objective is moving in the wrong direction may need to have an action associated with it to remedy the situation. The action may take the form of a task, project, activity, budget change or simply to remove the objective.
3.3. OEE, definition and methodology
OEE (Overall Equipment Effectiveness) is a composite indicator or index that is commonly used by leading companies. OEE aims at making a constraint or bottleneck equipment run more effectively. OEE and its individual measures and indicators, give the plant numbers to see where the equipment is losing time (Hogfeldt, 2005). Successful computation of OEE requires reliable data which reflects the real equipment utilization based on the utilization estimated, managers can identify the causes of the time losses and attempt to reduce these losses (Ki and Philip, 2001).
OEE measurement is also commonly used as a key performance indicator (KPI) in conjunction with lean manufacturing efforts to provide an indicator of success, however OEE indicator can be indirectly related with sustainability concepts and aspects, because varying variables of the OEE equation like Planned production time, or quality rate, will affect sustainability aspects like the use of raw material, or maybe social aspects like number of work hours etc. Then, it is important to include this meaningful indicator in this dissertation.
OEE is based on a number of production related variables associated with the so called six big losses. The associations are relevant to explain the components of the OEE KPI.
18
Total time,
Planned production time,
Actual production time,
Ideal run rate, and
Cycle time.
Cycle time can be divided in components and interpreted in a few different ways. A definition of each variable is:
Total time: total time that the equipment is availability to work (normally 480 minutes/work shift)
Planned production time, Tdp: time that the equipment could be working per shift. It will be calculated subtracting to the total time planned stopping time like equipment´s preventive maintenance, break time, underload planned stopping time… definitely all planned stopping time.
Actual production time, Tu: time that the equipment has been working per shift. This is the planned production time minus those events that stopped the planned production time during an appreciable time which they were registered in the documents of the works production day (normally unplanned stopping time, breakdowns and machine adjustments).
Effective operating time: This is actual operation time minus time lost due to the rejected parts during production and reworking pieces, and the losses from initial start-up to process stabilization.
Ideal run rate,
C
Tu : this is the quantity of production during the actual production
time if the equipment goes to the theoretical maximum speed available in a shift, i.e. based on the planned cycle time per unit for maximum output.
Current run rate, Q: units of production of the equipment in a shift. The differences between ideal run rate and current run rate are losses in the production because micro-stopping time that are not registered in the documents of incidences and slow production velocity.
Current good quality rate Qq: units of production satisfying quality specifications (good units) of the equipment in a shift.
Cycle time C: The time it takes to do one repetition of any particular task typically measured from “Start to Start”, or the starting point of one product’s processing in a specified machine or operation until the start of another similar product’s processing in the same machine or process.
Manual Cycle Time: The time loading, unloading, flipping/turning parts, adding components to parts while still in the same machine/process.
19 Auto Cycle Time: the time that a machine runs un-aided (automatically)
without manual intervention.
Overall Cycle Time: The complete time it takes to produce a single unit. This term is generally used when speaking of a single machine or process.
Total Cycle Time: This includes all machines, process, and classes of cycle time through which a product must pass to become a finished product. Overall equipment effectiveness (OEE) is a hierarchy of metrics developed by Seiichi Nakajima in the 1960 to evaluate how effectively a manufacturing operation is utilized. OEE is a set of metrics that bring clear focus to the key success drivers for manufacturing enterprises. It is a percentage number that is usually defined by multiplying the calculated availability rate, performance rate and quality rate. These are defined as follows:
𝐴𝑣𝑎𝑖𝑙𝑎𝑏𝑖𝑙𝑖𝑡𝑦 =𝑃𝑙𝑎𝑛𝑛𝑒𝑑 𝑃𝑟𝑜𝑑𝑢𝑐𝑡𝑖𝑜𝑛 𝑇𝑖𝑚𝑒 𝐴𝑐𝑡𝑢𝑎𝑙 𝑃𝑟𝑜𝑑𝑢𝑐𝑡𝑖𝑜𝑛 𝑇𝑖𝑚𝑒
𝑃𝑒𝑟𝑓𝑜𝑟𝑚𝑎𝑛𝑐𝑒 =𝐶𝑢𝑟𝑟𝑒𝑛𝑡 𝑅𝑢𝑛 𝑅𝑎𝑡𝑒𝐼𝑑𝑒𝑎𝑙 𝑅𝑢𝑛 𝑅𝑎𝑡𝑒
𝑄𝑢𝑎𝑙𝑖𝑡𝑦 =𝑇𝑜𝑡𝑎𝑙 𝑃𝑟𝑜𝑑𝑢𝑐𝑡𝐺𝑜𝑜𝑑 𝑃𝑟𝑜𝑑𝑢𝑐𝑡
𝑂𝐸𝐸 = 𝐴𝑣𝑎𝑖𝑙𝑎𝑏𝑖𝑙𝑖𝑡𝑦 × 𝑃𝑒𝑟𝑓𝑜𝑟𝑚𝑎𝑛𝑐𝑒 × 𝑄𝑢𝑎𝑙𝑖𝑡𝑦 where:
Availability U: is a percentage number that shows how often the machine is available
where it is needed for production. It accumulates to the first two of the 6 Big Losses (Puvanasvaran et al., 2013): breakdowns and setup/adjustments which is the downtime that is measured at the equipment.
Performance Ip: takes into account the unrecorded downtime which is the 3rd and 4th
of the 6 Big Losses. The ideal cycle time is needed to calculate the performance efficient where it is multiplied with the total parts produced divided by the actual operating time (Mei,2013).
Quality Iq: The quality rate captures the last two of the 6 Big Losses; time lost due to
the rejected parts during production and reworking pieces, and the losses from initial start-up to process stabilization. This is the ratio between current production
20 subtracting rejected parts (with or not rework) and the current production (Alagendran, 2013).
Thus OEE can be written as:
Q Q C T Q T T OEE q u dp u q (1) From where: dp q T Q C OEE (2) Where the availability U is
dp u T T U (3) The performance Ip is C T Q Ip u (4) Where: C T rate run Ideal u
And the quality Iq is
Q
Q
I
q
q(5)
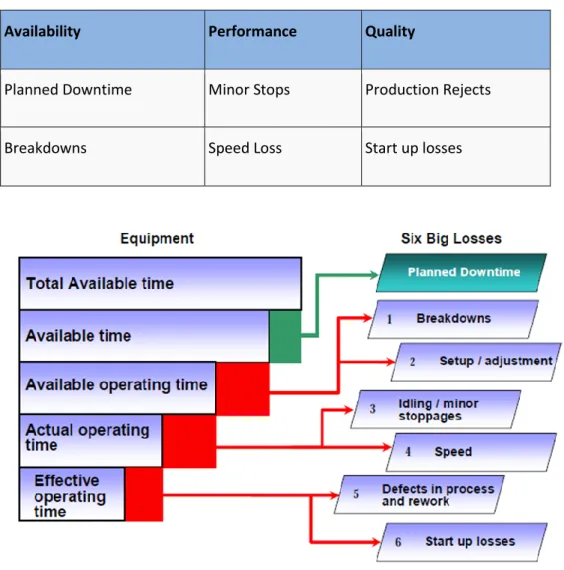
The Six big loses
The six big losses and their relation to the referred variables are shown below. To be able to better determine what is contributing to the greatest loss and so what areas should be targeted to improve the performance, these categories (Availability, Performance and Quality) have been subdivided further into what is known as the ‘Six Big Loses’ to OEE (Figure 7). These are categorised as follows in Table 5:
21 Table 5. Six big losses
Availability Performance Quality
Planned Downtime Minor Stops Production Rejects
Breakdowns Speed Loss Start up losses
Figure 7. Avaliable operating time is the same as our TDP, and actual operating time is the same as our Tu, effective operating time is actual operating time minus time that we loss in the start up losses and reworking pieces (web site [4])
Table 6.Calculation of each big loss
Six loss category Calculation
PDT or external unplanned event Planned downtime / Total production time Breakdowns (>5mins) Major fault time / Total production time Minor stops (<5mins) Minor fault time / Total production time
Speed loss ((Output / actual speed) – (Output / Rated speed))/Total production time
Production rejects Rejects in production / (actual speed X Total production time)
Star up losses Rejects on start up / (actual speed X total production time)
22 Table 7. Different reasons for each big loss.
Six loss category OEE measure Reason for loss
1. Planned downtime Availability
1.Changeovers 2.Planned maintenance 3.Material shortages 4.Labour shortages 2. Breakdowns Availability 1.Equipment failure 2.Major component failure 3.Unplanned maintenance
3. Minor stops Performance
1.Fallen products 2.Obstruction 3.Blackages 4.Misaligment
4. Speed loss Performance
1.running lower than rating speed
2.untrained operator not able to run at nominal speed
3.Misaligment 5. Production rejects Quality
1.Product out of specification 2.Damage product
3.Scrap
6. Start up losses Quality
1.Product out of specification at start run
2.Scrap created before nominal running after changeover
3.Damaged product after planned maintenance activity
Companies should seek to reduce as much as possible each of the big losses if they want to increase de efficiency and obtain a good OEE indicator.
When machines are optimally tuned to accomplish the desired work, increased operating efficiency reduces energy waste.
Waste elimination is one of the most effective ways to increase efficiency and profitability of any business. Processes either add value or waste during the production of goods or services. TPM (Total Preventative Maintenance), similarly to OEE (Overall Equipment Efficiency) methodology, identifies the losses that lower equipment efficiency, e.g. waiting, set-ups, and reduced speed [S. J. Mason, 2008]. Emphasis on equipment efficiency can lead to reduced costs, increased productivity, and fewer defects. Eradicating waste and losses in the design phases maximizes the productivity of equipment throughout its lifetime.
23
3.4. TEEP (Total Effective Equipment Performance)
Where OEE measures effectiveness based on scheduled hours, TEEP measures effectiveness against calendar hours, i.e.: 24 hours per day, 365 days per year. TEEP, therefore, reports the 'bottom line' utilization of assets.
A machine with high production efficiency will has a high OEE, but if we make very short use of it this will be evidenced by a low TEEP (web site [5]).
TEEP is given by
𝑇𝐸𝐸𝑃 = 𝐴𝑣𝑎𝑖𝑙𝑎𝑏𝑖𝑙𝑖𝑡𝑦 × 𝑃𝑒𝑟𝑓𝑜𝑟𝑚𝑎𝑛𝑐𝑒 × 𝑄𝑢𝑎𝑙𝑖𝑡𝑦 × 𝑈𝑡𝑖𝑙𝑖𝑧𝑎𝑡𝑖𝑜𝑛 where
𝑢𝑡𝑖𝑙𝑖𝑧𝑎𝑡𝑖𝑜𝑛 =𝑡ℎ𝑒𝑜𝑟𝑒𝑡𝑖𝑐𝑎𝑙 𝑚𝑎𝑥𝑖𝑚𝑢𝑚 𝑝𝑟𝑜𝑑𝑢𝑐𝑡𝑖𝑜𝑛 𝑎𝑡 𝑡ℎ𝑒 𝑠𝑐ℎ𝑒𝑑𝑢𝑙𝑒𝑑 𝑡𝑖𝑚𝑒 𝑓𝑜𝑟 𝑝𝑟𝑜𝑑𝑢𝑐𝑡𝑖𝑜𝑛 𝑡ℎ𝑒𝑜𝑟𝑒𝑡𝑖𝑐𝑎𝑙 𝑚𝑎𝑥𝑖𝑚𝑢𝑚 𝑜𝑢𝑡𝑝𝑢𝑡 𝑜𝑛 𝑡𝑜𝑡𝑎𝑙 𝑐𝑎𝑙𝑒𝑛𝑑𝑎𝑟 𝑡𝑖𝑚𝑒
Possible alternative interpretations of TEEP use different "total calendar times", e.g., considering five days per week instead of seven.
The important thing is to take into account these considerations when we interpret the data and make comparisons.
3.5. Sustainable indicators – classes and dimensions
Sustainability indicators serve as basic tools to guide a company to define strategies, to establish goals and targets and, to evaluate results of its operations, to take decisions to maintain or improve its sustainability stand. Companies that need to evaluate their stand and evolution on sustainability take decisions and adopt goals and targets, based on achievements or failures of sustainability.
According to Booysen (2002) characteristics of indicators to measure sustainability are:
Aspects of the sustainability to be measured by indicators.
Techniques/methods/tools used for development of index like quantitative/qualitative, subjective/objective, cardinal/ordinal, unidimensional/multidimensional.
Whether the indicator compare the sustainability measure across ‘cross-section’ or ‘time-series’), absolute or relative manner?
Does the indicator measure sustainability in terms of input (‘means’) or output (‘ends’)?
Clarity and simplicity in its content, purpose, method, comparative application and focus.
Availability of data for the various indicators.
Flexibility in the indicator for allowing change, purpose, method and comparative application.
24 One way to classify and analyse sustainable indicators is dividing them in three groups based on the three dimensions of the so-called triple bottom line, i.e. social, environmental and economical, Figure 8.
Figure 8. Division of the sustainability indicators in social, environmental and economic aspects.
(Krajnc and Glavic, 2003)
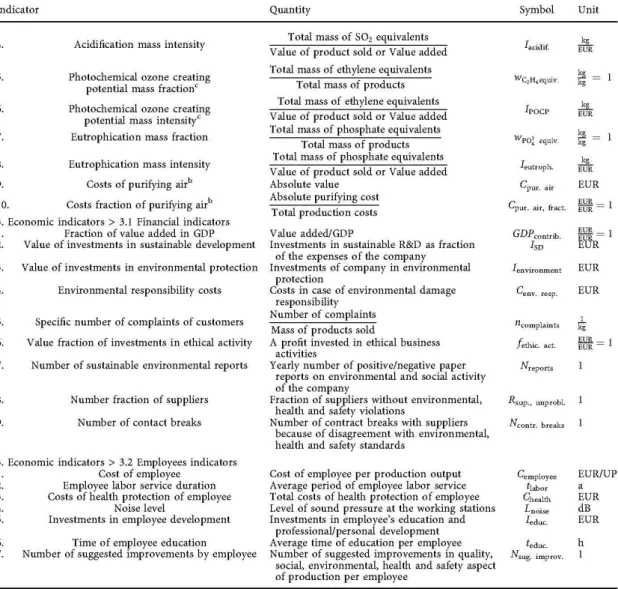
Damjan Krajnc and Peter Glavic (2003) present quite many examples of indicators that could be applied for measuring sustainability in general and production sustainability in particular, as shown in Table 8. They are simple and easy to use, to measure typical aspects of production (e.g. materials use, energy use, water consumption, products, waste, air emissions, etc.). The environmental indicators are divided into input and output indicators as shown in Figure 8, dependent on input and output flows in a manufacture system as shown in Figure 9. The economic indicators are divided into financial and employees’ indicators.
25 Table 8. Indicators of sustainable production (Krajnc and Glavic, 2003)
26 table 8 (cont)
27 table 8 (cont) 1. Indicators of sustainable production (Krajnc and Glavic, 2003)
a
(IChemE),b(FEM and FEA 1997),c(AIChE),d(Veleva and Ellenbecker 2001),e(Azapagic and Perdan 2000).
NIST’s (Japan National Institute of Science and Technology Policy) indicator categorization is based on five dimensions of sustainability:
1. environmental stewardship, 2. economic growth,
3. social well-being,
4. technological advancement, 5. and performance management.
28 Figure 10. NIST sustainable indicator categorization. (Che B. Joung et al., 2012).
As can be seen the NIST indicators organization includes the three TBL dimensions and two other, namely :
1. technological advancement and 2. performance management.
Each class covers a different set of indicators (Che B. Joung et al., 2012):
The environmental stewardship covers environmental impacts from emissions, resource use, and ecosystem detriment from manufacturing processes and products.
The economic growth dimension emphasizes costs, profits, and benefits accrued along with investments made by the manufacturing organization.
Social well-being considers the impacts on employees, customers, and the community from health and safety programs, satisfaction assessments, and career/educational development. Technological advancement accounts for the ability of a manufacturer to promote technological advancement through R&D staffing, expenditures, and high-tech products. Performance management concerns deployment of sustainability programs and policies and conformance to regulations. Placement of indicators from the various sets was made according to the meaning and relevance of the given indicator based on a neutral definition. With the selection, development, and placement of indicators in the structure of categorization, the result of the categorization shows an extensive collection of indicators that meet the overall concept of sustainable manufacturing. Further detail of this structure and the indicators within this structure can be found at the NIST’s Sustainable Manufacturing Indicator Repository (SMIR) website:(http://www.mel.nist.gov/msid/SMIR/Indicator_Repository.html). The total number of indicators included within the SMIR is 212. Of the current indicators, 77
29 indicators belong to the environmental stewardship dimension, 23 to the economic growth dimension, 70 to the social well-being dimension, 30 to the performance management, and 12 to the technological advancement management. Examples of each dimension are in Table 9 .
Table 9.Indicator examples of each dimension of sustainability repository (NIST).
Dimension of sustainability
Name of the indicator
Definition Unit Placement identifier
Environmental stewardship
Waste water amount
Amount of waste water discharged by an organization or process specified by category (i.e.
eco-toxic, hazardous, treated, non-treated, reused, non ecotoxic,
etc.) Volume of total waste water discharged by an organization or process categorized by type GRI-Emissions, effluents, and waste;
GM MSM-Waste Management; ISO 14031-Operational performance indicators: Effluents to land/water Env-17a
Economic growth Profits
generated
Total net profits for an organization or product Dollar value of profits generated by an organization or product UN-CSD Eco-6d
Social well-being Lost
workdays
Workdays missed due to accidents Number or percent of workdays missed due to accidents GRI-Labor Practices: Occupational Health and Safety; GM MSM-Occupational Safety Soc-1b Technological advancement Product output
Throughput for a specific product Number of a specific product produced in a period NISTEP Tech-7a Performance management Environment incident response time Time to respond to or correct environmental incidents Time to respond to or correct environmental incidents ISO 14031-Management performance indicators: Conformance Per-2c
Another important aspect of indicators’ characterizations is the measuring dimensions to which they refer. Damjan Krajnc (2003), identify four, namely unit of measurement, type of measurement, boundaries and period of tracking and calculating, as show in the Figure 11. Type of measurement refers, to quantitative or qualitative measurement, boundaries refer how far a company wishes to go in measuring the indicator, period of tracking and calculating refer to the default time interval in which we establish the measures, and units of measurements (kg, tones, volume etc).
To make a correct classification of indicators, it is important to identify a period for tracking and calculating the indicator (e.g. fiscal year, calendar year, 6 months, quarter, month) and define units of measurement (Krajnc and Glavic,2003). We must also identify a type of measurement (absolute or adjusted) and boundaries, which determine how far a company wishes to go in measuring the indicator.


![Figure 6.Seven steps to develop a KPI (web site [3]).](https://thumb-eu.123doks.com/thumbv2/123dok_br/17667909.825190/28.892.280.603.225.556/figure-seven-steps-to-develop-kpi-web-site.webp)