An empirical approach of the
distinctive aspects for socioeconomic development
Abstract
Purpose: This paper presents an integrative approach for examining key aspects, and their associations, of economic development.
Design/methodology/approach: After a cross-country cluster analysis of profiles related to select indicators, discriminant analysis of the clusters identified variables that most differentiate them. This assessment acknowledges that their level of capital endowment, and the ability to exploit it, is crucial to economic performance. Intangible aspects are the elements necessary for creation and maintenance of distinct economic development. Findings: Economies with lower skills and knowledge activities lose governance and cohesiveness, explaining unemployment and inequalities and influencing the consumer-confidence index. Economies with higher consumer-confidence use new communication
technologies. E-government and knowledge media play an important role since collective learning occurs through active social communication. As the learning environment matures, its elements gain new knowledge and entrepreneurship, valuing cohesiveness and governance.
Originality/value: This study contributes an original integrative approach to indicators for cross-evaluation, applied to economies/regions or firms. The complements between cluster and discriminant analyses consolidate and sustain the approach, helping
economists, policymakers, and researchers understand distinctive aspects of economic development and their associations for coping with future economic stress.
Article classification: Research paper
Keywords: governance, social capital, entrepreneurship, social cohesion, knowledge, economic development
A great paradox of this generation is the increasing scale and scope of global economic affairs reawakening sensitivities to local dynamics. Resolution depends on overcoming two corresponding trends: increasing inequality and increasing volatility (Pritchett, 1997). Technology that makes life more stimulating and prosperous for some makes it more precarious and uncertain for others (Ritzen and Woolcock, 2000). Thus, before questioning platforms of information technologies, supportive of collective learning, it is important to consider there are relevant differences among countries and significant disparities within them (Pezzini, 2003).
Accountability for the new risks of globalisation entails building more responsive institutions that anticipate problems and encourage leadership at all levels of society to
build bridges across widening social and economic layers. One effective tool is multi-level governance through functional integration, highlighting the limiting nature of traditional administrative boundaries for socioeconomic analysis (Cattan, 2002). Functional areas are based on labour mobility and local labour markets; most countries use them as a framework for socioeconomic territorial analysis and assessment of regional disparities. Often, such methods are inappropriate to detect crucial phenomena such as clusters and innovation systems.
Increasing organizational complexity, together with the growing scale of information technology, places new challenges on governance and development. Investing in social values based on mutuality and trust yield long-term benefits such as corporate well-being and innovativeness. Benefits are based on better knowledge-sharing and lower transaction costs due to communicative spirit, resulting in greater coherence of action (Widén-Wulff and Ginman, 2004). Capacity building and transfer of knowledge and resources support good governance and its policy framework. However, there is a need for deeper consideration of public institution quality and its relationship with sustained and equitable economic development. We need to know more about how to foster a greater sense of cooperation and inclusion in environments where there is
division and distrust. Cooperative people are not only productive workers, they are better citizens, implying a genuine sense of membership and responsibility from all
stakeholders and a commitment to work together.
The conceptualisation of the role of social relations has important implications for contemporary development research and policy. It is beginning to generate remarkable consensus regarding the importance of institutions and networks in terms of
development. The inclusion of social capital into organizational behaviour and institutional learning is recent and needs a solid theoretical framework (Granovetter,
1995). Both poor entrepreneurs operating small, local firms in traditional sectors whose networks contribute to reduce risk and uncertainty and larger firms that share knowledge about technology and global markets hinder economic progress (Barr, 1998). The
challenge to social capital theory, research, and policy is identifying conditions under which many positive aspects can be harnessed such as opening access to formal institutions.
The purpose of this paper is to contribute to a better understanding of how social, regulative, and economic aspects are anchored, and to explore the mechanisms behind this interaction. Measures and contexts for this type of research are suggested from empirical study. The goal is examining prevailing, underlying dimensions when tracing proxies from social capital association to governance and economic development. A cluster approach encourages new research approaches to fill gaps that exist in the literature since no standard methodology exists.
A cross-dimensional perspective
Concerning the empirical treatment of social capital, some authors separate it into three approaches: situational, socio-psychological, and cultural. Grootaert (1998) lists a number of indicators and summarizes them in two strands: horizontal and vertical social capital. Whiteley (2000) claims the concept covers two dimensions: behaviour,
influencing cooperation between formal institutions and stakeholders, and attitude, related to norms and trust. Independent of the dimensions, these studies acknowledge economic development is achieved best under good governance and in a good social environment.
Social cohesion and social capital are related intimately, requiring complementary institutions to manage opportunities, rights, transactions, and information, all of which determine social prosperity (Ritzen and Woolcock, 2000). When social capital refers to
the norms and networks enabling people to act collectively, it focuses on sources while recognising that important features such as trust and reciprocity are developed iteratively (Woolcock and Narayan, 2000). Economies endowed with diverse social networks and civic associations are in a stronger position to confront vulnerability (Narayan, 1995). However, sources of social capital need to be distinguished from the consequences derived from them. Attributing desirable outcomes alone to social capital ignores the possibility that these outcomes may be sub-optimal, and desirable outcomes attained today come at significant costs tomorrow.
Weak, hostile, or indifferent governments have a profoundly different effect on development than governments respecting civil liberties, honouring contracts, and resisting corruption (Isham and Kaufmann, 1999). Svendsen (2003) argues that power centralisation distorts economic freedom, lowering general trust toward institutions. Other approaches rely on quantitative, cross-national studies of the effects of governance and social cohesion on growth, equating social capital with the quality of political, legal, and economic institutions (Knack and Keefer, 1997; Knack, 2002; Zak and Knack, 2001). Drawing on various indices of institutional quality, studies show that issues such as trust, civil liberty, and bureaucratic quality are associated positively with economic performance. The most comprehensive definitions of social capital are multidimensional, incorporating multiple levels of analysis. The nature of social capital changes as balance shifts between informal organisations and formal institutions. Since no long-standing, cross-country surveys measure social capital, contemporary researchers had to compile indices from a range of proxy measures (e.g., trust, confidence, social mobility,
partnerships).
Although this is difficult to achieve since the circumstances of each country are unique, growth research offers insight into generalisations by revealing summative
patterns (Temple, 2001). Among the dimensions proposed recently, social capital seems an effective method of discriminating countries and their growth prospects; it provides an overarching term for those aspects of society that, though difficult to measure, are
important determinants of long-run economic success. Putnam (2000) argues that at the enterprise or country level, quality of life and governance is higher if membership offers active participation. Edwards and Foley (1998) are critical of approaches that focus on items such as social psychological attributes or use behavioural measures such as trust and personal membership; they argue in favour of approaches concentrating on social relations that place questions of power and inequality at the centre.
Proposing a framework to monitor implementation of the European Union’s (EU) sustainable development strategy, the European Commission (2005) arranged indicators into three dimensions: economic, social, and behavioural. Variables grouped into the economic dimensions included GDP growth, unemployment, labour productivity, and R&D expenditures. Items related to the social dimension included income inequality, job mobility, and tertiary education attainment. Items for the behavioural dimension included trust, partnerships, consumer confidence, and life-long learning. This framework is a step toward a common culture that contributes to coordinating both several layers more efficiently and agents involved through an integrative approach. An important feature to note is that these dimensions include different types of measures, becoming more complex when considering cross-dimensional influences (Bassanini et al., 2000). Thus, only cross-national research, attention to differences in political and socioeconomic contexts among countries, and longitudinal designs can examine them.
Contributing to the inclusiveness of its institutions, a country’s social cohesion plays a vital role in managing effective policy response to the stresses of a global
for their country, and act accordingly. Socioeconomics, preferences, choices, and behaviours are invisible, intangible driving forces for both economic and social development, and are not surveyed fully from an integrative perspective. A cluster approach to assess primary dimensions
Dealing with intangible issues entails a number of risks; measurement is problematic and some are highly context-dependent, which causes difficulties when attempting to
aggregate them across levels. Nevertheless, they help counterbalance reliance on policy concepts and instruments too narrow to deal with contemporary complexities. For example, technological innovation and human capital are both powerful and essential developmental features, but they cannot be removed from social relationship contexts. Merely increasing the stock of human capital in any society does not ensure social or economic progress. This focus on relationships allows the issue of social cohesion to be addressed; its maintenance contributes indirectly to enhanced economic performance.
The economy is not a machine to be engineered technically without reference to social contexts; quality of relations is a determinant of its sustainability. Where there is low trust and poor communication, exclusive focus on increasing skills and qualifications does little to reverse social exclusion. A related question concerns how information technologies enhance social cohesion, for example, in learning systems or when
enhancing human capital locally (Schuller, 2001). Deriving a framework that overcomes some of these aims and risks, an empirical approach bases its steps on:
1. a cross-country cluster analysis of profiles related to a set of indicators (variables) reflecting these concerns (Appendix 1)
2. a discriminant analysis of the clusters obtained, emphasizing variables that most differentiate them. This reveals underlying dimensions when dealing with social capital and its association to governance and economic development.
These two analyses returned the following output:
TAKE IN TABLE 1 HERE TAKE IN TABLE 2 HERE
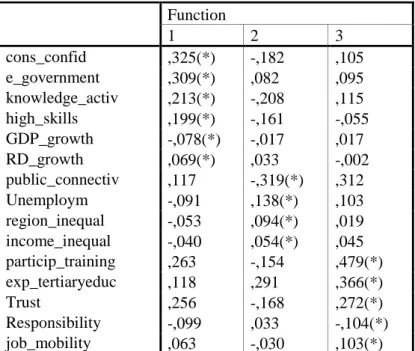
The structural matrix (Table 2) shows the pooled within-group correlations between the discriminant variables and three standardised canonical discriminant functions. The values marked within functions indicate the largest absolute correlation between each variable and any discriminant function, ordered by absolute size of the correlations among functions. The underlying dimensions of this approach are based on three functions, and each function is characterised by the variables with the largest absolute correlation. So, the general behaviour of each function (expressed by name) relates to the common goal or profile of variables most correlated with it. Thus, the three functions are named:
1. F1: Governance (cons_confid; e_government; knowledge_activ; high_skills; GDP_growth; RD_growth);
2. F2: Cohesiveness (public_connectiv; unemploym; region_inequal; income_inequal);
3. F3: Entrepreneurship (particip_training; exp_tertiaryeduc; trust; responsibility; job_mobility).
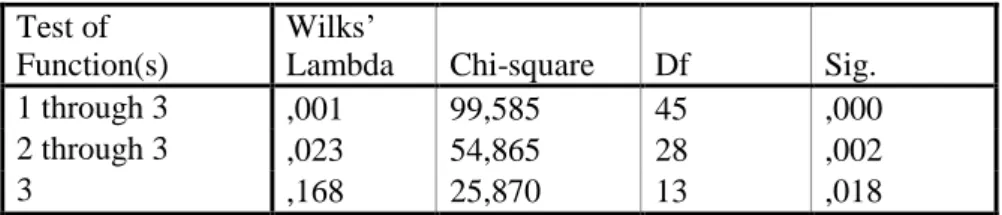
Due to the negative relationship of the variables most correlated with Function 2 (i.e., unemployment, region inequality, and income inequality), its real behaviour is lacking cohesiveness. Two functions emerged as most significant: F1 (Governance) and F2 (Cohesiveness). Table 3 shows the results of the Wilks’ Lambda, a coefficient proportional to intra-group variability.
TAKE IN TABLE 3 HERE
Since those two functions have lower coefficients and demonstrate less intra-group variability, they explain inter-group variability most significantly. Consequently, the focus is on the variables most correlated with these discriminant functions since they represent the features that most differentiate the groups. A joint analysis of these issues is
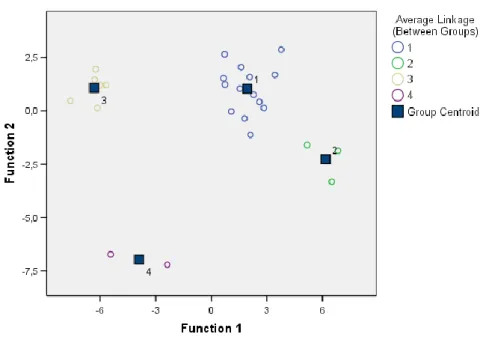
important since the variables influence the results not only individually, but also jointly, with their inter-correlations having varying impacts on group formation. The map in Figure 2 shows the clusters’ positioning on a cross-functional discriminant plan, between functions F1 and F2.
TAKE IN FIGURE 2 HERE
Figure 2 confirms the four clusters obtained previously in the dendogram (Figure 1), which, based on common behavioural patterns under the clustering algorithm, group the following countries:
1. Cluster 1 (13 cases): Belgium, Czech Republic, Germany, Estonia, Spain, France, Ireland, Italy, Lithuania, Netherlands, Austria, Slovenia, United Kingdom
2. Cluster 2 (3 cases): Denmark, Finland, Sweden
3. Cluster 3 (6 cases): Greece, Cyprus, Latvia, Poland, Portugal, Slovakia 4. Cluster 4 (2 cases): Luxembourg, Hungary
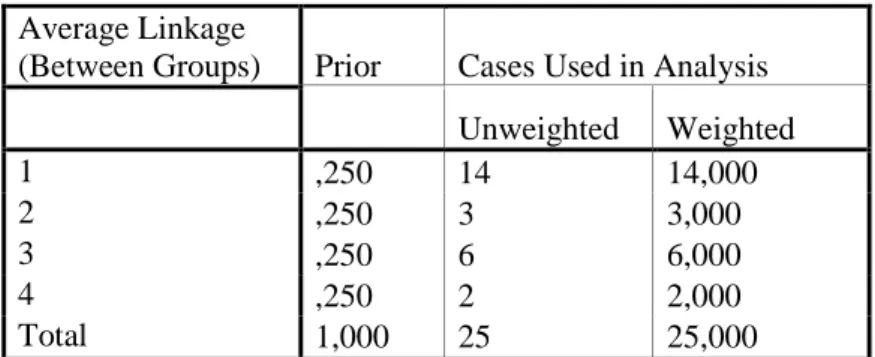
Table 1 shows 14 cases in Cluster 1 instead of 13 cases as indicated above because it includes the EU as a case that, on average, behaves like the countries in the cluster. Further discussions consider and compare only countries. Cluster 4 was discarded from analysis due to two limitations. First, it contains only two countries that are very different; second, few data were available for these countries in terms of the indicators (variables) considered. The three remaining clusters are characterized according to their position or behaviour patterns across the two primary discriminant functions (F1 and F2):
1. Cluster 2 shows significant governance and cohesiveness (its real behaviour lacks cohesiveness due to the negative relationship with variables correlated in
Function 2).
2. Clusters 1 and 3 lack cohesiveness, and Cluster 3 lacks governance.
Research questions based on results
A question that arises from the results is why Cluster 1 does not lack governance since it lacks cohesiveness like Cluster 3. An explanation is related to the behaviour of F3 (Entrepreneurship); since the variables high skills and knowledge activity are higher in Cluster 1 than in Cluster 3 (Appendix 1), the countries in the latter group spend less on
tertiary education and participative training. This explains higher unemployment and inequalities in Cluster 3, factors that influence the consumer-confidence index. Thus, citizens of these countries reclaim more trust and responsibility from institutions and governance. These arguments are based on the correlation coefficients between the variables (Appendix 2).
Another question is why Cluster 2 is so succeeded in the underlying dimensions of this approach. Observing the table of data for the variables (Appendix 1), the countries in Cluster 2 are the only ones in which the consumer-confidence index is positive and relatively high. Comparing it with the variables related to public efficiency (e.g., public-connectivity and e-government), there is a significant correlation between them
(Appendix 2). These countries experience considerable trust, high skills, and knowledge activity. It is interesting to note that these countries reclaim responsible institutions least.
Countries with high trust are more likely to use new communication technologies. People are more likely to use the Internet for commerce, confident in safe online
transactions. E-government, e-services, and knowledge media play an important role because collective learning occurs through active social communication. Recent studies emphasize the importance of e-government; examining it as a platform, regions and communities as a whole learn in addition to individuals. (Homburg, 2008). As this learning environment matures, its elements gain new knowledge and skills, and share them, valuing cohesive commitment. These results are consistent with recent studies (Filippetti and Archibugi, 2011) where, for example, Portugal (Cluster 3) appears in a cluster labelled Lagging-behind, characterized by low national innovation. These authors defend the importance of cohesiveness and governance since they acknowledge the need for a European system of innovation to face future major crises in which cohesive networks and more articulated policies are crucial.
Based on reports from the United Nations concerning population evolution, Nijkamp (2011) argues cities will increase beyond virtual and physical proximities. Countries must analyze and plan for this prediction well, considering resources carefully. These issues are urgent and require new policies for combining knowledge due to high accessibility. In an open, cooperative environment―and without losing
competitiveness―motivation, and resulting economic performance, will be higher (Nijkamp, 2011; Sharp, 1998).
Limitations and future research
Knowing which measures are most useful in a setting and how best to use them in research depends on issues such as data availability, scale of analysis, and methodology. Several analytic techniques are appropriate for answering various types of research questions. Choosing the most relevant and efficient measurement approach depends on the research and evaluation setting. Where data or resources are limited, adhering to the principles of a common framework enables a standard approach applicable to any
context. Individual-level data should be aggregated to provide a picture of socioeconomic system wealth in a particular country. However, this introduces some limitations since information is restricted to respondent perceptions and experiences. Existing aggregated data may be useful as a measure answering research questions that could interpret relationships between social aspects and various outcomes.
There are major weaknesses, both in the availability of data and in the extent to which data can explain variations in economic and innovation performance. One solution is the broadening of sustainable development to include social, economic, and
environmental factors as central relationships. Another is the challenge it presents for broader, more dynamic approaches to policymaking. One of its recent forms is resilience that addresses the interaction between open innovation and change or the maintenance of
trust and stability (DeAngelis, 2010; Reinmoeller and Baardwijk, 2005). A socioeconomic analysis of local conditions may reveal the weaknesses of supply-focussed policies, and point to the need for wider, integrative, and multilevel policy action, contributing to developing indicators, variables, and dimensions that are more appropriate.
Another limitation is the few number of countries analyzed since more countries will surmount disequilibrium among the clusters obtained. Underdeveloped countries should be included since they double the developed group, and their decreasing
conditions threaten global economy. A longitudinal analysis is needed so changes can be analysed and trajectories captured. There are controversial trends to consider such as the polarisation of network density, threatening the ways resources are accumulated and shared, and external job mobility, influencing successful development by reducing local employment. If social participation and cohesion are to improve, more sophisticated and flexible instruments are needed for assessing and evaluating the implications, requiring widely differing time scales.
Ensuring necessary data in a longer period requires completing lists of best available and best needed indicators (European Commission, 2005). The former refers to those that can be produced from extant data, which may not be ideal but serve as proxies. The latter are related to qualitative or intangible problems for which the quality of extant data is low or the desegregation needed is inadequate (Kaplan and Norton, 2004). These difficulties call for different kinds of research related to concepts and data collection procedures. These concerns reveal the importance of appropriate indicators that inform policymakers and the public of the latest trends. Lists of indicators can be adapted in line with priorities emerging in the contexts of governance, social cohesion, social capital, and technological and institutional learning; they contribute to design strategies more
capable of facing economic crises and achieving a balance among economic development, social cohesion, and effective governance.
Conclusions
Corporations and stakeholders are variables influencing attainment of collective goals. Since countries or firms alone do not have the resources to promote sustainable
development, complementarities and partnerships forged both within and across these dimensions are required. A focus on horizontal and vertical relationships, and on the sharing of information and resources, suggests a different form of coordination developed through ongoing interaction among stakeholders. Sustainable development policies must adopt a systemic approach directed toward a strategic system of
interventions, not focused on the individual agents due to the multiplicity of their choices and behaviours.
When information asymmetries exist, agents are motivated to pursue their own interests, requiring rules and social norms for reducing asymmetries. Many partners and conflicting interests paralyse decision-making processes, requiring strategic mechanisms such as negotiation and progressive convergence toward shared views. Identifying the conditions under which these synergies emerge or fail to emerge is a central task of both research and practice (Evans, 1996). A networked form of governance is desirable to achieve a dynamic coordination of multilateral interactions among agents, involving them in the process of setting and achieving goals. These are likely to improve the circulation of information among partners, and increase understanding of distributed information. There is a need for accountability mechanisms that reinforce partner trust to control fulfilment of mutual engagements, account for results, and use resources. Future research should test operative questions such as (1) do government institutions meet requirements and (2) what steps can be taken to adjust these institutions.
Woolcock (1998) suggests a range of development outcomes flows from combinations of firm capacity and country governance. Narayan and Cassidy (2001) argue different strategies are needed for combinations of governance and social cohesion. The synergy view suggests three central tasks for researchers and policymakers: (1) identify the nature and extent of social relationships and formal institutions, (2) develop integrative strategies based on these aspects, and (3) determine how positive attributes of social capital (e.g., cooperation, trust, institutional efficiency) offset crises. To develop concrete policy and management recommendations, more comparative research is required to examine cross-country variations in institutional performance, innovation, and economic sustainability.
Although it is early to announce a new development paradigm, it is reasonable to claim that a consensus is emerging concerning the importance of resilience strategies and economic openness (Kitching et al., 2009). Unpacking the literature on resilience and development, a recurring message is that the nature and extent of interactions between firms, institutions, and stakeholders hold the key to understanding economic
development. Practical lessons emerging from development projects should inform economic theory. It is only under collaborative efforts, with all involved regarding negotiation and mutual willingness to learn, that genuine progress takes place (Leadbeater, 1999).
It is clear that the negative effects of the world economic crisis are remarkable and not likely to decrease in the immediate future (Hodson and Quaglia, 2009). Since the recession hit several European countries, this also influences the process of EU economic convergence. Strengthening the laggard countries may be a crucial strategy for allowing them to compete in a global economy (European Commission, 2010). Discussion of development shifts from a focus on growth to resilience and economies facing rapid
transitions in technology and markets. The resilience discussion emerges into a debate about the role of entrepreneurship in developing long-run, adaptive capacities (Hamel and Valikangas, 2003).
Treado and Giarratani (2008) suggest institutional capacities and firm networks are the most critical factors for managing transitions. It is fundamentally the presence of a skilled creative labour market under an entrepreneurial environment (Fernandes, 2010; Gertler and Wolfe, 2002). Antlová (2010) argues that lack of convenient technology solutions and related skills and knowledge is higher than the correlation between insufficient financial resources and stagnation.
References
Antlová, K. (2010), “ICT competencies and knowledge alignment in small and medium enterprises”, Information and Communication Technologies for the Advanced
Enterprise, Vol. 1 No. 1, pp. 125-139.
Barr, A. (1998), “Enterprise performance and the functional diversity of social capital”, working paper series 98-1, University of Oxford, UK.
Bassanini, A., Scarpetta, S. and Visco, I. (2000), “Knowledge, technology and economic growth: recent evidence from OECD countries”, Economics Department working paper No. 259, OECD, Paris.
Cattan, N. (2002), “Redefining territories: functional regions”, report CNRS-UMR Géographie-cités, OECD, Paris.
DeAngelis, S. (2010), “The ups and downs of open innovation. Enterprise resilience management blog”, available at:
http://enterpriseresilienceblog.typepad.com/enterprise_resilience _man/2010/07/the-ups-and-downs-of-open-innovation.html (accessed 15 July 2010).
Edwards, B. and Foley, M. (1998), “Social capital and civil society beyond Putnam”,
American Behavioural Scientist, Vol. 42 No. 1, pp. 124-139.
European Commission (2010), “Regional innovation scoreboard (RIS) 2009”, report DG Enterprise and Industry, Brussels.
European Commission (2005), “Sustainable development indicators to monitor the implementation of the EU sustainable development strategy”, communication to the members of the Commission, 9 February, Brussels, available at:
http://epp.eurostat.ec.europa.eu/portal/page/
portal/sdi/files/SEC(2005)161%20SDI%20COMMUNICATION%20EN.pdf (accessed 10 February 2010).
Evans, P. (1996), “Government action, social capital and development: Reviewing the evidence on synergy”, World Development, Vol. 24 No. 6, pp. 1119-1132. Fernandes, S. (2010), “Business intelligence and contribution of entrepreneurial
information architecture”, in Varajão, J. (Ed.), Enterprise Information Systems - Part
2, Springer-Verlag, New York, pp. 73-82.
Filippetti, A. and Archibugi, D. (2011), “Innovation in times of crisis: national system of innovation, structure and demand”, Research Policy, Vol. 40 No. 2, pp. 179-192. Gertler, M. and Wolfe, D. (2002), Innovation and Social Learning: Institutional
Adaptation in an Era of Technological Change, Palgrave Macmillan, New York.
Granovetter, M. (1995), “The economic sociology of firms and entrepreneurs”, in Portes, A. (Ed.), The Economic Sociology of Immigration: Essays on Networks, Ethnicity
and Entrepreneurship, Russell Sage Foundation, New York, pp. 128-165.
Grootaert, C. (1998), “Social capital: The missing link?”, Social Capital Initiative working paper No. 3, The World Bank, Washington D.C., USA.
Hamel, G. and Valikangas, L. (2003), “The quest for resilience”, Harvard Business
Review, Vol. 81 No. 9, pp. 52-63.
Hodson, D. and Quaglia, L. (2009), “European perspective on the global financial crisis: Introduction”, Journal of Common Market Studies, Vol. 47 No. 5, pp. 939-953. Homburg, V. (2008), Understanding e-Government. Information Systems in Public
Administration, Routledge, New York.
Isham, J. and Kaufmann, D. (1999), “The forgotten rationale for policy reform: the productivity of investment projects”, Quarterly Journal of Economics, Vol. 114 No. 1, pp. 149-184.
Kaplan, R. and Norton, D. (2004), “Measuring the strategic readiness of intangible assets”, Harvard Business Review, Vol. 82 No. 2, pp. 52-63.
Kitching, R., Blackburn, R., Smallbone, D. and Dixon, S. (2009), “Business strategies and performance during difficult economic conditions”, Report for the Department of Business Innovation and Skills, Kingston University, UK.
Knack, S. (2002), “Social capital and the quality of government: Evidence from the U.S. States”, American Journal of Political Science, Vol. 46 No. 4, pp. 772-785.
Knack, S. and Keefer, P. (1997), “Does social capital have an economic payoff? A cross-country investigation”, Quarterly Journal of Economics, Vol. 107 No. 4, pp. 1252-1288.
Leadbeater, C. (1999), Living on Thin Air: The New Economy, Penguin Books, Harmondsworth.
Narayan, D. (1995), “Designing community-based development”, Social Development paper No. 7, The World Bank, Washington D.C.
Narayan, D. and Cassidy, M. (2001), “A dimensional approach to measuring social capital”, Current Sociology, Vol. 49 No. 2, pp. 59-102.
Nijkamp, P. (2011), “Creative hotspots in a triangle”, paper presented at the International Conference Series on Innovation for Sustainability, January 20-21, Faro, Portugal. Pezzini, M. (2003), Cultivating regional development: main trends and policy challenges
in OECD regions, Head of Territorial Reviews and Governance Division, OECD, Paris.
Pritchett, L. (1997), “Divergence, big time”, Journal of Economic Perspectives, Vol. 11 No. 3, pp. 3-17.
Putnam, R. (2000), Bowling Alone: The Collapse and Revival of American Community, Simon & Schuster, New York.
Reinmoeller, P. and Baardwijk, N. (2005), “The link between diversity and resilience”,
MIT Sloan Management Review, Vol. 46 No. 4, pp. 61-65.
Ritzen, J. and Woolcock, M. (2000), “Social cohesion, public policy, and economic growth: implications for countries in transition”, paper presented at the Annual Bank Conference on Development Economics, June 26-28, Paris, France.
Schuller, T. (2001), “The complementary roles of human and social capital”, Isuma, Vol. 2 No. 1, pp. 18-24.
Sharp, M. (1998), “Competitiveness and cohesion – are the two compatible?”, Research
Policy, Vol. 27 No. 6, pp. 569-588.
Svendsen, G. (2003), Political Economy of the European Union: Institutions, Policy and
Economic Growth, Edward Elgar, Cheltenham, UK.
Temple, J. (2001), “Growth effects of education and social capital in the OECD countries”, OECD economic studies, Paris.
Treado, C. and Giarratani, F. (2008), “Intermediate steel-industry suppliers in the Pittsburgh region: A cluster-based analysis of regional economic resilience”,
Economic Development Quarterly, Vol. 22 No. 1, pp. 63-75.
Whiteley, P. (2000), “Economic growth and social capital”, Political Studies, Vol. 48 No. 3, pp. 443- 466.
Widén-Wulff, G. and Ginman, M. (2004), “Explaining knowledge sharing in organizations through the dimensions of social capital”, Journal of Information
Science, Vol. 30 No. 5, pp. 448-458.
Woolcock, M. (1998), “Social capital and economic development: Toward a theoretical synthesis and policy framework”, Theory and Society, Vol. 27 No. 2, pp. 151-208.
Woolcock, M. and Narayan, D. (2000), “Social capital: Implications for development theory, research and policy”, The World Bank Research Observer, Vol. 15 No. 2, pp. 225-249.
Zak, P. and Knack, S. (2001), “Trust and growth”, The Economic Journal, Vol. 111 No. 470, pp. 295-321.
Figure 1. Clusters from cluster analysis (dendogram) Source: SPSS 17.0 (own elaboration)
hierarchical cluster analysis
Dendrogram using Average Linkage (between Groups)
Rescaled Distance Cluster Combine
C A S E 0 5 10 15 20 25 Label Num +---+---+---+---+---+ Poland 19 Slovakia 22 Latvia 13 Greece 7 Portugal 20 Cyprus 12 Czech Republic 3 Lithuania 14 France 9 Italy 11 Belgium 2 Ireland 10 Slovenia 21 Austria 18 United Kingdom 25 Germany 5 Spain 8 EU25 1 Estonia 6 Netherlands 17 Luxembourg 15 Hungary 16 Denmark 4 Finland 23 Sweden 24 Cluster 3 Cluster 1 Cluster 2 Cluster 4
Table 1. Prior probabilities for groups (clusters) Source: SPSS 17.0 (own elaboration)
Average Linkage
(Between Groups) Prior Cases Used in Analysis
Unweighted Weighted 1 ,250 14 14,000 2 ,250 3 3,000 3 ,250 6 6,000 4 ,250 2 2,000 Total 1,000 25 25,000
Table 2. Structure matrix (discriminant analysis) Source: SPSS 17.0 (own elaboration)
Function 1 2 3 cons_confid ,325(*) -,182 ,105 e_government ,309(*) ,082 ,095 knowledge_activ ,213(*) -,208 ,115 high_skills ,199(*) -,161 -,055 GDP_growth -,078(*) -,017 ,017 RD_growth ,069(*) ,033 -,002 public_connectiv ,117 -,319(*) ,312 Unemploym -,091 ,138(*) ,103 region_inequal -,053 ,094(*) ,019 income_inequal -,040 ,054(*) ,045 particip_training ,263 -,154 ,479(*) exp_tertiaryeduc ,118 ,291 ,366(*) Trust ,256 -,168 ,272(*) Responsibility -,099 ,033 -,104(*) job_mobility ,063 -,030 ,103(*)
Table 3. Wilks’ lambda test
Source: SPSS 17.0 (own elaboration) Test of
Function(s)
Wilks’
Lambda Chi-square Df Sig.
1 through 3 ,001 99,585 45 ,000
2 through 3 ,023 54,865 28 ,002
Figure 2. Map with clusters across discriminant functions Source: SPSS 17.0 (own elaboration)
Appendix 1 Country consumer confidence (1) Real GDP growth rate (2) unemploy ment (2) knowledge activity - KIS (2) job_to_job
mobility (3) high skills (2)
participation in training (1) regional inequalities (1) income inequalities (3) public connectivity (2) Trust (4) more responsibility (4) E-government availability (2) R&D expend. growth rate (3) expenditure on tertiary education (1) EU25 -11,6 2 9,2 33,1 : 38,4 9,4 : : 21,2 : 8,9 41 2,7 37,1 Belgium -14,1 2,9 8,4 38,6 5,2 43,5 9,5 1,18 4,3 : 29,2 7,6 35 6,2 42 Czech Republic -0,1 4,4 8,3 24,6 4,4 37,7 6,3 0,99 3,4 3,1 24,5 5,8 30 9,2 37,6 Denmark 15,4 2,1 5,5 42,3 10,9 43,2 27,6 : 3,6 42,5 66,5 1,3 58 5,2 50,5 Germany -14,1 1,6 10,3 33,4 5,7 41,8 6 0,92 4,3 31,3 37,5 6,5 47 1,2 41,4 Estonia -10,3 7,8 9,7 27,5 7,4 39 6,7 1,54 5,9 14,2 23,5 11 63 11,7 : Greece -34,7 4,7 10,5 24,9 : 32,6 3,7 0,8 6,6 7,2 23,8 9,3 32 3,4 24,9 Spain : 3,1 11 26,1 6,5 30,7 5,2 1,04 5,1 22 34 18,9 55 12,7 34,7 France -13,2 2,3 9,6 36,2 8,1 38,6 7,8 0,75 : : 21,3 3,8 50 1,1 32 Ireland -4,2 4,5 4,5 33,4 : 40,1 7,2 : 5,1 11,4 36,1 4,6 50 3,5 29,4 Italy -20,5 1,2 8 30,2 4,6 39,2 4,7 1,31 : : 32,6 12,2 53 5,9 31,3 Cyprus -39,6 3,8 4,9 26,2 7,6 28,2 9,3 : 4,1 10,4 : : 25 14,1 48 Latvia -15,2 8,3 10,4 24,6 7 33,8 9,1 2,21 : 12,1 17,1 20,7 5 5,3 33,9 Lithuania -7,3 7 11,4 25 4,9 33 6,5 0,96 : 8,9 25,9 13,7 40 9,8 35 Luxembourg -4,2 4,5 4,8 38 4 45,4 6,3 : 4 35,6 24,8 5,4 20 : : Hungary -24,2 4,6 6,1 28,5 4,1 34,2 4,6 1,22 : 14,9 22,3 17,4 15 5,1 : Netherlands -6,7 1,7 4,6 41 : 49,4 16,5 1,01 : 17,2 60,1 0,8 32 2,7 43,9 Austria -5,2 2,4 4,9 31,3 5,5 37,6 12 1,19 4 17,6 33,4 4,2 72 4,8 41,4 Poland -20 5,3 19 24,3 4,9 31,7 5,5 1,35 : 11,9 18,4 14,5 10 -3,8 43,4 Portugal -41,2 1,2 6,7 22,2 5,6 25,9 4,8 1,17 7,4 10,3 12,3 9,1 40 -2,4 26,7 Slovenia -20,6 4,2 6,3 24,2 5,9 36,1 17,9 0,58 : 11,7 21,7 19,8 45 2,5 38,2 Slovakia -23,5 5,5 18,2 25,1 : 35,2 4,6 1,38 5,4 20,9 15,9 17,1 15 1,3 37,7 Finland 13,2 3,6 8,8 40,3 9,5 43,4 24,6 1,12 3,6 43,3 57,5 2,9 67 2 43,2 Sweden 6,3 3,6 6,5 47 3,1 44,1 35,8 0,77 : 35,8 66,3 1,9 74 12,4 56,1 United Kingdom -2,9 3,2 4,7 42,1 10,2 40,6 21,3 0,75 5,3 19,5 28,9 3,4 59 5,9 42,7
Sources: Eurostat, OECD, WVS Consumer confidence indicator: financial situation; general economic situation; unemployment expectations;savings (1) year 2005 Knowledge activity - KIS: employment in knowledge services as a % of total employment
(2) year 2004 Participating in education and training (Lifelong learning) Europe in figures, Eurostat yearbook 2005
(3) year 2003 Regional inequalities: measured using the standard deviation of the logarithm of Regional GDP per capita (Barrios & Strobl, 2005). (4) World Values Survey 1999/2000 Public connectivity - share of individuals using the internet for interacting with public authorities
Appendix 2 Spearman’s Coefficient cons_ confid GDP-growth Unemp loyment knowledge activity job- mobility high-skills particip-training region-inequal income- inequal public-connectiv Trust responsi bility e-govern ment RD-growth exp- tertiaryeduc cons_confid 1,000 -,107 -,242 ,617** ,181 ,587** ,566** -,283 -,085 ,533** ,717** -,459* ,581** ,258 ,323 GDP-growth -,107 1,000 ,342 -,403* -,128 -,309 -,227 ,259 ,030 -,070 -,318 ,437* -,418* ,160 -,274 Unemployment -,242 ,342 1,000 -,489* ,005 -,453* -,466* ,480* ,008 -,122 -,315 ,607** -,228 -,074 -,145 Knowledge activity ,617** -,403* -,489* 1,000 ,092 ,850** ,596** -,372 -,071 ,474* ,667** -,721** ,513** ,100 ,391 Job-mobility ,181 -,128 ,005 ,092 1,000 -,065 ,385 -,003 ,095 ,102 ,046 -,153 ,368 ,168 ,239 high-skills ,587** -,309 -,453* ,850** -,065 1,000 ,540** -,250 -,139 ,374 ,667** -,554** ,386 -,052 ,273 particip-training ,566** -,227 -,466* ,596** ,385 ,540** 1,000 -,383 -,275 ,357 ,395 -,596** ,506** ,202 ,668** region-inequal -,283 ,259 ,480* -,372 -,003 -,250 -,383 1,000 ,023 -,159 -,141 ,536** -,190 ,020 -,185 income-inequal -,085 ,030 ,008 -,071 ,095 -,139 -,275 ,023 1,000 ,042 -,018 -,060 ,138 ,018 -,223 public-connectiv ,533** -,070 -,122 ,474* ,102 ,374 ,357 -,159 ,042 1,000 ,396* -,233 ,310 -,111 ,334 Trust ,717** -,318 -,315 ,667** ,046 ,667** ,395 -,141 -,018 ,396* 1,000 -,440* ,594** ,210 ,350 Responsibility -,459* ,437* ,607** -,721** -,153 -,554** -,596** ,536** -,060 -,233 -,440* 1,000 -,395 -,063 -,528** e-government ,581** -,418* -,228 ,513** ,368 ,386 ,506** -,190 ,138 ,310 ,594** -,395 1,000 ,263 ,208 RD-growth ,258 ,160 -,074 ,100 ,168 -,052 ,202 ,020 ,018 -,111 ,210 -,063 ,263 1,000 ,137 exp-tertiaryeduc ,323 -,274 -,145 ,391 ,239 ,273 ,668** -,185 -,223 ,334 ,350 -,528** ,208 ,137 1,000
* Correlation is significant at the 0.05 level (1-tailed) ** Correlation is significant at the 0.01 level (1-tailed)