Inácia Pimentel, Miguel St.Aubyn & Nuno Ribeiro
The impact of investment in Public Private
Partnerships on Public, Private investment
and GDP in Portugal
WP13/2017/DE/UECE
_________________________________________________________
De pa rtme nt o f Ec o no mic sW
ORKINGP
APERS1
The impact of investment in Public Private
Partnerships on Public, Private investment and
GDP in Portugal
Inácia Pimentel, Miguel St.Aubyn and Nuno Ribeiro
2
Contents
Abstract
1. Introduction
2. Literature Review
3.Econometric methodology
3.1 VAR specification
3.2 Macroeconomic rates of return
3.3 Crowding-in and crowding-out effects
4.Empirical Results
4.1 Data
4.2 VAR estimation
4.3 Rates of return
4.4 Crowding-in and crowding-out effects
5.Conclusions
3
Abstract
In this paper we test the macroeconomic impact of investment in public-private partnerships, public and private investment in Portugal through a VAR model with four variables: public and private investment, PPP investment and GDP, to the period 1998-2013. An assessment of crowding-in / crowding-out effects of investment in PPPs is carried out. We also proceed to the calculation of macroeconomic rates of return on investment in PPP, public investment and private investment. The results show that public and private investment has a positive effect in GDP while investment in PPP reduces the Portuguese GDP. In what concerns to crowding-in/crowding-out effects an increase in PPP investment crowds-out both in private and public investment, while public investment presents a crowding-in effect both in private investment and in investment in PPP; and private investment shows the same crowding-in effect both in investment in PPP and in public investment.
4
1. Introduction
In the 1980s and 1990s an extensive privatization program took place in the countries of
Western Europe. These privatizations were motivated by the idea that the private sector
shows higher efficiency standards in the management of companies in comparison to
public management. However, they remained some reservations about the private sector
capacity to ensure the management of natural monopolies and large infrastructure with
high sunk costs more efficiently than the public sector.
In the latter case, Public-Private Partnerships (PPP) imposed itself, more recently, as
alternatives for financing investment projects traditionally funded by taxation and
executed in the sphere of public sector.
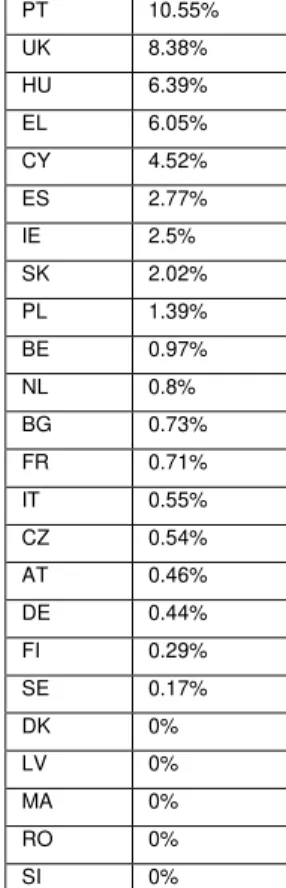
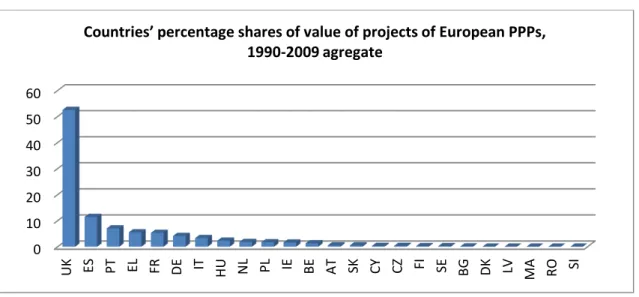
This paper studies the impact of investment in Public Private Partnerships on public and private investment and GDP in Portugal. The focus on Portugal is due to two main reasons. On the one hand, Portugal is the European country that, between 1990 and 2009, has spent the higher amount of money in PPP in percentage of its GDP (10.55%), representing 7% of the value expended in European PPPs and being the third largest PPP market by value in Europe. See table 1 and figure 1. On the other hand, the memorandum of understanding for Portugal demanded a study of the impact in the country’s economy of the investment made in PPPs.
Being so, an assessment of crowding-in / crowding-out effects of investment in PPPs is carried out. Additionally, we proceed to the calculation of macroeconomic rates of return on investment in PPP, public investment and private investment aimed at quantifying the impact of each of these components of investment in GDP.
5 From a macroeconomic point of view, it is important to have a criterion for assessing the
desirability of the investment financed through PPPs, by contrast to public investment
and private investment.
The main novelty of this paper is the use of a VAR-model technology applied to investment in PPPs with four variables: PPP investment, public investment, private investment and GDP. This type of model enables to identify a shock to a variable, which is an independent innovation that may occur in other variables. It also has the advantage of allowing the evaluation of the dynamic effects of all variables in the analysis and overcome the issue of endogeneity of the regressors.
6
2. Literature Review
The term PPP has been used more frequently in the literature since the 90s. “The public-private partnerships (PPP) phenomenon has been with us for a long time. The phrase first became used by a specialist audience in the 1970s, and books were being written about such partnerships even in the 1980s (e.g. Rose, 1986), although it was the 1990s before it was widely recognized, when the Private Finance Initiative was launched by the John Major administration in the UK, and the acronyms ‘PPP’ became common currency.
However, the actual phenomenon goes much further back into history.” Bovaird (2010). And it is used to refer to different types of contracts between the public and private sector. Argy (1999).
However there is some consensus in what concerns the key elements of a PPP. Being so, and as it can be found in Livro verde para as parcerias público-privadas (2004), the main elements that characterize a PPP are:”(…) the relatively long duration of the
relationship, involving cooperation between the public partner and the private partner
(…); (…)the method of funding the Project, in part from the private sector, sometimes by
means of complex arrangements between the various players(…); (…)the distribution of
risks between the public partner and private partner(…).
Other definitions can be found in Van Ham e Koppenjan (2001) and Iossa and Martimort (2008).
Broadbent and Laughlin (1999) were pioneers in this field of investigation, raising five main questions for the study of PPPs in England, namely: “Is PFI a form of privatisation
of the public sector? What is the nature of PFI and who is regulating its application? How are definitions of PFI in terms of value for money and risk transfer derived and operationalised? How are PFI decisions made in different areas of the public sector and what are the effects of these decisions? What is the merit and worth of PFI?”
The question of value for money (VfM) has been largely discussed in what concerns to PPPs. Hodge and Greve (2008) argue that “Value for Money is a purposely vague
concept and one designed to reorient the language of debate away from traditional
concerns such as choosing the “cheapest” competitive construction bid which meets the
public interest, towards discussion of whole-of-life costs, risk transfers and risk-adjusted discounted rates for specific large projects.”
7
a sample of ten major PFI case evaluations undertaken, the best deal was probably obtained in every case, and good value for money was probably achieved in eight of the
ten cases.” Pollock, Shaoul and Vickers (2002), Monbiot (2002), Bloomfield, Westerling and Carey (1998), Greve (2003) and Walker and Walker (2000) studied PPPs in the United Kingdom, United States, Europe and Australia, respectively and were unanimous in concluding that PPP where not the best option if VfM is taken into account.
Also in what concerns econometric studies related to PPPs Hammami, Ruhashyankiko and Yehoue (2006) carried out a first attempt “to analyze the determinants of PPPs in
infrastructure projects using the World Bank’s Private Participation in Infrastructure (PPI)
database on projects for developing countries during 1990-2003”.
Presently, the focus of investigation related to PPP has been changing. In fact, a new purpose is to understand the reasons why governments choose PPPs to investment in public infrastructures. “In other words, our renewed agenda items should tackle why
governments choose to introduce PPP despite the fact that projects can be financed
through traditional methods” Greve e Hodge (2008). In 1996 Terry said that “Private
financing promised a way to provide infrastructure without increasing the public sector
borrowing ratio.” In this context, Hodge (2002) calls the attention to the fact that the duration of a PPP can cover more than one parliamentary term and Flinders (2005) argues that ”Governments continue to display such an apparently blind commitment to
PPPs.”.
More recently Greve and Hodge (2008) up dated the study carried by Broadbent and Laughlin (1999). In their opinion the most relevant questions related to PPPs are: 1. What is the merit/worth of PPPs? 2. In what circumstances do PPPs provide an effective and efficient tool for governments in terms of simply VfM [value for money] and innovation? 3. In what circumstances do PPPs provide governments with a successful governance tool to overcome traditional governance failures? 4. How can PPPs be best regulated in the public interest in future? 5. What role to date have Auditors General undertaken in PPP evaluation, and how might we meta-summarize their assessment to date? 6. Why and how are PPPs promoted in some jurisdictions and not others? 7. What is the nature
and consequence of a global “PPP industry”? 8. What is the place of PPPs in
development activities? 9. What is the next chapter for PPPs and what are the implications?
8
crowding-in / crowding-out effects of investment in PPPs is carried out and macroeconomic rates of return on investment in PPP, public investment and private investment were calculated and aimed at quantifying the impact of each of these components of investment in GDP.
In fact, since Aschauer’s (1989a, 1989b) there has been interest in analyzing the effects of public investment on aggregate economic activity and also to investigate whether public investment crowds-in/crowds-out private investment.
Voss (2002) and Mittnik and Neaumann (2001) estimated the effects of public investment on GDP and the crowding-in/crowding-out effects using a VAR approach. Voss (2002) estimated a VAR model with GDP, public investment, private investment, the real interest rate, and deflators of private and public investment, for the US and Canada, for the period of 1947-1997 and concluded that public investment crowds-out private investment. Mittnik and Neaumann (2001) used a VAR model with GDP, private investment, public investment and public consumption for six industrialized economies. They concluded that public investment tends to exert positive effects on GDP, and that there is no evidence of crowding-out effects.
Pereira and Andraz (2005) used data for Portugal between 1976 and 1998 and using a VAR-model considering private-sector output, employment and investment and public investment. Empirical results at the aggregate level indicate that public investment positively affects private investment, employment and output.
9
3. Econometric Methodology
3.1 VAR specification
A four variable VAR model was estimated. The variables included in the VAR are the logarithmic growth rates of real Public Private Partnerships investment (IPPP), real public investment (IPub), real private investment (IPriv) and real output (Y).The list of concessions used to calculate the PPP investment can be seen in Table 2. Public investment was calculated by the difference between the Gross Fixed Capital Formation series (GFCF) from Public Administration and the investment from reclassified PPP as belonging to Public Administration. In what concerns to private investment it results from the difference between the GFCF made by the private sector and the investment from the non-reclassified PPP.
The VAR model can be presented as:
𝑋𝑡= 𝑐 + ∑𝑝𝑖=1𝐴𝑖𝑋𝑡−1+ 𝜀𝑡 (1)
where 𝑋𝑡 denotes the (4x1) vector of four endogenous variables given by 𝑋𝑡 =
[∆𝑙𝑜𝑔𝐼𝑃𝑃𝑃𝑡 ∆𝑙𝑜𝑔𝐼𝑃𝑢𝑏𝑡 ∆𝑙𝑜𝑔𝐼𝑃𝑟𝑖𝑣𝑡 ∆𝑙𝑜𝑔𝑌𝑡 ], c is a (4x1) vector of intercept terms de,
A is the matrix of autoregressive coefficients of order (4x4), and 𝜀𝑡 =
[𝜀𝑡𝐼𝑝𝑝𝑝 𝜀𝑡𝐼𝑝𝑢𝑏 𝜀𝑡𝐼𝑝𝑟𝑖𝑣 𝜀𝑡𝑌] is a vector of random disturbances that contains the reduced
form OLS residuals.
It is possible to identify orthogonal shocks, 𝜂, for each variable in (1), by imposing a set of restrictions, and to compute these orthogonal innovations via the random disturbances:
𝜂𝑡 = 𝐵𝜀𝑡 (2)
The estimation of (1) allows the determination of 𝐶𝑜𝑣(𝜀). Therefore, with orthogonal restrictions and by means of an adequate normalization we have 𝐶𝑜𝑣(𝜂) = 𝐼, where 𝐼 =
(4𝑋4) identity matrix , and we can write:
𝐶𝑜𝑣(𝜂𝑡) = 𝐶𝑜𝑣(𝐵𝜀𝑡) = 𝐵𝐶𝑜𝑣(𝜀𝑡)𝐵′ (3)
𝐼 = 𝐵𝐶𝑜𝑣(𝜀𝑡)𝐵′ (4)
10
which requires all elements above the principal diagonal to be zero, provides the necessary additional six restrictions, an the system is then exactly identified.
It can be imposed a lower triangular structure to 𝐵−1,
𝐵−1= 𝐷 = [
𝑑11 0 0 0
𝑑21 𝑑22 0 0
𝑑31 𝑑32 𝑑33 0
𝑑41 𝑑42 𝑑43 𝑑44
] (5)
which makes possible to write the residuals 𝜀𝑡 as a function of the orthogonal shocks in each of the variables:
𝜀𝑡 = 𝐷𝜂𝑡
The variables in the VAR were ordered from what is theoretically considered the most exogenous variable to the least exogenous one, with PPP investment ordered first, followed by public investment, private investment and output. Being so, a shock in PPP investment may have an instantaneous effect on all the other variables. However, PPP investment does not respond contemporaneously to structural disturbances in the other variables. A shock in public investment, the second variable, does not have an instantaneous impact on PPP investment, only on private investment and output. In fact, this ordering implies that private investment responds to PPP and public investment in a contemporaneous way, but not to shocks to the other variables. Indeed, one can recall that governments typically announce their spending and investment plans in advance. Therefore, economic agents can incorporate this information in their decisions.
3.2 Macroeconomic rates of return
Six different rates of return were computed based on the results from impulse response functions:
the partial rate of return of investment in PPP;
the partial rate of return of public investment;
the partial rate of return of private investment;
11 the rate of return of total investment originated by an impulse to public
investment;
the rate of return of total investment originated by an impulse to private investment;
The partial rate of return of investment in PPP is computed as in Pereira (2000). Following an orthogonal impulse to investment in PPP the long-run accumulated elasticity of Y with respect to investment in PPP, IPPP, was computed deriving from the accumulated impulse response functions of the VAR:
𝜀𝐼𝑃𝑃𝑃 =∆𝑙𝑜𝑔 𝐼𝑃𝑃𝑃∆𝑙𝑜𝑔𝑌
This long-run elasticity is the ratio between the accumulated change in the growth rate of output and the accumulated change in the growth rate of PPP investment.
It is known that:
∆𝑌
∆𝐼𝑃𝑃𝑃 = 𝜀𝐼𝑃𝑃𝑃 𝑌̅ 𝐼𝑃𝑃𝑃 ̅̅̅̅̅̅̅
Being so, the partial rate of return of investment in PPP is obtained by solving:
(1 + 𝑟)20 = ∆𝑌
∆𝐼𝑃𝑃𝑃
Note that it is not possible to decompose the variation of the product that is due separately to a change in investment in PPP and the consequent change in public investment and / or private investment. Thus, the isolated reading of the partial rate of return can bias the analysis of the total impact in the product of a variation of investment in PPP. We used 20 years to compute both rates of return as we assumed an average life of 20 years for a capital good.
The partial rates of return of public and private investment were computed using the same technology mention above.
12
(1 + 𝑟)20= ∆𝑌
∆𝐼𝑃𝑃𝑃 + ∆𝐼𝑃𝑢𝑏 + ∆𝐼𝑃𝑟𝑖𝑣
= 1
(𝜀𝐼𝑃𝑃𝑃𝐼𝑃𝑃𝑃)𝑌 −1
+ (𝜀𝐼𝑃𝑢𝑏𝐼𝑃𝑢𝑏)𝑌 −1
+ (𝜀𝐼𝑃𝑟𝑖𝑣𝐼𝑃𝑟𝑖𝑣)𝑌 −1
That is, following a shock in investment in PPP both the direct impact of this shock and the indirect impact through changes taking place in public and private investment that result of this shock in PPP investment, are taken into account.
The rate of return of total investment originated by an impulse to public and private and investment were computed using the same technology mention above.
3.3 Crowding-in and crowding-out effects
The marginal effects of PPP investment on public investment and on private investment were derived, respectively, from:
∆𝐼𝑝𝑢𝑏 ∆𝐼𝑃𝑃𝑃 =
𝜀𝐼𝑃𝑃𝑃
𝜀𝐼𝑝𝑢𝑏
𝐼𝑝𝑢𝑏 ̅̅̅̅̅̅ 𝐼𝑃𝑃𝑃 ̅̅̅̅̅̅̅
and
∆𝐼𝑝𝑟𝑖𝑣 ∆𝐼𝑃𝑃𝑃 =
𝜀𝐼𝑃𝑃𝑃
𝜀𝐼𝑝𝑟𝑖𝑣
𝐼𝑝𝑟𝑖𝑣 ̅̅̅̅̅̅̅ 𝐼𝑃𝑃𝑃 ̅̅̅̅̅̅̅
13
4.Empirical Results
4.1 Data
Annual data was used from 1998 to 2013 for the Portuguese economy. All variables are presented at constant prices. GDP was transformed into real values using the price deflator of GDP. The price deflator of the general government gross fixed capital formation was used to transform both the investment in PPP and the public investment into real values, and the price deflator of the gross fixed capital formation of the private sector to transform private investment. The data sources for the investment in PPP are UTAP, Brisa and INE.
4.2 VAR estimation
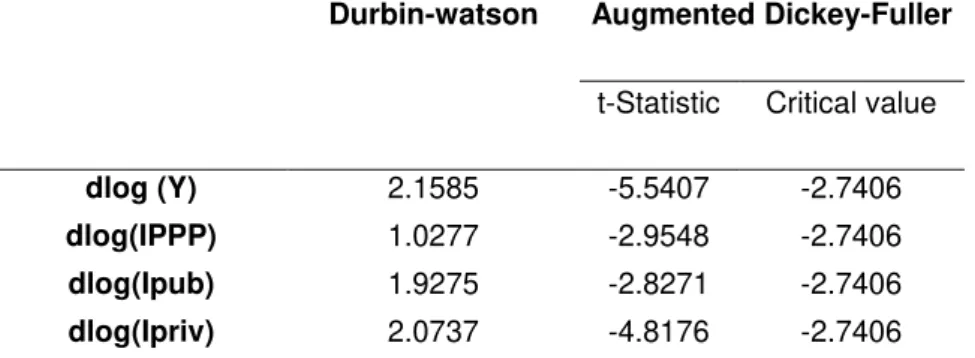
All variables used in the VAR are in logarithmic growth rates and in first differences of the original values. The unit root analysis showed that these first differenced variables are stationary, I(0) time series. See table 3 for unit root test statistics.
The Akaike and the Schwartz information criteria were used to select the VAR order used in the estimation. Taking into account the length of the data used in the VAR and those tests, a parsimonious model with only one lag were choose to avoid the use of too many degrees of freedom. The null hypothesis of normality of the VAR residuals was not rejected. The diagnostic tests for normality are presented in table 4. For a p-value of 5% the null hypothesis of no serial correlation of the residuals cannot be rejected as can be seen in table 4.
4.3 Rates of return
The information on accumulated responses of all VAR variables to a shock in investment in PPP and in public and private investment is presented in table 5. A 95 percent confidence band around estimates is also included and the figures in bold represent the cases where those confidence bands include positive or negative values only. The conclusion is that impulses in investment in PPP have no statistically significant effects on the other variables, at 95 percent level. On the other hand, impulses to private and public investment have a positive and significant impact on output.
14
positive output elasticity, with the output elasticity of private investment (0.3998) being higher than the output elasticity of public investment (0.1743) and investment in PPP (0.0026).
Both public and private investments present a positive partial and total rate of return, being the total rate of return of public investment (0.0491) superior to the total rate of return of private investment (0.0332). In the case of the investment in PPP this rate of return cannot be calculated once its partial rate of return is negative.
4.4 Crowding-in and crowding-out effects
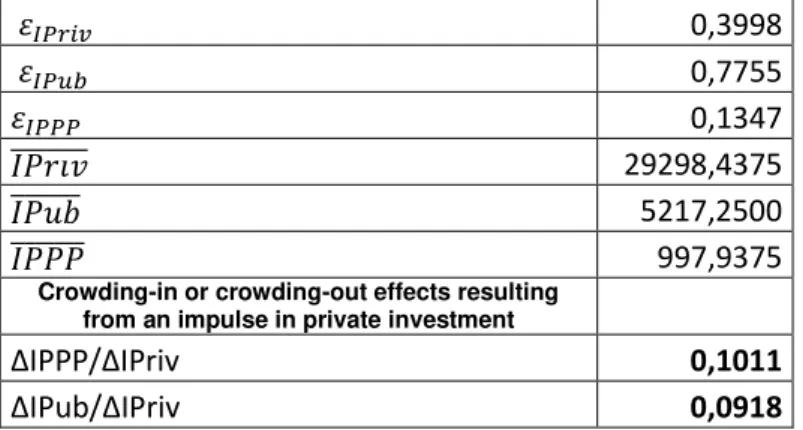
The results for the crowding-in and crowding-out effects for the investment in PPP, public and private investment are presented in table 9, 10 and 11 respectively. Investment in PPP presents a crowding-out effect both in public and private investment, being the magnitude of the crowding-out effect on private investment (-2.1166) higher than in public investment (-0.4005). On the other hand, public investment crowds-in both in private investment and investment in PPP, showing a higher impact in private (0.9317) than in investment in PPP (0.3425). Finally, private investment presents also a crowding-in effect in both investment in PPP and public investment, with the impact in the investment in PPP(0.1011) being slightly higher than in public investment (0.0918).
5.Conclusions
Investment in PPP leads to a crowding-out effect both in private and public investment and has a negative impact on GDP. In fact, the partial rate of return of an investment in PPP is negative and the total rate of return associated with investment in PPP cannot be calculated since the accumulated gross growth rate in twenty years is negative.
15
Finally, private investment crowds-in both in investment in PPP and in public investment. The output elasticity of private investment is positive. The partial rate of return of private investment is higher than its total rate of return taking into account that the response of both public investment and investment in PPP to a shock in public investment is positive.
The results that point to the existence of crowding-out in private and public investment in consequence of investment in PPP, together with a negative partial rate of return of PPPs are evidence that investment in PPP in Portugal, which involved almost exclusively the construction and operation of road infrastructures, is not the most efficient method of financing this kind of investment and / or have facilitated the expansion of road infrastructures beyond the social optimum. In fact, the investment through PPPs does not appear to be the kind of investment leading to the higher productivity that the Portuguese economy needs for a sustained increase in its export capacity and to allow for the correction of the accumulated external imbalances. Empirical results do also support the idea that this kind of investment should have undermined the capacity of private agents and the public sector to carry on their investment activities.
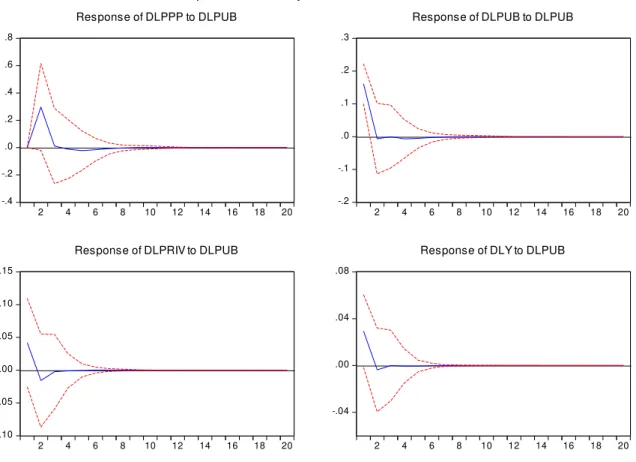
These conclusions are obviously conditioned to the information used, to the analyzed concessions and to the size of the sample used, time period and frequency. In fact, to estimate this VAR model only 16 annual observations (1998-2013) are available. Using one constant, four variables and one lag it implies estimating 5 parameters with only 14 observations. This means less than 3 observations per parameter. This number of observations is relatively small in order to conclusions to be drawn from the model with a high level of robustness. This small number of observations is also reflected on the impulse response functions shown in Figures 2, 3 and 4. In much cases the impulse response functions are statistically not different from zero.
16
REFERENCES
Afonso, A. and St.Aubyn, M. (2009), “Macroeconomics Rates of Return of Public and
Private Investment: Crowding-in and Crowding-out Effects”, Manchester School, Supplement , pages 21-39.
Aschauer, D. (1989a), “Is Public Expenditure Productive?”, Journal of Monetary Economics 23 (2), 177-200.
Aschauer, D. (1989b), “Does public capital crowd out private capital?”, Journal of Monetary Economics 24 (2), 171-188.
Argy, F., Lindfield, M., Stimson, B. and Hollingswoth, P. (1999), Infrastructure and Economic Development. In “CEDA Information Paper Number 60”. Committee for
Economic Development of Australia, Melborne.
Bettignies, J. and Ross, T. (2004), “The Economics of Public-Private Partnerships”,
Canadian Public Policy, pages135-154.
Bloomfield, P., Westerling, D. and Carey, R. (1998), “Innovation and Risks in a Public
-Private Partnership: Financing and Construction of a Capital Project in Massachusetts”.
Public Productivity and Review 21460-471.
Bovaird, Tony (2010), “A brief intellectual history of the public-private partnership
movement”, in Hodge, Graeme, Greve, Carsten & Boardman, Anthony. Eds. 2010. International Handbook on Public-Private Partnerships.
Broadbent, J. and Laughlin, R. (1999), “The Private Finance Initiative: Clarification of a
Future Research Agenda”, Financial Accountability and Management, Issue 2, pages 95-114.
Costa, J. and Providência, P. (2004), "Projecto de Investigação e Desenvolvimento: Parcerias Público-Privadas PPP- Relatório Final. FEUP, Porto.
17 Flinders, M. (2005), “The Politics of Public-Private Partnerships”, British Journal of Political and International Relations, Issue 2, pages 215-239.
Freitas, C. (2008), “Análise de Risco e Definição de Critérios de Avaliação e Monitorização em Empreendimentos do Tipo PPP (Public-Private Partnerships)”, FEUP, Porto.
Hammami, M., Ruhashyankiko, J.F. and Yehoue, E.B. (2006), “Determinants of
Public-Private Partnerships in Infrastructure,” Working Paper No 06/99, International Monetary Fund.
Hammerschmid,G. (2007), “Legitimizing the Failure of a Public-Private Partnership Project – Media accounts in the twilight zone of public and private sector logic” Paper for the 23nd EGOS colloquium,Vienna July 5-7 2007.
Hodge, G. and Greve, C.(2008), “The PPP Debate: Taking Stock of the Issues and Renewing the Research Agenda”, Paper presented at the International Research Society for Public Management Annual Conference.
Hodge, G. (2002), “Who Steers the State When Governments Sign Public-Private
Partnerships?”,The Journal of Contemporary Issues in Business and Government 8.
Iossa, E. and Martimort, D. (2008), “The Simple Micro-Economics of Public-Private
Partnerships”, CEIS SSRN Working Paper No.139.
Kappeler, A. and Nemoz, M. (2010), “Public-Private Partnerships in Europe- before and
during the recente financial crisis”, European Investment Bank. p. 7.
Martins, P. (2010), “Cronyism”, IZA DP No. 5349.
Mittnik, S., Neumann, T. (2001). ”Dynamic effects of public investment:Vector autoregression evidence from six industrialized countries.” Empirical Economics 26, 429-446.
Monbiot, G. (2002), “Health - A Challenge to the Chancellor: Refute these charges, or
18 Mott Macdonald (2002), “Review of Large Public Procurement in the UK. London” , HM Treasury.
Mota,H. (2008), “Parcerias Publico Privadas: Teoria e Evidência do Sector da Saúde em
Portugal, Tese de Mestrado em Contabilidade e Auditoria, Universidade de Aveiro.
National Audit Office (2003), ”PFI: Construction Performance”, HC 371. London: The Stationery Office.
Pereira, A. (2000) “Is All Public Capital Created Equal?” Review of Economics and Statistics 82 (3), 513-518.
Pereira, A. and Andraz, J. (2006), “Public Investment in Transportation Infrastructures
and Industry Performance in Portugal”, College of William and Mary, Working Paper N.45
Pollitt, M. (2002), “The Declining Role of the State in Infrastructure Investment in the UK”,
in Sanford V. Berg, Michael G. Pollitt and Masatsuga Tsuji (eds), Private Initiatives in Infrastructure: Priorities, Incentives and Performance, Aldershot, England: Edward Elgar.
Pollitt, M. (2005),” Learning from the UK Private Financing Initiative Experience”, in Graeme Hodge and Carsten Greve The Challenge of Public-Private Partnerships: Learning from International Experience. Cheltenham, England: Edward Elgar, 207-230.
Pollock, A., Shaoul, J. and Vickers, N. (2002), “Private Finance and Value for Money in NHS Hospitals: A Policy in Search of a Rationale?”. British Medical Journal 324: 1205-1208.
St.Aubyn, M. and Pina, A. (2004), “Comparing Macroeconomic Returns on Human and Public Capital: an Empirical Analysis of the Portuguese Case (1960-2001)” Journal of Policy Modelling 27, pages 585-598.
Terry, F. (1996) “The Private Financing Initiative – Overdue Reform or Policy
Breaktrough?”, Public Money and Management, Issue 1.
Van Ham, H. and Koppenjan, J. (2001), “Building Public-Private Partnerships. Assessing
19 Voss, G. (2002), “Public and private investment in the United States and Canada.”
Economic Modelling 19, 641-664.
Walker, B. and Walker, B.C. (2000), “Privatisation: Sell Off or Sell Out? The Australian Experience.” Sydney: ABC Books.
20
6.Appendix
Table 1. Total amount of investment in PPP between 1990-2009 in percentage of the 2009 GDP of each country
PT 10.55% UK 8.38% HU 6.39% EL 6.05% CY 4.52% ES 2.77% IE 2.5% SK 2.02% PL 1.39% BE 0.97% NL 0.8% BG 0.73% FR 0.71% IT 0.55% CZ 0.54% AT 0.46% DE 0.44% FI 0.29% SE 0.17%
DK 0%
LV 0%
MA 0%
RO 0%
SI 0%
21 Tabel 2. List of concessions used to calculate the PPP investment
Concession Road sector Concessão Lusoponte
Concessão Norte
Concessão Oeste
Concessão Brisa
Concessão Litoral Centro
Concessão Beira Interior
Concessão Costa de Prata
Concessão Algarve
Concessão Interior Norte
Concessão Beiras Litoral e Alta
Concessão Norte Litoral
Concessão Grande Porto
Concessão Douro Litoral
Concessão Grande Lisboa
Concessão Túnel do Marão
Subconcessão Transmontana
Subconcessão Douro Interior
Subconcessão Baixo Alentejo
Subconcessão Baixo Tejo
Subconcessão Litoral Oeste
Subconcessão Algarve Litoral
Subconcessão Pinhal Interior
Healthcare sector H. Braga - Gestão do Estabelecimento
H. Braga - Gestão do Edifício
H. Cascais - Gestão do Estabelecimento
H. Cascais - Gestão do Edifício
H. Loures - Gestão do Estabelecimento
H. Loures - Gestão do Edifício
H. V Franca - Gestão do Estabelecimento
H. V Franca - Gestão do Edifício
Rail sector Metro Sul Tejo
Fertagus
22 Table 3. Autocorrelation test: Durbin-Watson and Unit root tests, variables in first diferences: Augmented
Dickey-Fuller
Durbin-watson Augmented Dickey-Fuller
t-Statistic Critical value
dlog (Y) 2.1585 -5.5407 -2.7406
dlog(IPPP) 1.0277 -2.9548 -2.7406
dlog(Ipub) 1.9275 -2.8271 -2.7406
dlog(Ipriv) 2.0737 -4.8176 -2.7406
Note: critical values are for 1% level. No tendency or interception was adopted.
Table 4. Residual normality tests
Component Skewness Chi-sq df Prob.
1 1.222453 3.486915 1 0.0619 2 -0.072623 0.012306 1 0.9117 3 1.074501 2.693956 1 0.1007 4 -0.028190 0.001854 1 0.9657
Joint 6.195031 4 0.1850
Component Kurtosis Chi-sq df Prob.
1 4.036431 0.626610 1 0.4286 2 2.229281 0.346505 1 0.5561 3 4.694197 1.674344 1 0.1957 4 2.001411 0.581688 1 0.4457
Joint 3.229147 4 0.5202
Component Jarque-Bera df Prob.
1 4.113525 2 0.1279
2 0.358811 2 0.8358
3 4.368300 2 0.1126
4 0.583542 2 0.7469
23 Table 5. Accumulated responses to shocks in PPP, public and private investment
Accumulated
responses of Shock to investment in PPP Shock to Public Investment Shock to Private Investment
-2 S.E. CENTRAL +2 S.E -2 S.E. CENTRAL +2 S.E -2 S.E. CENTRAL +2 S.E
IPPP 0,0675 0,3804 0,6933 -0,0318 0,2513 0,5344 -0,1333 0,2914 0,7161
IPub -0,1158 -0,0291 0,0576 0,0627 0,1403 0,2179 -0,0631 0,0507 0,1645
IPriv -0,065 -0,0274 0,0102 -0,0116 0,0233 0,0582 0,0499 0,0982 0,1465
Y -0,0158 0,001 0,0178 0,0092 0,0245 0,0398 0,0182 0,0393 0,0604
Table 6. Partial and total rates of returns originated by an impulse in investment in PPP
Impulse response functions
acumulated results
ΔlogY 0,0010
Δlog Ipriv -0,0274
ΔlogIPub -0,0291
Δlog IPPP 0,3804
𝜀𝐼𝑃𝑟𝑖𝑣 -0,0365
𝜀𝐼𝑃𝑢𝑏 -0,0344
𝜀𝐼𝑃𝑃𝑃 0,0026
𝑌̅/𝐼𝑃𝑟𝑖𝑣̅̅̅̅̅̅̅ 5,5245
𝑌̅/𝐼𝑃𝑢𝑏̅̅̅̅̅̅̅ 33,7169
𝑌̅/𝐼𝑃𝑃𝑃̅̅̅̅̅̅̅ 250,0058
ΔY/ΔIPriv -0,2017
ΔY/ΔIPub -1,1588
ΔY/ΔIPPP 0,6582
∆𝑌
∆𝐼𝑃𝑃𝑃 + ∆𝐼𝑃𝑢𝑏 + ∆𝐼𝑃𝑟𝑖𝑣 -0,2325
Rate of return
Parcial rate of return -0,0207
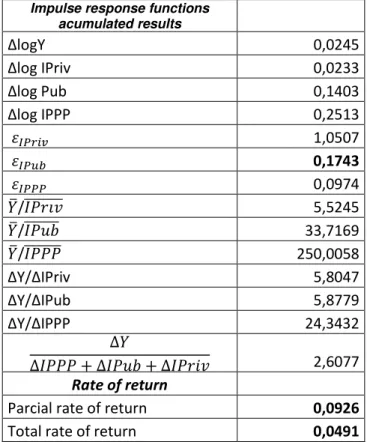
24 Table 7. Partial and total rates of returns originated by an impulse in public investment
Impulse response functions
acumulated results
ΔlogY 0,0245
Δlog IPriv 0,0233
Δlog Pub 0,1403
Δlog IPPP 0,2513
𝜀𝐼𝑃𝑟𝑖𝑣 1,0507
𝜀𝐼𝑃𝑢𝑏 0,1743
𝜀𝐼𝑃𝑃𝑃 0,0974
𝑌̅/𝐼𝑃𝑟𝑖𝑣̅̅̅̅̅̅̅ 5,5245
𝑌̅/𝐼𝑃𝑢𝑏̅̅̅̅̅̅̅ 33,7169
𝑌̅/𝐼𝑃𝑃𝑃̅̅̅̅̅̅̅ 250,0058
ΔY/ΔIPriv 5,8047
ΔY/ΔIPub 5,8779
ΔY/ΔIPPP 24,3432
∆𝑌
∆𝐼𝑃𝑃𝑃 + ∆𝐼𝑃𝑢𝑏 + ∆𝐼𝑃𝑟𝑖𝑣 2,6077
Rate of return
Parcial rate of return 0,0926
Total rate of return 0,0491
Table 8. Partial and total rates of returns originated by an impulse in private investment
Impulse response functions
acumulated results
ΔlogY 0,0393
Δlog IPriv 0,0982
Δlog IPub 0,0506
Δlog IPPP 0,2915
𝜀𝐼𝑃𝑟𝑖𝑣 0,3998
𝜀𝐼𝑃𝑢𝑏 0,7755
𝜀𝐼𝑃𝑃𝑃 0,1347
𝑌̅/𝐼𝑃𝑟𝑖𝑣̅̅̅̅̅̅̅ 5,5245
𝑌̅/𝐼𝑃𝑢𝑏̅̅̅̅̅̅̅ 33,7169
𝑌̅/𝐼𝑃𝑃𝑃̅̅̅̅̅̅̅ 250,0058
ΔY/ΔIPriv 2,2089
ΔY/ΔIPub 26,1464
ΔY/ΔIPPP 33,6843
∆𝑌
∆𝐼𝑃𝑃𝑃 + ∆𝐼𝑃𝑢𝑏 + ∆𝐼𝑃𝑟𝑖𝑣 1,9207
Rate of return
Parcial rate of return 0,0404
25 Table 9. Crowding-in or crowding-out effects resulting from an impulse in the investment in PPP
εIPriv -0,0365
εIPub -0,0344
εIPPP 0,0026
Ipriv 29298,4375
Ipub 5217,2500
Ippp 997,9375
Crowding-in or crowding-out effects resulting from an
impulse in the investment in PPP
ΔIpriv/ΔIPPP -2,1166
ΔIpub/ΔIPPP -0,4005
Table 10. Crowding-in or crowding-out effects resulting from an impulse in public investment
𝜀𝐼𝑃𝑟𝑖𝑣 1,0507
𝜀𝐼𝑃𝑢𝑏 0,1743
𝜀𝐼𝑃𝑃𝑃 0,0974
𝐼𝑃𝑟𝑖𝑣
̅̅̅̅̅̅̅ 29298,4375
𝐼𝑃𝑢𝑏
̅̅̅̅̅̅̅ 5217,2500
𝐼𝑃𝑃𝑃
̅̅̅̅̅̅̅ 997,9375
Crowding-in or crowding-out effects resulting
from an impulse in public investment
ΔIpriv/ΔIpub 0,9317
ΔIppp/ΔIPub 0,3425
Table 11. Crowding-in or crowding-out effects resulting from an impulse in private investment
𝜀𝐼𝑃𝑟𝑖𝑣 0,3998
𝜀𝐼𝑃𝑢𝑏 0,7755
𝜀𝐼𝑃𝑃𝑃 0,1347
𝐼𝑃𝑟𝑖𝑣
̅̅̅̅̅̅̅ 29298,4375
𝐼𝑃𝑢𝑏
̅̅̅̅̅̅̅ 5217,2500
𝐼𝑃𝑃𝑃
̅̅̅̅̅̅̅ 997,9375
Crowding-in or crowding-out effects resulting
from an impulse in private investment
ΔIPPP/ΔIPriv 0,1011
26
Figure 1. Countries’ percentage shares of value of projects of European PPPs, 1990-2009 agregate
Source:Kappeler and Nemoz (2010)
Figure 2. Responses to shocks in PPP investment
-.4 -.2 .0 .2 .4 .6 .8
2 4 6 8 10 12 14 16 18 20
Response of DLPPP to DLPPP
-.16 -.12 -.08 -.04 .00 .04 .08 .12 .16
2 4 6 8 10 12 14 16 18 20
Response of DLPUB to DLPPP
-.12 -.08 -.04 .00 .04 .08
2 4 6 8 10 12 14 16 18 20
Response of DLPRIV to DLPPP
-.06 -.04 -.02 .00 .02 .04 .06
2 4 6 8 10 12 14 16 18 20
Response of DLY to DLPPP
Response to Cholesky One S.D. Innovations ± 2 S.E.
0 10 20 30 40 50 60
UK ES PT EL FR DE IT HU NL PL IE BE AT SK CY CZ FI SE BG DK LV MA RO SI Countries’ percentage shares of value of projects of European PPPs,
27
Figure 3. Responses to shocks in public investment
-.4 -.2 .0 .2 .4 .6 .8
2 4 6 8 10 12 14 16 18 20
Response of DLPPP to DLPUB
-.2 -.1 .0 .1 .2 .3
2 4 6 8 10 12 14 16 18 20
Response of DLPUB to DLPUB
-.10 -.05 .00 .05 .10 .15
2 4 6 8 10 12 14 16 18 20
Response of DLPRIV to DLPUB
-.04 .00 .04 .08
2 4 6 8 10 12 14 16 18 20
Response of DLY to DLPUB
Response to Cholesky One S.D. Innovations ± 2 S.E.
Figure 4. Responses to shocks in private investment
-.4 -.2 .0 .2 .4 .6
2 4 6 8 10 12 14 16 18 20
Response of DLPPP to DLPRIV
-.2 -.1 .0 .1 .2
2 4 6 8 10 12 14 16 18 20
Response of DLPUB to DLPRIV
-.2 -.1 .0 .1 .2
2 4 6 8 10 12 14 16 18 20
Response of DLPRIV to DLPRIV
-.08 -.04 .00 .04 .08
2 4 6 8 10 12 14 16 18 20
Response of DLY to DLPRIV