Frutuoso G. M. Silva1,2, Vasco Lopes2, Jos´e Ribeiro2, and Fernando M. L.
Martins2,3
1 University of Beira Interior, Portugal
2 Instituto de Telecomunica¸c˜oes, Delega¸c˜ao da Covilh˜a, Portugal
{vascoferrinholopes, jsousarib}@gmail.com
3 Instituto Polit´ecnico de Coimbra, Escola Superior de Educa¸c˜ao Coimbra, Portugal
Abstract. Team sports analysis can be done using network analysis tools if the interactions between teammates are recorded. However, no application was specifically developed to team sports, that allows to im-port, compute and export data, as far as we know. Based on that, we developed a new application for network analysis in team sports. The Ul-timate Performance Analysis Tool (uPATO) allows codifying, importing, visualising, computing measures and exporting data from the observed games. Thus, the user can use a single application to codify the network that emerges from the game and analyse it. In this paper, we will present the mobile application uPATO that allows using an Android device to codify and analyse networks in team sports. This application extends the use of the uPATO tool for outdoor environments, making easier their use in the real scenarios with a mobile device, for example, in official games or during the training sessions. Finally, data of a real game will be used to test the network measures implemented and to show the values that can be obtained.
Keywords: uPATO · Mobile Application · Network Analysis · Team Sports.
1
Introduction
Network analysis tools are used in a wide range of situations, for example for the study of the structure and dynamics of an infrastructure or a social network [12, 16]. For example, social networks are everywhere and they can be formed of anything like classmates in school, sports teams, membership in social network, a site, etc. Thus, network analysis tools are more and more used to analyse the influence and interdependence of each element in the network, where the elements are considered nodes of the network and its relations or connections the edges that connect the nodes.
In team sports the use of network analysis tools can be used considering the network of the passes between players during a game, with the aim to understand how the collective and individual performance may be optimised [5, 13, 1, 14].
According to the authors, igraph was created in order to efficiently process large graphs, be embedded into high level programming languages. It is open source and it can be programmed in R, Python, C, and C++. Some of the functionalities provided in igraph include graph generation, centrality measures, path length based algorithms, among others [8].
Gephiis a network exploration tool, which allows users to visualize networks as graphs, using layout algorithms. Its main functionalities include data filtering, clustering, adding annotations, and calculating statistics [6]. It allows users to interact with the representation, manipulate the structures, shapes, and colours to reveal hidden patterns.
Pajek is a package for both analysing and visualising networks, including large networks. It provides functionalities for extracting subnetworks, clustering, calculating statistics, and many others [15].
SocNetV is an open source tool designed for the analysis and visualisation of networks. It provides functionalities for the calculation of standard graph theory and network cohesion metrics, clustering algorithms, and others. The visualisation provides di↵erent options of layout for the representation of the networks [4].
NetworKitaim to provide tools for the analysis of large networks that can range from thousands to billions of edges. For this purpose, it implements efficient graph algorithms many of them in parallel using multi-core architectures [10].
Graph-tool is an efficient Python module for manipulation and statistical analysis of networks, which provides excellent performance on multi-core ar-chitectures. Besides, it is a powerful visualisation tool with a great variety of algorithms for graph representation [7].
Some of the tools described above are not capable of analysing weighted networks or do not produce the expected results. Those that are capable of analysing weighted networks, they are very limited in the terms of metrics avail-able or simply ignore the weight of the edges. However, no dedicated application was specifically developed to create, compute and analyse data in the specific case of team sports, as far as we know. Thus, we introduce a network analysis tool oriented for team sports, called uPATO [9], which enables the creation of adjacency matrices and compute several metrics over the network.
In team sports, the networks are usually represented as weighted directed networks in order to preserve the information regarding the frequency and im-portance of interactions between players. Thus, each node is a player and its edges contain the frequency of interactions between players, which is fundamen-tal in the study of how well the team works.
uPATO was developed with this necessity in mind, providing a tool capable of calculating metrics for all types of networks (unweighted graphs, weighted graphs, unweighted digraphs, and weighted digraphs) and also calculating met-rics for GPS data, making it a singular tool in the area. Besides, it supports a wide range of metrics, namely individual and collective metrics (i.e., subgroup metrics and team metrics) which normally they are not all available in other tools. Note that some case studies were realised with our tool with good results, see [2, 14].
In addition, it allows processing also geolocation data provided by GPS de-vices, which means that supports non-linear analysis [17]. Currently, some of the teams have GPS devices to evaluate the performance of their players. Thus, some metrics were implemented for this kind of data making this tool a specialised tool for team sports analysis using an adjacency matrix for network analysis or GPS data for non-linear analysis. But only the network module of the mobile application uPATO will be presented in this paper.
The paper is organised as follows: section II presents the main functionalities of our network analysis tool. Section III presents a case study using data from a real game. Finally, section IV presents some conclusions based on the data produced in previous sections.
2
Mobile application uPATO
uPATO tool is available through a web client4 and a mobile client for Android
devices. Here we introduce the mobile client and its main characteristics. To use the uPATO tool the user must register first. It requires that the user defines a name, username, email, and password. Also, the user must confirm that cites the uPATO tool if include any material produced with the tool in their publications. After that, the user can log in into the application to use it. The login window has the option keep me logged-in, which the user must select to maintain their connection with the server, otherwise, their session expires after 10 minutes. The user has also the possibility to edit the details of his account or even remove it. After login, the user has two modules available to use, the Network module and GPS module. Due to the space restrictions, we will describe here only the network module.
2.1 Network module
The network module allows the user to create a network, represent it, calculating metrics over the network and visualize the results, as shown in Figure 1. Besides, he has also the possibility to go for the help, settings or do log out of the application (see these options in the top right corner of Figure 1).
Figure 1. Options available for Network module.
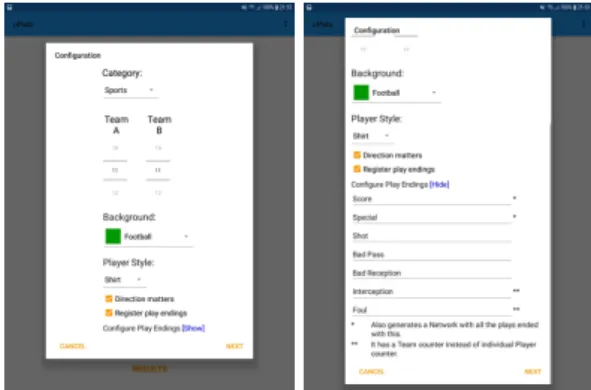
Create network - The creation network option allows the user to codify a network, for example, a general network or a network based on a sequence of passes between teammates in the case of team sports (i.e., an adjacency matrix). In the first case, the user must select only the number of nodes and the type of network (i.e., directed or undirected). But in the second case, the user can specify the number of players for both teams (i.e., if he want codify a network for each team), the background of the field (i.e. for football, basketball, etc.), the player style (i.e., a shirt or a simple square), if direction matters and if play endings will be registered or not (see Figure 2). Besides, the user has the option to import an existing file with an adjacency matrix to create their network.
The play endings options can be partially configured by the user, which give it the option to choose what types of situations he wants to register for their network. For example, in Figure 2 the play endings situations are adjusted for the football. But, they can be adjusted for other sports if needed.
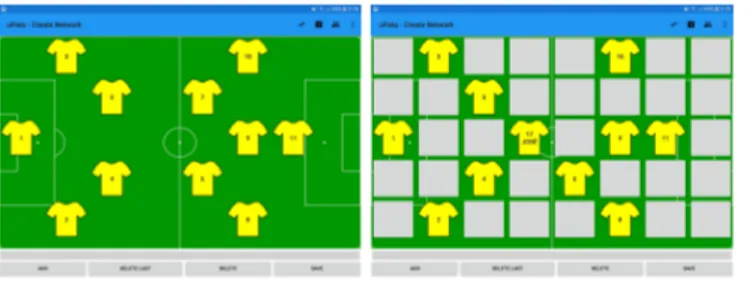
If the user wants to create a network for football, after configuring it, as shown in Figure 2, it is presented the layout of the team over the field, as shows the
Figure 3. The screen to codify the network of passes and to change the positions of the players in the field.
Figure 3-left. By default, the players have the numbers between 1 and n, where nis the number of players chosen, but the user can also specify the numbers and names of the players, as well as, adjust the positions of the players in the field as shows the figure 3-right. Finally, he can change from team A to team B and also change the positioning of the team in the field (i.e., playing from right to left or left to right, because of the field change in the second part of the game). These three options are available in the top right corner of the window (see Figure 3). To codify a network, in the case of football, the user must select the player that does the passe and the player that receives it (i.e., clicks on the two players). Thus, the user can compose a sequence of passes between players. To add this sequence of passes to the network he must click on the add button that is in the left bottom of the window (see Figure 3). But, if the user selected to register the play endings conditions, then he must select also which is the situation that ends the sequence, as we can see in the Figure 4-left.
In Figure 4-left are available all the situations configured to register the play endings conditions (i.e., how each sequence ended). In the bottom of Figure 3 we can see other buttons that allow that the user edits the sequence of passes, for example, remove the last pass (i.e., Delete Last button) or delete all the sequence (i.e., Delete button). The save button allow saving the current con-figuration of the network to a file at any time (see Figure 4-right). This option
Figure 4. The screen with play endings conditions for a sequence and to save a partial network to a file.
Figure 5. Graphical representation of a network.
is important, for example, if the user wants to analyse di↵erent parts of a game, so he needs to save the network for these di↵erent parts separately.
Note that the creation of a network can be done in real time, i.e. during a match or training session, or can be done o✏ine based on a video of the match. But to do it online is recommended a team of two people, one to visualize and dictate the passes and the other to register in the application.
The other way to create a network is importing it from a file with the several sequences of passes. In this case, the user only has to select the file, specify the number of nodes (i.e., players) and define if the direction matters or not and the system generates a network in uPATO format that the user can download. Note that, the file to import must have the following format: one sequence of passes per line, where a sequence of passes is defined by a sequence of numbers separated by a semicolon (e.g., 1;2;5;9).
Representation - After creating a network it is possible to visualize it. This is the second option of the network module as shown in the Figure 1. Thus, the user can load a network created previously by selecting the correspondent file to visualise a representation of the network, as shows Figure 5. The size of each node is proportional to the number of interaction/passes made or received by each player (i.e., each player is a node of the network). Besides, the color of the edges between nodes varies according to the number of interactions between the nodes (i.e., more interactions correspond to a darker color). In the icon of the top right corner of Figure 5 the user can adjust the representation of the graph to: graph-in; graph-out or graph-in-out. The graph-in represents only the passes received by the players, while the graph-out represents only the passes made by the players, and the graph-in-out represents both the passes made and received.
Calculate metrics - With a network created it is possible to calculate several types of metrics under the network, namely individual metrics, sub-group met-rics, and team metrics. See [3] for more details about the metrics applied to team sports analysis.
This is the third option available in the network module (see Figure 1). To calculate metrics over a network, first, the user must select the file with
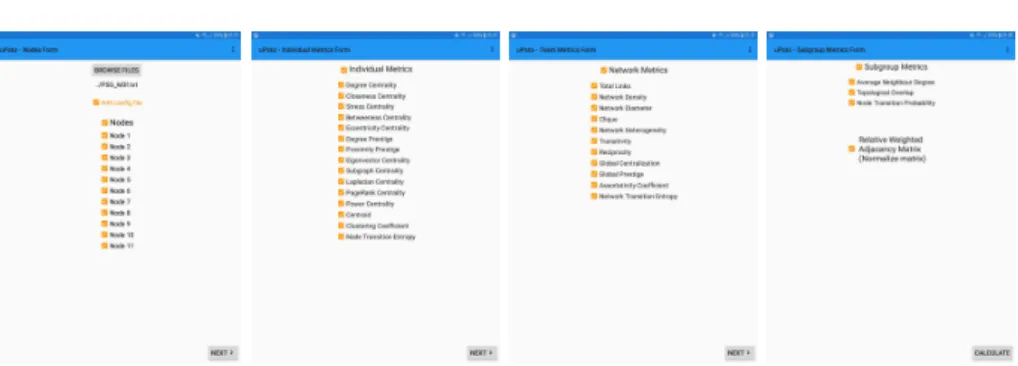
Figure 6. The screen to select the network file and the nodes used in the calculations; the individual metrics; network metrics and sub-group metrics available.
the network and choose which nodes want to evaluate, as shown in Figure 6-left. The remaining pictures of Figure 6 show the individual, network and sub-group metrics available in uPATO. After selecting the desired metrics the user can calculate them by pressing the Calculate button in the bottom of the window (see Figure 6-right). All the calculation are realized from the server side, which after concluded they are sent to the mobile application. This way the mobile device is used only to send and receive information and to present results.
Results - The results are then available in the last option of the network mod-ule menu (i.e., in Results option of the Figure 1). This option shows all the calculation that the user made, as shows Figure 7-right. Thus, he can select one of them and visualise the results in the form of a table, as shown in the Fig-ure 7-left, or in a form of a bar chart as shown in the FigFig-ure 8. In any case, the user also has the option to save the results to a file, this option is available in the icon in the right top corner of the window.
Figure 8. Visualisation of the values of the metrics calculated for four players using bar charts.
3
A case study
To better understand the capabilities of the mobile application uPATO a prac-tical case is used. Thus, a UEFA champion league match of the semi-finals of 2015/2016 was used, i.e. the first leg between Athletic Madrid and Bayer Munich. From now, this match will be designated simple by Athletic and Bayern.
The Athletic team was initially constituted by eleven players, where player 1 correspond to Oblak(13), player 2: Gim´enez(24), player 3: Savic(15), player 4: Juanfran(20), player 5: Filipe Lu´ıs(3), player 6: Fern´andes(12), player 7: Koke(6), player 8: Gabi(14), player 9: Griezmann(7), player 10: Torres(9), and player 11: Sa´ul Nigues(17), while the Bayer team was initially constituted by eleven players, where player 1 correspond to Neuer(1), player 2: Javi Mart´ınez(8), player 3: Alaba(27), player 4: Xabi Alonso(14), player 5: Bernat(18), player 6: Lahm(21), player 7: Thiago Alc´antara(6), player 8: Coman(29), player 9: Vidal(23), player 10: Douglas Costa(11), and player 11: Lewandowski(9).
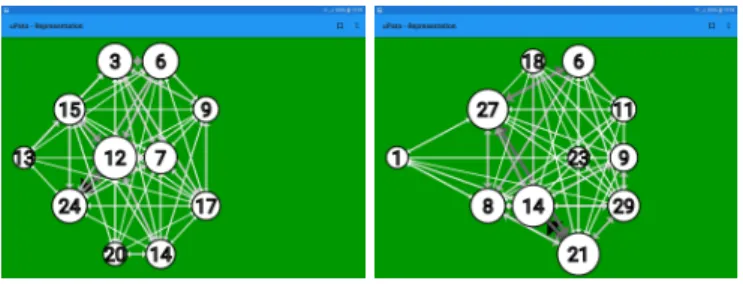
For this match, and for each team, was created a network that codify the passes between teammates during the match. Figure 9 show the graphical repsentation of these networks, where the size of the nodes represent the passes re-alised plus the passes received by players. Thus, this representation show instan-taneously which players are more influence in the team, i.e. the bigger nodes. For example, for Athletic they are the players numbers 12, 6 and 24 (i.e., Fern´andes, Koke and Gimnez), while for Bayern they are the players numbers 21, 14 and 27 (i.e., Lahm, Xabi and Alaba).
We can also observe, from the graphical representation of the networks (see Figure 9), that the Athletic’s shape is more compact while the Bayer’s shape is more attack dominance. Note that these representations are based on the main positions of the players during the game.
The networks allowed us to calculate individual and collective metrics for each team. Table 1 represents the collective metrics for each team. Network Density is low for both teams, which means that the passes are done mostly between the same players, i.e. some of them are not involved in the passes. However, Bayern team involves more players in the match. The value of the Group Closeness Centralization metric is bigger for the Bayern, which suggest that the Bayern have more players responsible for distributing the ball. The value of the Group
Figure 9. The graphical representation of the network for each team, where the nodes have the number of the players. Left - Athletic; Right - Bayern.
Table 1: Collective metrics for both teams.
Athletic Bayern Network Density 0.1305 0.1422 Group Closeness Centralization 4.3919 6.4485 Group Betweenness Centralization 0.2411 0.3455 Global Prestige 5.2078 5.0544
Betweenness Centralization metric is a little greater for Bayern team, but the number of the players that are involved in more moves during a match is almost similar for both teams (see Figure 12). The value of Global Prestige is similar for both teams but greater for the Athletic team. This is the only collective metric where the Athletic team performed better than the Bayern team. Thus, the Athletic team exchanges the ball more between neighbor players, which means that the players involved in each sequence of passes are closer to the ball.
The individual metrics values were normalized by the max value, which means that all values are between zero and one. Figures 10 to 14 show the individual metrics obtained for all players of the two teams. Most individual metrics are Centralities, whose objective is to evaluate how central (or fundamental) a player is.
In the case of Athletic team, we can say that the player 6 (Fern´andes) and player 1 (Oblak) obtained the highest values overall, which suggests that they were the most influential players in the team. In the Bayern team, we can say that the player 6 (Lahm) and player 4 (Xabi Alonso) were the most influential players in the team because they obtained the highest values overall.
Figure 12 show the results obtained for Standardized Betweenness Centrality metric for both teams. For Athletic team, Fern´andes’s value of Standardized Betweenness Centrality is a result of the high number of performed and received passes, to and from many players. In the same way for Xabi Alonso in the Bayern team. This situation can be confirmed also by the network representation (see Figure 9) because it corresponds to bigger nodes in the graphical representation, i.e. the node 12 in the Athletic and node 14 for Bayern team.
Oblak was the player with the highest value of Eccentricity Centrality for the Athletic team, which means that every player has a route to him with a high
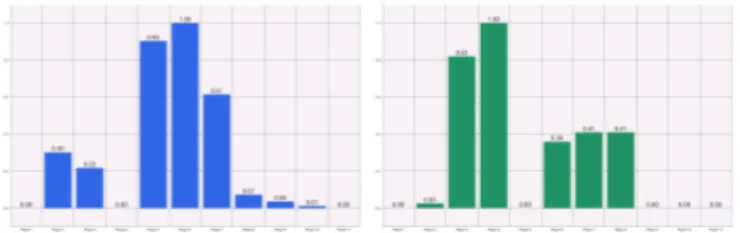
Figure 10. Standard Degree Centralization of players. Left - Athletic; Right - Bayern.
Figure 11. Standard Closeness Centralization of players. Left - Athletic; Right - Bay-ern.
number of interactions. While in the Bayern team were only two players with low values of Eccentricity Centrality, i.e. the goalkeeper (Neuer) and centre-forward (Vidal). This means that Bayern circulated more the ball by all other players.
In both teams, the highest values of the Clustering Coefficient (see Figure 14) include the goalkeeper, a midfielder and a forward player. For Athletic team are the players, Oblak, Juanfrank, and Torres and for Bayern are the players, Neuer, Douglas Costa, and Vidal. High values of Clustering Coefficient result from high weights on the edges between the neighbours of the node of interest, if proportionally high to the number of neighbours. For example, the goalkeepers’ neighbours are mostly defenders, which, usually, interact very much with each other. In the same way, the midfielders interact very much with defenders and forwards, and the forwards interact very much with the midfielders.
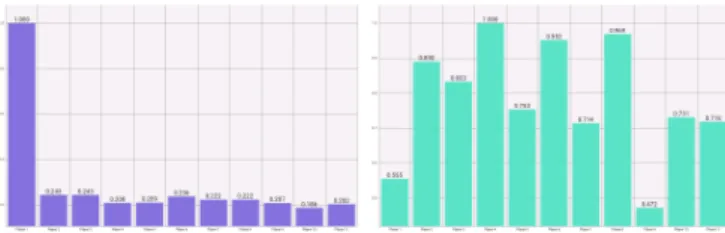
Figure 12. Standard Betweeness Centralization of players. Left Athletic; Right -Bayern.
Figure 13. Standard Eccentricity Centralization of players. Left Athletic; Right -Bayern.
Figure 14. Cluster Coefficient of players. Left - Athletic; Right - Bayern.
4
Conclusions and Future Work
The mobile application uPATO is an important tool to be used in an outdoor scenario, for example during a match or in a training session. It allows the creation of adjacency matrices (i.e., the network), which represent a digraph with the passes between teammates during a match. But it allows creating also several networks that represent the di↵erent instants in a match. Then it is possible to represent graphically the graph/digraph which gives an overview of the nodes most important in the network, i.e. the players more involved in the match. And finally, it is possible to compute several metrics for the network to evaluate the individual and collective performance of the players and the team. Thus, a technical team can easily evaluate the performance of the players and the team in di↵erent periods of the match, as well as for the entire match using a network analysis tool. They can create the network(s), visualize it, and calculate the desired metrics, all of that in an integrated way.
In the future, we want to publish the mobile application uPATO in the Play store to be available to the scientific community. Note that the web version of uPATOapplication is already available at https://upato.it.ubi.pt.
Acknowledgements
This work was funded by FCT/MEC through national funds and when appli-cable co-funded by FEDER-PT2020 partnership agreement under the project UID/EEA/50008/2019.
sports: A case study of FIFA Soccer World Cup 2014. Journal of Sports Engineering and Technology 230(5), 1–31 (2015)
3. Clemente, F. M. and Martins, F. M. L. and Mendes, R. S.: Social Network Analysis Applied to Team Sports Analysis. 1st ed. Springer International Publishing (2016) 4. Kalamaras, D.: SocNetV - Social Network Visualizer, http://socnetv.org. Last
ac-cessed 10 May 2019
5. Gama, J. and Passos, P. and Davids, K. and Relvas, H. and Ribeiro, J. and Vaz, V. and Dias, G.: Network analysis and intra-team activity in attacking phases of professional football. International Journal of Performance Analysis in Sport 14(3), 692–708 (2014)
6. Gephi - Features. https://gephi.org/features/. Last accessed 10 Sept 2018 7. Graph-Tool - Efficient Network Analysis. https://graph-tool.skewed.de. Last
ac-cessed 10 May 2019
8. Igraph - The network analysis package. http://igraph.org/redirect.html. Last ac-cessed 10 May 2019
9. Martins, F. M. L. and Silva, F. and Clemente, F. M. and Gomes, A. J. P. and Correia, A. F. P. P. and Nguyen, Quoc Trong and Sequeiros, J. B. and Ribeiro, J. S. and Lopes, V. F.: Ultimate Performance Analysis Tool (uPATO). Home page: http://uPATO.it.ubi.pt. Last accessed 10 May 2019
10. NetworKit: Large-Scale Network Analysis - Interactive and Fast! https://networkit.iti.kit.edu. Last accessed 10 May 2019
11. Overview - NetworkX 2.3. https://networkx.github.io/documentation/stable/. Last accessed 10 May 2019
12. Newman, M. E. J.: Networks: an introduction. Oxford University Press (2010) 13. Ramos, J. and Lopes, R. J. and Arajo, D.: What’s next in complex networks?
Capturing the concept of attacking play in invasive team sports. Sports medicine 48(1), 17–28 (2018)
14. Silva, Frutuoso G. M. and Gomes, Abel and Nguyen, Quoc and Martins, Fernando and Clemente, Filipe: A new tool for network analysis on team sports the ulti-mate performance analysis tool. 2017 International Conference on Engineering, Technology and Innovation (ICE/ITMC), pp. 439–445. Funchal (2017)
15. Batagelj, V. and Mrvar, A.: Program Package Pajek. http://mrvar.fdv.uni-lj.si/pajek/. Last accessed 10 May 2019
16. Wasserman, S. and Faust, K.: Social network analysis: Methods and applications. New York: Cambridge university press (1994)
17. Stergiou, N.: Nonlinear Analysis for Human Movement Variability. CRC press (2016)