SEGMENTAÇÃO DE ESTUDANTES DO ENSINO SUPERIOR EM TURISMO: UMA EXTENSÃO DO MODELO ECSI
Sofia Eurico
Patrícia Oom do Valle João Albino Silva Catarina Marques
ABSTRACT
This research explores the European Consumer Satisfaction Index model applied to higher education in tourism by accounting for unobserved heterogeneity. In particular, it intends to identify segments of Higher Education Institutions’ consumers based on the structural model estimates of the European Consumer Satisfaction Index, enlarged with the employability construct. A model-based segmentation approach in Partial Least Squares path modelling is used. The European Consumer Satisfaction Index was properly adjusted to the educational framework and has shown its effectiveness when assessing students’ satisfaction regarding the attended Higher Education Institution. Two distinctive, graduates’ segments were identified using a sample of 166 Higher Education Institutions’ consumers. Results confirm the assumption of heterogeneity as the relationships differ across segments and the need for Higher Education Institutions to differently target those segments in such a competitive context. These results may be used strategically by Higher Education Institutions and policy makers as segments of graduates are identified according to their perception of employability and the future influence of this on their satisfaction. Deepening the knowledge on their consumers, Higher Education Institutions will be better prepared to adjust their educational performance to graduates’ best interests and to promote their offer.
Keywords: ECSI, Segmentation, Higher Education, Employability.
RESUMO
Este estudo analisa a heterogeneidade não observada existente no modelo do Índice Europeu de Satisfação do Consumidor (ECSI) aplicado ao ensino superior em turismo. Em particular, pretende identificar segmentos de consumidores de Instituições de Ensino Superior tendo por base as estimativas do modelo estrutural do Índice Europeu de Satisfação do Consumidor. Em termos metodológicos, este trabalho recorre a uma abordagem de segmentação em misturas finitas no contexto da modelação em mínimos quadrados parciais. O modelo ECSI foi devidamente ajustado ao quadro educacional, tendo-lhe sido adicionado o constructo empregabilidade. Dois segmentos distintos foram identificados utilizando uma amostra de 166 consumidores de Instituições de Ensino Superior. Os resultados confirmam o pressuposto de heterogeneidade uma vez que as relações são diferentes em todos os segmentos. Estes resultados podem ser utilizados estrategicamente por Instituições de Ensino Superior e decisores políticos/governamentais, uma vez que os segmentos de graduados são identificados de acordo com a sua percepção da empregabilidade e a influência desta na sua satisfação. Ao aprofundar o conhecimento sobre os seus consumidores, as Instituições do Ensino Superior
estarão melhor preparadas para ajustar o seu desempenho educacional aos interesses dos diplomados e promover a sua oferta.
Palavras chave: ECSI, Segmentação, Ensino Superior, Empregabilidade. JEL Classification: M31; C38
1. INTRODUCTION
Higher Education (HE) has faced different challenges as a reflection of social-economic aspects that characterize societies in distinct times. Nowadays, Higher Education Institutions (HEI) are pressured for an increasing competitiveness that demands high standards of knowledge and quality, internationalization and mobility programs, strategies that distinguish them from the others and focus on attracting new students and offering post-graduation options for those who are already enrolled in the system. In recent years, HEIs have also been strained by some governments’ agenda because of the issue of employability and this dimension has more and more often dictated financial support according to the obtained results (HEFCE, 2001).
As the primary consumers of HEIs (Kanji and Tambi, 1999), students/graduates’ satisfaction and loyalty regarding the HEI attended is undoubtedly determinant for the planning of strategies that will manage to accomplish the previously mentioned demands and simultaneously get graduates’ appraisal of the service provided. The increasing numbers of unemployment rates for graduates may also affect their perception of and satisfaction with the service provided by the HEIs, which can ultimately be reflected on a reduction of the number of potential students enrolling the HE. The issue of employability gains therefore visibility, and helping and teaching individuals to be employable is now in HEIs’ agendas.
The framework for this study is the ECSI (European Consumer Satisfaction Index) model that measures the importance of image, expectations, quality and value as antecedents of satisfaction, and loyalty as its main consequence (ECSI Technical Committee, 1998). Following previous research, the model used in this study adds the influence of the construct employability on key connections of the ECSI model applied to HEIs, so that these institutions may get acquainted with the role of this factor on this particular consumer’s perceptions and, therefore, adjust their educational performance to graduates’ best interest. As the relationship between the antecedents of satisfaction and its impacts on loyalty may change for distinctive groups of individuals, the aim of the current research is to identify graduates’ segments with different patterns in the ECSI model applied to HEIs. Thus, this study intends to deep the understanding of the ECSI model, enlarged with the construct employability, by seeking heterogeneity among its hypothesized relationships. By identifying the segments that account of this heterogeneity, HEIs will have a better understanding of their consumers and, consequently, be more prepared to select the best decisions to target them in such a competitive context.
Tourism graduates have been chosen for this research considering the major importance of the Tourism industry for the economic development of Portugal and the attention that has been given to the qualification of its human resources as a central aspect for its development (MEI, 2007). In this study, the proposed model is estimated and validated
Modeling. Since the ECSI model was not analyzed yet regarding the existence of mutual exclusive homogenous subgroups in terms of its relations, there is not previous information about possible sources of heterogeneity (observed heterogeneity), i.e., about the variables that could be beyond the different segments. Therefore, in order to identify the graduates’ segments, the FInite MIXture Partial Least Squares (FIMIX-PLS) method will be applied (Hahn et al., 2002). This method is particularly adequate for the analysis of unobserved heterogeneity in PLS-PM (Sarstedt, 2008), i.e., to identify segments when there is no prior information about the relevant segmentation variables.
2. INTEGRATING THE CONSTRUCT “EMPLOYABILITY” IN THE ECSI MODEL 2.1 Understanding the employability concept as a key strategy for the positioning of HEIs
The concept of employability is directly linked to “the possession of the understandings, skills and personal attributes necessary to perform adequately in a graduate-level job” (Knight and Yorke, 2010). Employability is therefore related to each ones’ capability to adjust to the professional demands of new labour markets, new job profiles and a different conception of career, which no more considers a job for life but rather the sum up of jobs and positions that characterize your professional path.
Literature review has, in the past few years, evidenced a somewhat increase in the interest for this topic, namely in the educational context, as the importance of preparing employable individuals has became an imperative for HEIs, reinforcing the relevance and purpose of this study. Nowadays, HEIs do struggle both to attract new students and to respond properly to government agendas’ which tend to value this aspect as a response to economies’ dynamics and, in the particular case of Europe, considering the increasing numbers of unemployed graduates (Mestre, 2012). Strategies such as the creation of careers’ services, the development of workshops that aim to enhance employability skills and marketing strategies that are planned to uphold institutions in such a competitive market are just some of the approaches HEIs are promoting to answer this issue.
2.2 The ECSI model in higher education
The basic structure of the ECSI model has been developed in 1998 by the ECSI Technical Committee (ECSI Technical Committee, 1998) as a structural equation model, comprising links between consumer satisfaction and its determinants and consequences. In particular, the causes of customer satisfaction foreseen in the model are image, expectations, perceived quality and perceived value, being loyalty the presented consequence of satisfaction. To each latent variable, a set of manifest measurable variables are associated and these last ones are observed by survey questions to the customers. The use of multiple indicators to measure the determinants and the consequences of satisfaction leads to greater validity and reliability of results.
The ECSI approach was chosen for the current study for its flexibility when applied to a wide variety of services, mainly due to the use of generic questions. In fact, the ECSI has been used across a wide variety of products, services at industry-level and in public sector services for customer satisfaction measurement. Based on literature review, and as far as education is concerned, a reduced number of studies have applied the ECSI methodology to HEIs. Martensen et al. (2000) presented the first study using the ECSI methodology to measure students’ satisfaction towards the HEI attended. Campostrini and Gerzeli (2007), Chitty and Soutar (2004), Alves and Raposo (2007), Chiandotto et al. (2007) and Brown and Mazzarol (2009) have followed, but none has considered employability as a determinant
of satisfaction. All have achieved to obtain results on the attempt of measuring students’ satisfaction with the ECSI methodology, sustaining our modeling approach.
As for the antecedent variables and their corresponding survey questions, they have been adjusted to the context of HE. Therefore, the global image of the HEI attended has been measured through items such as the institution’s academic status, its students’ educational achievement and its contribution to the development of society. In the educational framework, this variable has shown to have a considerable impact on students’ satisfaction and loyalty regarding the HEI (Martensen et al., 2000; Brown and Mazzarol, 2009). Expectations have been studied considering students’ expectations when enrolling the HEI attended regarding items such as course’s curricula, teachers’ pedagogical methods, preparation to coming job and career. This variable has, in previous studies, proved to have a positive effect on satisfaction via perceived quality (Anderson and Sullivan, 1993; Kristensen et al., 1999), being therefore relevant for the present study. As far as quality is concerned, this variable was split into the quality of “hard ware”, for the non human elements (e.g. study programmes and courses) and the quality of “soft ware”, for the human elements (teaching and administrative staff), following the works of Kristensen et al.(1999), Chitty and Soutar (2004) and Chiandotto et al. (2007). Perceived value is expected to have an influence on students’ satisfaction with the attended HEI, as they tend to expect that time and money invested in education pay returns. In previous studies, this relationship has confirmed value to have a direct and positive impact on satisfaction (Martensen et al., 2000; Alves and Raposo, 2007). As for satisfaction, the items suggested by Oliver (1996) were followed and students were asked to express, for instance, their satisfaction on the topic of the services provided by the HEI attended and overall experience. Finally, loyalty, as the only consequent variable of satisfaction has been studied as an important element that informs on topics such as the reputation of the institution, the students’ intention to recommend it and their intention to re-enroll for postgraduate studies (Hennig-Thurau et al., 2001).
Employability, as the new variable included in the original model was assessed using items used in the studies of Harvey (2001), Knight and Yorke (2003) and Schomburg and Teichler (2006). Nine items, including the importance of the attended HEI in the process of finding a first job, the value given by employers to the institution itself and the adequacy of the studies with respect to the employment requisites were selected to ascertain this variable.
As for the introduction of this construct on the ECSI model, as an antecedent of satisfaction and loyalty, it proved to be conceptually and empirically relevant as it was shown to have a very significant effect on the image of the HEI attended, being this one, image, the construct with the greatest impact on the satisfaction formation process (Authors, 2011). The strong effect of employability on image reinforces the importance HEIs shall give to the integration of the concept on their educational practice and promotional strategy. The image of the HEIs can be crucial to attract new students and to the loyalty of the alumni, so the details of information related to employability and the good results achieved at this level, when announced, will certainly contribute to image’s enhancement. The contribution of this study is to explore the integration of employability in the ECSI model, identifying and characterizing segments of graduates regarding the relations among its constructs.
2.3 Conceptual model and research hypotheses
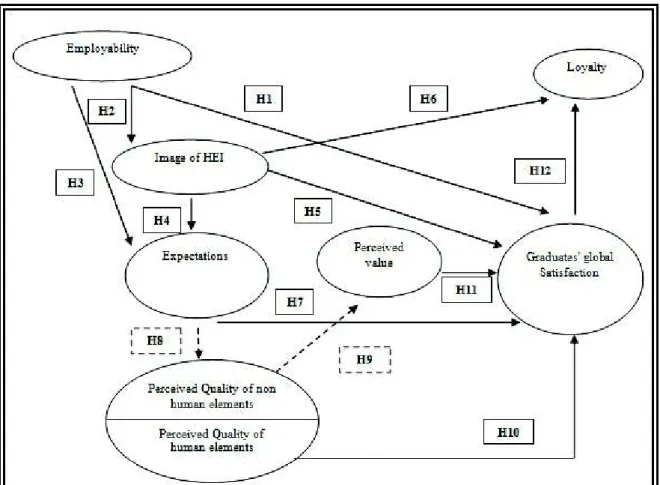
With the purpose of measuring graduates’ satisfaction regarding the HEI attended and the role of employability in it, a research model was developed, taking into account the ECSI framework. Consistent with the objectives of this study, the model, in Figure 1, has therefore been developed and tested. The hypotheses under test are described as follows and indicated in the figure.
H1: Employability has a direct effect on satisfaction concerning the HEI attended; H2: Employability has a direct effect on the image of the HEI attended;
H3: Employability has a direct effect on expectations;
H4: The image of the HEI has a positive and direct effect on expectations; H5: The image of the HEI has a positive and direct effect on satisfaction; H6: The image of the HEI has a positive and direct effect on loyalty; H7: Expectations have a direct effect on satisfaction;
H8: The effect of expectations on satisfaction is indirect through quality;
H9: Perceived quality of non-human elements has an indirect effect on satisfaction through perceived value;
H10: Perceived quality of human elements has a positive and direct effect on satisfaction; H11: Perceived value has a direct and positive impact on satisfaction;
H12: Satisfaction concerning the HEI attended has a positive and direct effect on loyalty to the institution.
With the exception of H8 and H9, all the hypotheses state a direct effect between the correspondent latent variables. Besides a direct effect, all the hypotheses, excepting H1, H7 and H9 propose a positive effect between the variables. H8 and H9 indicate indirect effects.
3. METHODOLOGY
Data for this study was obtained from a questionnaire applied from January 2010 to June 2010 to 166 Tourism graduates working in the tourism industry in the region of Leiria-Fatima, Portugal. The response rate equals 80.2% and the sample size meets the requirements for PLS-PM analysis. The questionnaire considered the ECSI original questionnaire’s structure and it was divided into two major parts. The first part dealt with graduates’ background and the second part was divided into seven sections, each one related to the constructs presented in the research model (employability, image, expectations, quality, value, satisfaction, loyalty), described by three to nine measurement variables measured on a 5-point Likert scale.
The global model was previously estimated by PLS-PM. All measures in the model are reflective. Then, the FIMIX-PLS approach was applied to identify HE consumer segments. SmartPLS 2.0 (Ringle et al., 2005) was used. The segment number was decided based on the comparison among different model performance indicators (Akaike Information Criterion (AIC), Bayesian Information Criterion (BIC), Consistent AIC (CAIC), Corrected AIC with the penalty factor of three (AIC3), Normed Entropy Statistic (EN)). The significance of the indirect effects was assessed by the Sobel Test (Sobel, 1982; MacKinnon et al., 2002).
4. RESULTS AND DISCUSSION 4.1 Sample’s description
The distribution of the characterization variables of respondents are presented in table 4 (column “global”). The obtained data shows that our sample comprises 127 female (76.5%) and 39 males (23.5%) and the mean age of the respondents was 29.0. Regarding their education and training, all the respondents held a bachelor degree on tourism area, which was an assumption of the study. More than 70% are graduated on “Tourism” (72.7%) and the remaining individuals on “Tourism and Hospitality Management”. 13.3% attended a masters’ program and from these 2 have already concluded it. Finally, 1.8% attended a PhD program. Furthermore and as far as work experience is concerned, for the majority of the respondents (70.5%) the job at the time of the survey was not their first job and when asked about the links between that job and the scientific area of the BSc, 93.4% answered positively. Lastly, and on the subject of income, 66.7% of the respondents received monthly between 451€ to 900€, 29.0% received from 901€ to 1350€ and 3.1% received more than 1350€.
4.2 Indicators’ description
The latent variables and the corresponding indicators considered in the research model were analyzed according to the respondents’ level of agreement (table 1).
Results for the items related to employability show that the ones which gathered the highest values of agreement correspond to the relevance of training to perform the job functions and its importance to the possibility of career progress. As for image, indicators with the higher percentages in the categories of agreement are those which reflect the perception of respondents in relation to the attended HEI, considering it a good institution to study and the one that characterizes the HEI as innovative and forward looking. The indicators linked to the variable expectations with the highest agreement answers are those related to the curriculum of the attended course and the scientific knowledge of teachers. As for the indicators used to measure the concept of quality, the ones with the highest percentage of agreement are related to scientific knowledge and teaching skills of teachers.
Value is distinguished from the previous variables as being the one with a higher concentration of responses alluding to the disagreement. Therefore, the ease in obtaining a good job seems not to reward the amount paid for education, according to students’ answers.
The concept of satisfaction was measured by five indicators and overall satisfaction of respondents with the service provided by the HEI was the attribute with the highest percentage of agreement. As for loyalty, approximately 60% of respondents expressed the intention to recommending the attended HEI and nearly half would choose the same institution to attend post-graduate training.
Table 1: Distribution of answers in the different latent variables
Latent Variables Indicators Strongly agree + Disagree (%) Neither agree nor disagree (%) Agree + Strongly agree (%) Employability
Globally, the HEI attended allows finding a first job before six
months after graduation. 19.9 36.1 44.0
Globally, the HEI attended is valued by employers. 22.3 31.9 45.8 Globally, the HEI attended interacts with the tourism industry
sector. 13.3 27.7 59.0
Globally, the HEI attended prepares students for the transition to
the job market. 23.7 23.0 53.3
Globally, the degree program is directly linked and relevant to a
succeeded performance of professional duties. 13.2 17.5 69.3
Globally, having a bachelor’s degree raises the expectation of
professional enhancement. 10.2 23.5 66.3
Globally, the HEI attended enhances the adequacy of the studies
with respect to the employment requisites. 19.3 31.3 49.4
Globally, the HEI attended allows and enhances lifelong learning. 10.9 32.5 56.6 Globally, the HEI attended matches the tourism industry sector
demands. 16.9 31.9 51.2
Image
Generally, this is a good HEI to study. 5.4 12.7 81.9
The HEI attended shows and encourages innovation. 9.6 21.7 68.7
The HEI attended has a trustworthy academic status. 13.9 33.7 52.4 The HEI attended offers its students educational achievement. 11.5 28.3 60.2
The HEI attended supports its graduates. 28.9 28.3 42.8
The HEI attended contributes dynamically to the society
development. 6.0 27.1 66.9
Expectations
Course’s curricula. 3.1 37.3 59.6
Teachers’ pedagogical methods. 6.7 35.5 57.8
Teachers’ scientific knowledge. 5.5 35.5 59.0
HEI facilities. 35.0 37.9 27.1
HEI support functions. 26.5 45.8 27.7
Overall quality of services in general. 9.0 51.2 39.8
Preparation to coming job and career. 10.9 32.5 56.6
The services received considering your initial expectations. 6.0 40.4 53.6
Quality
Overall quality of the service provided. 5.4 49.4 45.2
Course’s curricula. 13.8 44.6 41.6
Teachers’ pedagogical methods. 6.1 36.1 57.8
Teachers’ scientific knowledge. 4.9 35.5 59.6
The organization and functioning of the HEI. 10.9 58.4 30.7
HEI facilities (library. computing services tutorials. …). 27.1 41.6 31.3
Non-teaching staff and services. 14.5 58.4 27.1
Value
The value paid for this course at this HEI is rewarded by the way
employers face and look for its graduates. 38.6 34.3 27.1
The value of the education received is rewarded by the easiness of
finding a first job. 38.6 31.9 29.5
The value paid for this course is rewarded by the overall provided
service. 27.2 35.5 37.3
Satisfaction
Globally. I am satisfied with the services provided by the HEI
attended. 10.2 18.1 71.7
My expectations regarding overall experience received were totally
satisfied. 1.4 13.9 68.7
As an employer fully integrated in the labor market. the HEI
attended satisfies my need for advanced studies. 25.3 34.9 39.8
The HEI attended can be considered as an ideal HEI. 33.7 41.0 25.3 The services offered and acquired skills reward having chosen this
HEI. 18.1 29.5 52.4
Loyalty
If I had to choose an HEI to graduate. I’d choose the same. 20.5 25.3 54.2 If I had to choose a course again. I’d choose the same. 19.9 23.5 56.6
I intend to recommend the HEI attended. 1.5 28.3 60.2
I intend to recommend the course I’ve attended. 14.5 30.7 54.8
If I choose to continue studying. I’ll do it at the HEI attended. 16.3 35.5 48.2
4.3 Results from FIMIX-PLS
FIMIX-PLS algorithm was repeated for a different number of segments. The joint consideration of AIC3 and CAIC statistics suggested a two-segment solution (Sarstedt et al., 2011), in which the measurement model was identical across latent segments. Segment 1 is the smaller comprising 24.7% of the overall graduate group.
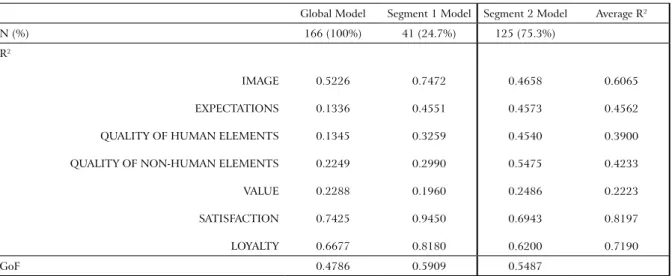
An overview of the quality assessment measures is presented in table 2. R2 values of the
endogenous latent variables in segment 1 are greater than in the global model, indicating that the explained variance has really been improved for segment 1 model. In this segment, Loyalty, Satisfaction and Image have high values of R2, indicating that all determinants
have a strong influence on these constructs. Segment 2 shows more moderate R2 values for
Loyalty, Satisfaction and Image, although the other constructs have higher values of R2 than
in the global model. However, the values of the average R2 remain greater than those of the
global model (with the exception of Value), confirming that FIMIX-PLS has an important role in uncovering the unobserved heterogeneity of the global structural equation model. Similarly, the GoF measure (Tenenhaus et al., 2005) in segments are greater than in the global model, thus its higher value represents better path model estimations than in the global model.
Regarding the measurement models, quality assessment is verified for the global and segment-specific models since average variance extracted and composite reliability measures are clearly placed over the recommended thresholds for all latent variables.
Table 2: Some measures of quality assessment of global and FIMIX-PLS segment-specific models
Global Model Segment 1 Model Segment 2 Model Average R2
N (%) 166 (100%) 41 (24.7%) 125 (75.3%)
R2
IMAGE EXPECTATIONS QUALITY OF HUMAN ELEMENTS QUALITY OF NON-HUMAN ELEMENTS VALUE SATISFACTION LOYALTY 0.5226 0.1336 0.1345 0.2249 0.2288 0.7425 0.6677 0.7472 0.4551 0.3259 0.2990 0.1960 0.9450 0.8180 0.4658 0.4573 0.4540 0.5475 0.2486 0.6943 0.6200 0.6065 0.4562 0.3900 0.4233 0.2223 0.8197 0.7190 GoF 0.4786 0.5909 0.5487
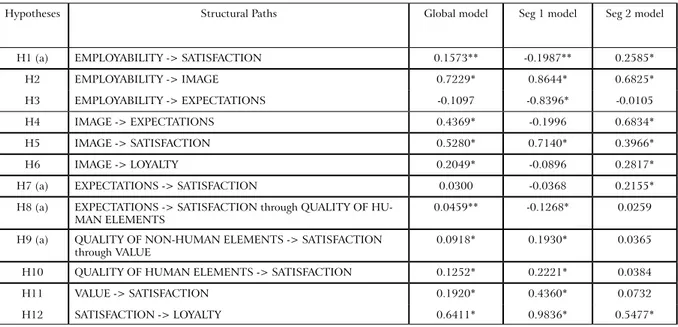
Table 3 presents an overview of structural parameter estimates for the global model and the two segment-specific models. Multiple group comparison results provide evidence of varying relationships among constructs for the two segments. T-tests confirm that the segments are different in all structural relationships.
Comparing significance and strength of the structural coefficients, results show that (1) all relationships hypothesized in H2, H5 and H12 are positive and significant in the three models; however they are the strongest in the segment 1 model and the weakest in the segment 2 model. The influence of employability on satisfaction (H1) is also significant in all models, but is the strongest in segment 2 model; (2) H3 is only verified in the segment 1 model; indeed for these graduates the employability negatively influences their expectations; (3) Contrarily to the global model results, the expectation of the graduates of segment 1 negatively affects satisfaction towards HE through quality of human elements (H8). However, in both latter models, the quality of non-human elements affects positively satisfaction through value, confirming H9; (4) Like in the global model, the segment 2 results shows that the stronger the HE image that graduates have the stronger their expectations and loyalty towards the HE, verifying H4 and H6 respectively. The expectations of these graduates also influence satisfaction (H7), despite its low estimate.
Regarding the main influences on satisfaction and loyalty, findings of the two-segment solution can be summarized as follows: (1) In the segment 1, image and value are the core determinants of satisfaction (with path coefficients of 0.714 and 0.436 respectively). The indirect effects of expectations are weak. Loyalty is strongly influenced by satisfaction. (2) Segment 2 has image and expectations as the main drivers of satisfaction which, in turn, jointly with image, influence the loyalty towards the HE.
With reference to employability, it strongly affects image in the two segments. However, for the small group of graduates of segment 1, the employability negatively influences satisfaction and the expectations that graduates have about the HE. This may be either due to students’ lack of understanding of the labour-market, misunderstanding of the concept of employability or to their lack of awareness of the importance of employability issues for the process of entering into the professional arena. Both segments should be of concern to HEIs in their education programs, as employability has shown to be an important antecedent of image, which must be worked in a marketing perspective to enhance the institution’s reputation concerning the preparation of employable students.
Table 3: Standardized path coefficient for global model and FIMIX-PLS segment result
Hypotheses Structural Paths Global model Seg 1 model Seg 2 model
H1 (a) EMPLOYABILITY -> SATISFACTION 0.1573** -0.1987** 0.2585*
H2 EMPLOYABILITY -> IMAGE 0.7229* 0.8644* 0.6825*
H3 EMPLOYABILITY -> EXPECTATIONS -0.1097 -0.8396* -0.0105
H4 IMAGE -> EXPECTATIONS 0.4369* -0.1996 0.6834*
H5 IMAGE -> SATISFACTION 0.5280* 0.7140* 0.3966*
H6 IMAGE -> LOYALTY 0.2049* -0.0896 0.2817*
H7 (a) EXPECTATIONS -> SATISFACTION 0.0300 -0.0368 0.2155*
H8 (a) EXPECTATIONS -> SATISFACTION through QUALITY OF HU-MAN ELEMENTS
0.0459** -0.1268* 0.0259
H9 (a) QUALITY OF NON-HUMAN ELEMENTS -> SATISFACTION through VALUE
0.0918* 0.1930* 0.0365
H10 QUALITY OF HUMAN ELEMENTS -> SATISFACTION 0.1252* 0.2221* 0.0384
H11 VALUE -> SATISFACTION 0.1920* 0.4360* 0.0732
H12 SATISFACTION -> LOYALTY 0.6411* 0.9836* 0.5477*
* p < 0.05; ** p < 0.10
(a) two-tailed statistical hypothesis
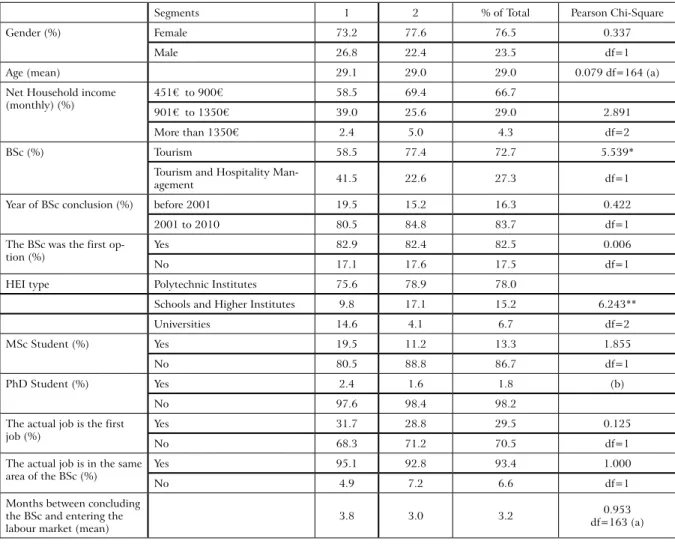
4.5 Segments’ profile
Table 4 present the distribution differences across and within segments. The results show significant differences only on the graduates’ BSc and type of HEI frequented, which indicate that these variables might be discriminate variables of the segments. It is important to note that, contrary to segment 2 and the whole sample, segment 1 has a great percentage of “Hospitality Management’s” graduates and has more graduates who frequented the university.
The main characteristics of the graduates’ segments are summarized as follows: Both segments reveal similar percentages when it comes to gender, age, the BSc was the first option and the actual job is the first job. As for education and training, segment 2 presents closer results to the ones obtained for the whole sample as far as the attended course is concerned. All the other items related to this topic are quite similar in both segments when compared to the entire sample. Moreover, the items related to work experience reveal that both segments’ answers are equivalent to those of the sample, except for the net income, that tends to be higher in segment 1, namely in the category 901€ to 1350€.
Table 4: Characteristics of HEI consumers’ segments
Segments 1 2 % of Total Pearson Chi-Square
Gender (%) Female 73.2 77.6 76.5 0.337
Male 26.8 22.4 23.5 df=1
Age (mean) 29.1 29.0 29.0 0.079 df=164 (a)
Net Household income (monthly) (%)
451€ to 900€ 58.5 69.4 66.7
901€ to 1350€ 39.0 25.6 29.0 2.891
More than 1350€ 2.4 5.0 4.3 df=2
BSc (%) Tourism 58.5 77.4 72.7 5.539*
Tourism and Hospitality
Man-agement 41.5 22.6 27.3 df=1
Year of BSc conclusion (%) before 2001 19.5 15.2 16.3 0.422
2001 to 2010 80.5 84.8 83.7 df=1
The BSc was the first op-tion (%)
Yes 82.9 82.4 82.5 0.006
No 17.1 17.6 17.5 df=1
HEI type Polytechnic Institutes 75.6 78.9 78.0
Schools and Higher Institutes 9.8 17.1 15.2 6.243**
Universities 14.6 4.1 6.7 df=2
MSc Student (%) Yes 19.5 11.2 13.3 1.855
No 80.5 88.8 86.7 df=1
PhD Student (%) Yes 2.4 1.6 1.8 (b)
No 97.6 98.4 98.2
The actual job is the first job (%)
Yes 31.7 28.8 29.5 0.125
No 68.3 71.2 70.5 df=1
The actual job is in the same area of the BSc (%)
Yes 95.1 92.8 93.4 1.000
No 4.9 7.2 6.6 df=1
Months between concluding the BSc and entering the labour market (mean)
3.8 3.0 3.2 df=163 (a)0.953
(a) T statistic of Independent sample t-test; (b) Not possible to verify the assumptions of the Chi-square test * Significant at the 0.01 level; ** Significant at the 0.05 level
5. CONCLUSION
The results of our empirical study show that the ECSI model allows an accurate analysis of the graduates’ satisfaction, indicating its flexibility when applied to the educational field. Image, quality, expectations and value have been confirmed, directly or indirectly, as determinants of the graduates’ satisfaction and loyalty as its main consequence. Employability has shown empirical relevance due the significant impact it has on image, globally and in both segments, revealing to be the most important antecedent of satisfaction.
Satisfaction should therefore be analyzed as a multi-dimensional concept, and the image of HEIs should be enhanced as this is the precedent that has the greatest impact on it. As for image, results indicate that it is strongly influenced by employability, which reveals that HEIs should also invest its efforts primarily on these two dimensions, image and perceived employability, to obtain the satisfaction and loyalty of its immediate consumers, the students. Quoting Harvey (2010, p. 7) “a degree may once have been a passport into graduate employment: it was indicative of a level of knowledge and intellectual ability. However, as a result of organizational changes and the expansion in the numbers of graduates, this is no longer the case. “
Given this reality, and taking into account the results found, HEIs should make a commitment to ensure the qualification of human resources in accordance with the actual needs of the Tourism industry and somehow guarantee students’ understanding of the importance of developing employability skills, their development as employable individuals and as relevant advertisers of the institution to the outside market.
As for the obtained results on both segments, they emphasize on the importance of institutional image’s management and subsequent analysis of Higher Education students so that institutions may reflect upon the heterogeneity of its main consumers and outline strategies that will reach different public targets. Therefore, further research is required to improve the characterization of the identified segments, namely in what concerns the aspects that have a potentially discriminant power between segments, for interpretation purposes and additional insights.
There are, indeed, some significant opportunities for further research within this topic, such as trying to understand more deeply the reasons for the existence of a segment of students to whom employability reduces satisfaction as this information will certainly represent an important asset for institutions and also to develop a set of guidelines for HEIs or education policy to deal with these reasons.
REFERENCES
Alves, H. and Raposo, M. (2007). Conceptual Model of Student Satisfaction in Higher Education. Total Quality Management. 18(5): 571-588.
Anderson, E. W. and Sullivan, V. W. (1993). The antecedents and consequences of customer satisfaction for firms. Marketing Science. 12: 125-143.
Brown, R. and Mazzarol, T. (2009). The importance of institutional image to student satisfaction and loyalty within higher education. Higher Education. 58: 81-95.
Campostrini, S. and Gerzeli, S. (2007). Informative Sources for the Evaluation of the University Education Effectiveness in Italy. In: L. Fabbris (ed.), Effectiveness of University
Education in Italy. Employability, Competences, Human Capital (p. 2-9). Physica Verlag. Padua. Chiandotto, B., Bini, M. and Bertaccini, B. (2007). Quality Assessment of the University
Educational Process: an Application of the ECSI Model. In: L. Fabbris. (ed.), Effectiveness of
University Education in Italy. Employability, Competences, Human Capital (p. 43-54). Physica Verlag. Padua.
Chitty, B. and Soutar, G. N. (2004). Is The European Customer Satisfaction Index Model Applicable to Tertiary Education. ANZMAC 2004 Conference Wellington (pp. 1-7). Australian and New Zealand Marketing Academy.
ECSI Technical Committee (1998). European Customer Satisfaction Index. Foundation and Structure for Harmonized National Pilot Projects. European Comission (DGIII, Industry) and European Organizationfor Quality (EOQ).
Hahn, C., Johnson, M. D., Herrmann, A. and Huber, F. (2002). Capturing customer heterogeneity using a finite mixture PLS approach. Schmalenbach Business Review. 54(3): 243-269.
Harvey, L. (2001). Defining and Measuring Employability. Quality in Higher Education.7(2): 97-109.
Harvey, L. (2010). New realities: The relationship between higher education and employment.
HEFCE (2001). Higher Education Funding Council for England. Accessed in: 12th of May 2009,
in: http://www.hefce.ac.uk
Hennig-Thurau, T., Langer, M. and Hansen, U. (2001). Modeling and Managing Student Loyalty: An Approach Based on Relationship Quality. Journal of Service Research. 4: 331-344.
Kanji, G. K. and Tambi, A. M. (1999). Total quality management in UK higher education institutions. Total Quality Management. 10(1): 129-153.
Knight, P. and Yorke, M. (2003). Employability and Good Learning in Higher Education.
Teaching in Higher Education. 8(1): 3-16.
Knight, P. and Yorke, M. (2010). Employability through the curriculum. Tertiary Education and Management. 8(4): 261-276.
MacKinnon, D. P., Lockwood, C. M., Hoffman, J. M., West, S. G., and Sheets, V. (2002). A comparison of methods to test the significance of the mediated effect. Psychological
Methods. 7: 83-104.
Martensen, A., Grønholdt, L., Eskildsen, J. K. and Kristensen, K. (2000). Measuring student oriented quality in higher education: Appllication of the ECSI methodology. Sinergie
rapporti di ricerca. 9: 371-383.
Mestre, A. M. (2012). Sessão de Abertura, Conferência Emprego Jovem, Perspectiva e Horizonte, ISCTE, Portugal. Acessed in: 9th of February 2012,in: http://www.portugal.
gov.pt/media/457645/interven__o_sedj_na_confer_ncia_emprego_jovem_perspetiva_e_ horizonte_9fev___2_.pdf
Ministério da Economia e da Inovação [MEI] (2007). Plano Estratégico Nacional do Turismo
para o Desenvolvimento do Turismo em Portugal. Turismo de Portugal. Lisboa.
Oliver, R. L. (1996). Satisfaction: A Behavioral Perspective on the Consumer. McGraw-Hill College. Colombus.
Ringle, C. M., Wende, S. and Will, A. (2005). SmartPLS 2.0 (M3) Beta. Accessed in: 28th
of May 2012, in: http://www.smartpls.de
Sarstedt, M. (2008). A review of recent approaches for capturing heterogeneity in partial least squares path modelling. Journal of Modelling in Management. 3(2): 140-161.
Schomburg, H. and Teichler, U. (2006). Higher Education and Graduate Employment in Europe. Springer. The Netherlands.
Sobel, M. E. (1982). Asymptotic confidence intervals for indirect effects in structural equation models. In: S. Leinhardt (Ed.), Sociological Methodology 1982 (290-312). American Sociological Association. Washington DC.
Tenenhaus, M., Esposito Vinzi, V., Chatelin, Y. M. and Lauro, C. (2005). PLS path modeling.