ANALYSIS OF PHENOLIC, SULFUR
AND VOLATILES AROMA
COMPOUNDS IN WINES OF FOGO
ISLAND – CAPE VERDE
This work was supported by Fundação Calouste Gulbenkian through the award doctoral fellowship
Acknowledgements
A thanks to Fundação Calouste Gulbenkian for the financial support for this work.
A special thanks to my mother Clarice Pereira, my brothers Odarley Pereira, Vânia Vania Pereira, Pereira Hernani and also Katia Teixeira for the constant support.
Special thanks to my teacher and supervisor Prof. Dr Joaquim Carlos G. Esteves da Silva, who always expressed interest in accepting me in his research group since the master's degree in the FCUP.
A special thanks to Prof. Dr. Isabel Vasconcelos of Faculty of Biotechnology at Catholic University of Porto (FB-CUP) for allowing the use of the CUP laboratory.
Special thanks to Dr. Nathalie Moreira for all support in the GC-FPD, GC-MS, and helping me to overcome my doubts in this work with her experience and scientific knowledge. The Engineering Cristina Santos of CUP a thank for the technical support in the GC-FPD.
A thank to Dr. Zelia Azevedo of FCUP for its availability and technical support in LC-MS.
I would like to extend my thanks to my friends and also my colleagues of CIQ-UP, especially Edilson Barbosa, Denis Teixeira, Elder Andrade, Lenine Rodrigues, Maria L. C. Brito, Minarvino Pietra, Eldy Leocadio, Felisberto Mendes, Alexandre Moreira, Natalie Fonseca, Hayta Fonseca, Elias Pereira, Carlos Gonçalves, Ailton Mendes, Joel Santos, Diana Crista, Bruno Campos and Paulo José by availability to help and friendship during of this work.
Abstract
The Island of Fogo, one of the islands of the Cape Verde archipelago has invested in the production of wines. The wine trade is important to the economy of the island and has been an asset for the ecotourism mainly in the Chã das Caldeiras region. Wine is a complex alcoholic beverage resulting from the fermentation of the grapes must. This complexity is due to the presence of various substances which are transferred from grapes or form during fermentation or in another stage of production. Several of these compounds may contribute to the quality of the wine but there are other that harm the quality of this beverage depending on their concentrations and the limits of sensory perception. Several compounds were analysed in the wines of Fogo Island including phenolic compounds, sulfur compounds and volatile compounds responsible for the aroma of the wines. For the phenolic compounds were analysed anthocyanins and non-anthocyanic compounds. Among the non-non-anthocyanic, flavonols, flavanols and phenolic acids were analysed. These phenolic compounds were analysed by high perfomance liquid chromatography with diode array detector and mass spectrometry. Because of the presence of the sulfur in the Chã das Caldeiras and because majority of the sulfur compounds influence negatively the quality of the wine, the sulfur compounds were also analysed. Several low volatile sulfur compounds, like methionol, were analysed by gas chromatography with flame photometric detector. The volatile compounds that give fruity and floral aromas to the wines were also analysed. Many of these compounds were analysed, including various esters, alcohols such as 2-phenylethanol and 1-hexanol, terpenes, nor-isoprenoids, sesquiterpenes and some acids such as hexanoic and decanoic acids. The analysis of these compounds was carried out by solid phase microextraction gas chromatography coupled with mass spectrometry. Several samples of red, white and rosé wines of different producers of the Fogo Island were analysed and all results were submitted to the Tukey test to check significant differences between the values of the concentrations determined. The application of chemiometric analysis including principal component analysis, linear discriminant analysis and hierarchical cluster analysis in the wines, allowed to differentiate the wines of Cape Verde based on phenolic, heavy sulfur and volatiles aroma compounds. With chemometric analysis was possible to distinguish the four analysed red wines Chã, Sodade, Montrond and Sangue de Vulcão through the phenolic compounds. Sodade rosé wine through sulfur compounds presented a distinct classification of other wines with chemometric analysis while for volatile aromatic compounds, the white wine Chã stood out from other wines.
Keywords: Cape Verde – Fogo Island, Chã das Caldeira, wines, phenolic compounds, sulfur compounds, volatiles aroma compounds, liquid chromatography, gas chromatography, chemometric analysis.
Resumo
A ilha do Fogo, uma das ilhas do arquipélago de Cabo Verde, tem apostado fortemente na produção dos vinhos. O comércio do vinho influencia de forma importante na economia da ilha e tem sido uma mais-valia no ecoturismo principalmene na região de Chã das Caldeiras. O vinho é uma bebida alcoolica complexa resultante da fermentação do mosto das uvas. Esta complexidade deve-se a presença de diversas substâncias que são transferidas das uvas, que se formam durante a fermentação do mosto ou numa outra fase de produção. Vários desses compostos podem contribuir para a qualidade do vinho mas também existem outros que prejudicam a qualidade desta bebida dependendo das suas concentrações e dos limites de perceção sensorial. Nos vinhos da ilha do Fogo foram analisados vários compostos entre os quais compostos fenólicos, compostos sulfurados e compostos voláteis responsáveis pelo aroma dos vinhos. Nos compostos fenólicos foram analisados as antocianinas e os compostos não-antociânicos. Entre os não-antociânicos foram analisados os flavonóis, flavanóis e ácidos fenólicos. Esses compostos fenólicos foram analisados através da cromatografia líquida de elevada eficiência com detector por arranjo de diodos e espetrometria de massa. Por causa da presença do enxofre na região de Chã das Caldeiras e porque a maioria dos compostos de enxofre ou sulfurados influenciam de forma negativa a qualidade do vinho também foram analisados os compostos sulfurados. Vários compostos sulfurados pouco voláteis ou pesados, como o metionol, foram analisados através da cromatografia gasosa com detetor fotométrico de chama. Também foram analisados os compostos voláteis que conferem aromas frutados e florais aos vinhos. Varios destes compostos foram analisados, destacando-se diversos ésteres, os álcoois como o 2-feniletanol e o 1-hexanol, vários terpenos, norisoprenoides, sesquiterpenos e alguns ácidos como o ácido hexanóico e ácido decanóico. A análise destes compostos foi feita através da microextração em fase sólida com cromatografia gasosa acoplado com espetrometria de massa. Foram analisados amostras de vinhos tintos, brancos e rosé dos principais produtores da ilha do Fogo e todos os resultados foram submetidos ao teste de Tukey a fim de verificar se existem diferenças significativas entre os valores determinados. A aplicação de análise quimiométrica nomeadamente análise de componentes principais, análise discriminante linear e análise hierárquica de cluster permitiu diferenciar os vinhos de Cabo Verde com base nos compostos fenólicos, sulfurados e voláteis. Da análise quimiométrica, foi possível distinguir os quatro vinhos tintos analisados Chã, Sodade, Montrond e Sangue de Vulcão atraves dos compostos fenólicos. O vinho rosé Sodade com compostos sulfurados apresentou uma
classificação distinta dos outros vinhos através da análise quimiométrica enquanto que nos compostos voláteis aromáticos o vinho branco Chã destacou-se dos outros vinhos.
Palavras chaves: Ilha do Fogo – Cabo Verde, Chã das Caldeiras, vinhos, compostos fenólicos, compostos sulfurados, compostos voláteis, cromatografia líquida e cromatografia gasosa, análise quimiométrica.
Index
Acknowledgements ... iii
Abstract ... iv
Resumo ... vi
List of tables ... xi
List of figures ... xiii
Abbreviations and symbols ... xvi
1. INTRODUCTION AND CHARACTERIZATION OF FOGO ISLAND CAPE VERDE ...1
1.1. CHARACTERIZATION OF CAPE VERDE ... 2
1.2. CHARACTERIZATION OF FOGO ISLAND ... 2
1.3. THE VITIVINICULTURE IN FOGO ISLAND - CAPE VERDE ... 4
1.4. OBJECTIVE ... 6
2. PHENOLIC COMPOUNDS IN WINE ... 7
2.1. INTRODUCTION TO PHENOLIC COMPOUNDS ... 8
2.1.1. Anthocyanins ... 9
2.1.2. Flavonols. ... 12
2.1.3. Flavan-3-ols ... 14
2.1.4. Benzoic, cinamic acids and derivates ... 17
2.1.5. Stilbenes – Resveratrol. ... 18
3. SULFUR COMPOUNDS IN WINES ... 19
3.1. INTRODUCTION TO SULFUR COMPOUNDS IN WINES ... 20
4. VOLATILES AROMA COMPOUNDS IN WINES ... 25
4.1. INTRODUCTION TO VOLATILES AROMA COMPOUNDS IN WINES ... 26
4.1.1. Terpenes ... 26
4.1.2. Nor-isoprenoids ... 27
4.1.2. Esters ... 28
5.1. PRINCIPAL COMPONENTS ANALYSIS (PCA) ... 31
5.2. LINEAR DISCRIMINANT ANALYSIS (LDA)... 32
5.3. HIERARCHICAL CLUSTER ANALYSIS (HCA) ... 33
6. ANALYSIS OF COMPOUNDS IN WINES OF FOGO ISLAND ... 34
6.1. ANALYSIS OF PHENOLIC COMPOUNDS IN WINES OF FOGO ISLAND ... 35
6.1.1. Methods of analysis ... 35
6.1.2. Chemicals and materials ... 35
6.1.3. Preparation of standard solutions ... 35
6.1.4. Samples ... 35
6.1.5. Procedure ... 36
6.1.5.1. Anthocyanins extraction by Solid Phase Extraction ... 36
6.1.5.2. Non-anthocyanic compounds extraction by Liquid Liquid Extraction36 6.1.6. Liquid chromatography mass spectrometry diode array detector conditions 36 6.2. ANALYSIS OF HEAVY SULFUR COMPOUNDS IN WINE ... 37
6.2.1. Method of analysis ... 37
6.2.2. Chemicals and materials ... 37
6.2.3. Samples ... 37
6.2.4. Preparation of standard solutions ... 37
6.2.5. Liquid liquid extraction ... 38
6.2.6. GC-FPD conditions ... 38
6.2.7. Calibration curve and limit of detection ... 38
6.3. ANALYSIS OF VOLATILES COMPOUNDS IN WINE ... 39
6.3.1. Method of analysis ... 39
6.3.2. Materials and chemicals ... 39
6.3.3. Samples wine ... 39
6.3.4. Chromatographic conditions ... 39
6.3.5. Procedure ... 40
7. PRESENTATION AND DISCUSSION OF RESULTS ... 41
7.1. PRESENTATION OF RESULTS FOR PHENOLIC COMPOUNDS ... 42
7.1.1. Calibration curves of standard solutions ... 42
7.1.2. Anthocyanins analysis in red wine ... 44
7.1.3. Non-anthocyanic phenolic compounds analysis in wines ... 47
7.1.4. Discussion of phenolic compounds results ... 49
7.1.5. Chemometric analysis for phenolic compounds in the wines ... 55
7.2. PRESENTATION OF RESULTS FOR SULFUR COMPOUNDS ... 59
7.2.1. Discussion of results for heavy sulfur compound ... 63
7.2.2. Chemometrics analysis for sulfur compounds in the wines ... 69
7.3. PRESENTATION OF RESULTS FOR VOLATILES AROMA COMPOUNDS 75 7.3.1. Discussion of results for volatiles compounds ... 82
7.3.2. Chemometric analysis of volatiles aromas compounds in the wines ... 90
8. CONCLUSION ... 95
List of tables
Table 2.1 - Substituents and the respective anthocyanins ... 10
Table 2.2 - Nomenclature of catechin ... 14
Table 2.3 - Nomenclature of epicatechin ... 15
Table 2.4 - Nomenclature of phenolic acids present in grapes and wines. ... 17
Table 3.1 - Molecular structure of heavy sulfur compounds in wines ... 23
Table 3.2 - Odor, threshold values and concentration of heavy sulfur compounds in wines ... 24
Table 4.1 - Characteristics of some volatile compounds in wine ... 29
Table 7.1 - Retention times, wavelength, concentration range, limit of detection, slope and intercept of the linear regression curves for the standard phenolic compounds. ... 43
Table 7.2 – Absorption peak wavelengths, m/z of fragment and mean concentration with standard deviation (SD), mg.L-1, of anthocyanins in red and rosé wines from Fogo Island. ... 46
Table 7.3 - Mean concentration with standard deviation (SD), mg.L-1, of non-anthocyanic phenolic compounds determined in red and rosé wines from Fogo Island. ... 48
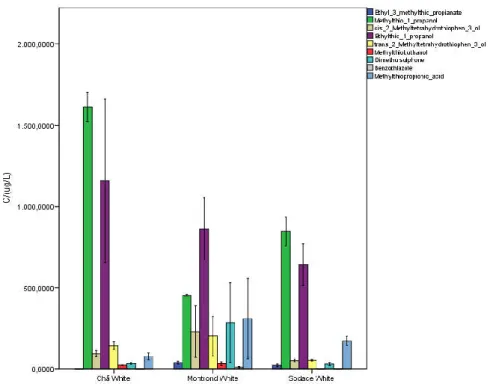
Table 7.4 - Mean concentration with standard deviation (SD), mg.L-1, of non-anthocyanic phenolic compounds determined in white wines from Fogo Island. ... 49
Table 7.5 - Classification function coefficients for phenolic compounds ... 56
Table 7.6 - Standardized canonical discriminant function coefficients for phenolic compounds ... 56
Table 7.7 - Classification matrix for phenolic compounds. ... 57
Table 7.8 - Parameter of calibration curve for sulfur standard solution analysed. ... 59
Table 7.9 - Mean value and standard deviation, µg.L-1, of sulfur compounds determined in white wines of Fogo Island. ... 61
Table 7.10 - Mean value and standard deviation, µg.L-1, of sulfur compounds determined in red and rosé wines of Fogo Island. ... 62
Table 7.11 - Standardized canonical discriminant function coefficients. ... 71
Table 7.12 - Classification function coefficients. ... 72
Table 7.13 - Classification matrix for heavy sulfur compounds. ... 73
Table 7.14 - Retention time (RT), retention indices (RI), identification method (ID), selected ions used as m/z identifiers of volatile compounds in wines. ... 76
Table 7.15 – Concentration mean value and standard deviations (± SD) of volatiles aroma compounds determined in white wine. ... 79
Table 7.16 - Concentration mean value and standard deviations (± SD) of volatiles aroma
compounds determined in red and rosé wines from Fogo Island... 80
Table 7.17 - Standardized canonical discriminant function coefficients ... 91
Table 7.18 - Classification Function Coefficients ... 92
List of figures
Figure 1.1 - Map of Cape Verde in the Atlantic Ocean ... 2
Figure 1.2 - Aerial photograph of Fogo Island. ... 3
Figure 1.3 - Grapevine culture in Chã das Caldeiras ... 4
Figure 2.1 - Molecular structure of monoglucoside anthocyanin. ... 9
Figure 2.2 - Molecular structure of anthocyanin-3-monoglucoside. ... 10
Figure 2.3 - Molecular structure of anthocynin-3-monoglucoside acylated by p-coumaric acid in carbon 5''. ... 10
Figure 2.4 - Structure and equilibria of the anthocyanins present in Vitis vinifera species in wine with pH... 11
Figure 2.5 - Molecular structure of kaempferol. ... 12
Figure 2.6 - Molecular structure of quercetin. ... 12
Figure 2.7 - Molecular structure of myricetin. ... 12
Figure 2.8 - Molecular structure of isohramnetin. ... 13
Figure 2.9 - Basic ring structure of flavonols and convention labelling. ... 13
Figure 2.10 - Molecular structure of catechin series. ... 14
Figure 2.11 - Molecular structure of epicatechin series. ... 15
Figure 2.12 - General structure of proanthocyanidins... 16
Figure 2.13 - Molecular structure of a) benzoic acid and b) cinammic acid. ... 17
Figure 2.14 - Molecular structure of a) cis and b) trans-3,5,4'-trihidroxystilbene (resveratrol) ... 18
Figure 3.1 – Mechanism of formation of sulfur compounds in wines ... 21
Figure 4.1 - Molecular structure of monoterpenes in wines Muscat ... 26
Figure 4.2 - Chemical structure of some nor-isoprenoids detected in wines. ... 27
Figure 7.1 – Chromatogram of Chã red wine extract for anthocyanins at 520 nm. ... 44
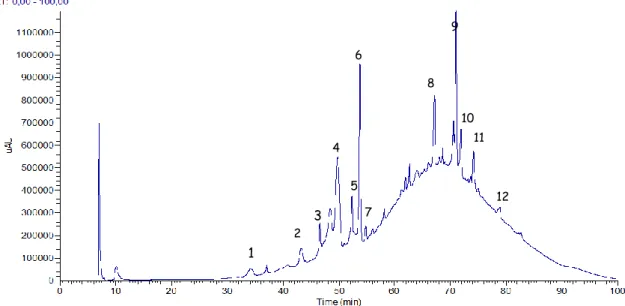
Figure 7.2 - Chromatogram of Chã red wine extract for non-anthocyanic compounds at total scan. ... 47
Figure 7.3 - Graphical comparison of anthocyanins mean concentration determined in red and rosé wines of Fogo Island. ... 50
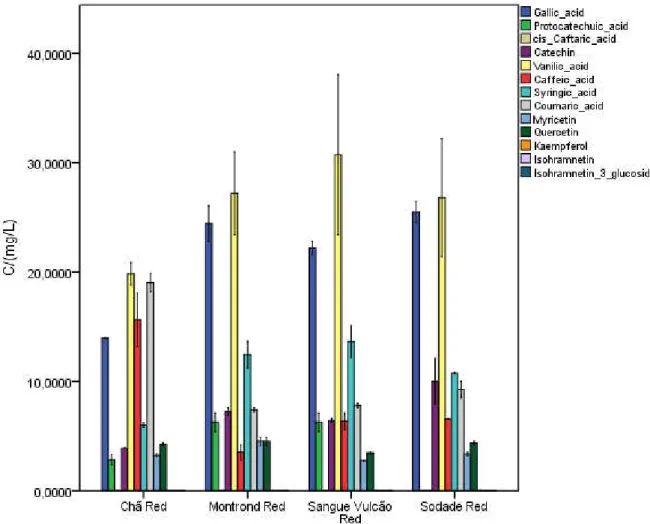
Figure 7.4 - Graphic comparison of mean concentration of non-anthocyanic compounds determined in red wines of Fogo Island. ... 54
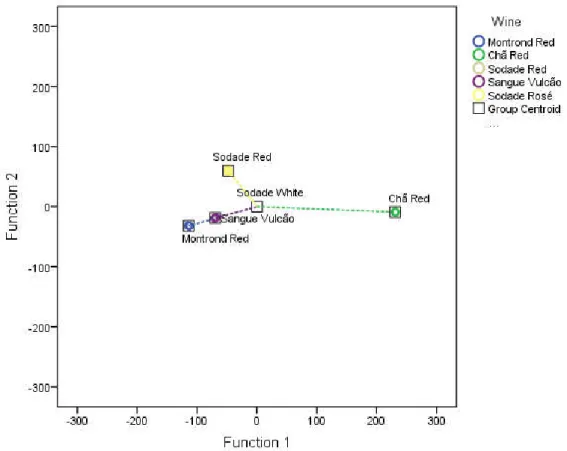
Figure 7.5 - 2D scatter plot of discriminant functions to four wine classification functions with phenolic compounds. ... 55
Figure 7.6 – Dendogram of cluster analysis obtained with phenolic compounds in the wines. ... 57
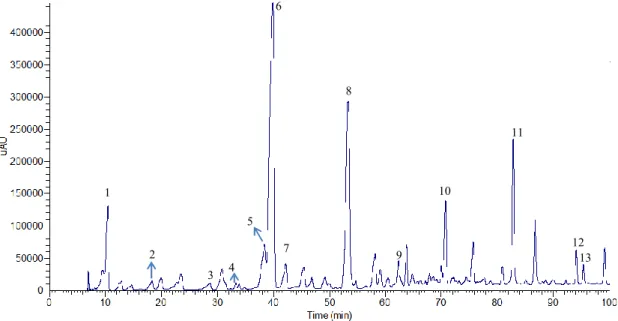
Figure 7.7 - Chromatogram of Sodade red wine extract for heavy sulfur compounds by GC-FPD. ... 60 Figure 7.8 - Graphical comparison of sulfur compounds determined in white wines of Fogo Island. ... 63 Figure 7.9 - Graphic comparison of 3-methylthio-1-propanol determined in red and rosé wines. ... 65 Figure 7.10 - Graphical comparison of sulfur compounds determined in red and rosé wines of Fogo Island. ... 66 Figure 7.11 – Mechanism of formation of methionol from methionine by yeast ... 67 Figure 7.12 - Plot of PCA for heavy sulfur compounds in the wines. ... 69 Figure 7.13 - 2D scatterplot of canonical scores of discriminant functions with heavy sulfur compounds. ... 70 Figure 7.14 - Dendogram of cluster analysis obtained with heavy sulfur compounds in the wines. ... 74 Figure 7.15 - Chromatogram of esters at 88 m/z ion current for Chã red wine sample.77 Figure 7.16 - Chromatogram of esters at 88 m/z ion current for Chã red wine sample.77 Figure 7.17 - Chromatogram for acetate esters at 43 m/z ion current for Chã red wine sample. ... 78 Figure 7.18 - Chromatogram for terpenes at 93/121 m/z ion current for Chã red wine sample. ... 78 Figure 7.19 - Graphic representation of esters determined in white wines of Fogo Island. ... 82 Figure 7.20 – Graphic representation of esters determined in red and rosé wines of Fogo Island. ... 83 Figure 7.21 – Graphic representation of alcohols and acid detected in white wines of Fogo Island. ... 86 Figure 7.22–Graphic representation of alcohols and acid detected in red and rosé wines of Fogo Island. ... 86 Figure 7.23 – Graphic representation of terpenes, norisoprenoids and sesquiterpenes in red and rose wines of Fogo Island. ... 87 Figure 7.24 – Graphic representation of terpenes, norisoprenoids and sesquiterpenes in white wines of Fogo Island. ... 88 Figure 7.25 – Graphic representation of number of compounds detected in all analysed wines from Fogo Island. ... 89 Figure 7.26 - PCA for volatiles compounds in the wines of Cape Verde ... 90
Figure 7.27 - 2D scatter plot of canonical scores of discriminant functions with volatiles aroma compounds. ... 91 Figure 7.28 – Dendogram of cluster analysis obtained with volatiles aroma compounds in the wines ... 94
Abbreviations and symbols
Aanalyte Area of analyte
AIS Area of internal standard
CYA Cyanidine
DEL Delphinidine
Dp-3-glc Delphinidin-3-O-glucoside
GC-FPD Gas Chromatograph - Flame Photometric Detector
GC-MS Gas Chromatograph – Mass Spectrometer
HCA Hierarchical Cluster Analyis
HPLC High Performance Liquid Chromatography
HR-FT-MS High Resolution Fourier Transform Mass
Spectrometer
HS Headspace
IS Internal Standard
LC-MS-DAD Liquid Chromatography Mass Spectrometry Diode
Array Detector
LDA Linear Discriminant Analysis
LLE Liquid Liquid Extraction
LOD Limit of Detection
MAL Malvidine
MS/IT Mass Spectrometry/Ion Trap
Mv-3- p-coumglc Malvidin-3-O-(6-p-coumaroyl)-glucoside Mv-3-glc Malvidin-3-O-glucoside Mv-3-glc-4-vinylcatechol Malvidin-3-O-glucoside-4-vinylcatechol Mv-3-glc-4-vinylphenol Malvidin-3-glucoside-4-vinylphenol Mv-3-p-coumglc-4-vinylcatechol Malvidin-3-(p-coumaroyl)glucoside-4-vinylcatechol Mv-3-p-coumglc-pyruvat Malvidin-3-O-(6-p-coumaroyl)-glucosidepyruvicacid ND Not Detected
PCA Principal Components Analysis
PEO Peonidine
PET Petunidine
Pn-3-glc Peonidin-3-O-glucoside
Pn-3-glc-piruvat Peonidin-3-O-glucoside-pyruvic acid
RI Retention Index
RT Retention Time
SD Standard Deviation
SPE Solid Phase Extraction
SPME Solid Phase Microextraction
1. INTRODUCTION AND
CHARACTERIZATION OF FOGO ISLAND
CAPE VERDE
1.1. CHARACTERIZATION OF CAPE VERDE
The archipelago of Cape Verde is located on the West Coast of Africa at 400 km of westwards of Senegal in the Atlantic Ocean (Olehowski et. al., 2008). It consists of ten islands as shown in figure 1.1 discovered in 1460 during the trips of the Portuguese expansion. The colonization of the islands began in 1462 and until now only nine of the ten islands are inhabited. The total population in the country is around 500 000 inhabitants, with the island of Santiago, the largest, with 200 000 inhabitants. The predominant economic activities in the different islands is distributed in agriculture, livestock, fisheries and tourism.
Figure 1.1 - Map of Cape Verde in the Atlantic Ocean
11.2. CHARACTERIZATION OF FOGO ISLAND
The island of Fogo, the fourth biggest island, is roughly circular, as shown in figure 1.2 with a surface area of 476 km2 (Olehowski et. al., 2008). The island is of volcanic origin
and it resembles a volcano. Because of the altitude of the volcano, the Peak of Fogo Island is the central cone of the volcano and is the highest point in the country with 2829 meters.
1 Available in the web page < http://www.nationsonline.org/oneworld/map/cape-verde-map2.htm> last
The climate as the other islands is dominated by the trade winds but does not supply moist air masses. Between August and October there are monsoon winds, hot and humid, although with irregular rainfall in these months.
The climate range from tropical to semi-arid and the average annual temperature is 25 °C but in Chã das Caldeiras in the months of December to January the climate can reach below 0 ºC. The humid region (> 600 mm/a) is located in the north-east, and arid region (~ 600 mm/a) are in the southeast of the island but above 1300 meters of altitude there is lower rainfall (Marques et. al., 2014; Mota Gomes, 2006).
Figure 1.2 - Aerial photograph of Fogo Island2.
Agriculture is a dominant practice in this island. The soil consists essentially of volcanic material rich in nutrients which are generally covered by the layer of volcanic slag basaltic gravel of different sizes. The permeability of this material allows the storage of water that enables the development of flora in dry seasons (Leyens, 2002).
1.3. THE VITIVINICULTURE IN FOGO ISLAND - CAPE VERDE
The culture of vines in Cape Verde was started by the first Portuguese settlers during 16th century in the islands of Santo Antão, São Nicolau, Santiago, Brava and Fogo.
Because of the natural conditions of Fogo Island this culture had and still has more success. The first production of the wine at the time were for domestic consumption but in the 18th century, the wine began to be exported to Guinea and Brazil. But those exports
were banned by order of the Marquês de Pombal as well as the cultivation of vines. The cultivation was restarted with some plants that remained on the island and today it continues despite some recent volcanic eruptions in 2015 (Figure 1.3).
The grapes grown are possibly originating from Touriga Nacional and Moscatel de Setubal and they have adapted to the dry climate of Cape Verde.
The regions of Chã das Caldeiras and Mosteiros are the main producers of the vineyard. Especially the region of Chã das Caldeiras located at 1600 meters above sea level, next to a volcano, offers optimal conditions for the cultivation of the vine because there is always fog formation which provides sufficient moisture for the practice of agriculture (Mota Gomes, 2006).
The fertile volcanic soil, rich in minerals, the fluctuation of temperatures between day and night, good sun exposure and brightness favor the development of grapes with good sugar content and aromatic compounds.
Because of the climatic characteristics of the local soil and harvest realised before the rainy season, culture is not subjected to chemical fertilizers and pesticides, unless the treatment against powdery mildew (the vineyard dust) that is made with sulfur collected in the region.
The first wines produced are handmade and fully biological called Manecon. Later with the support of the German Cooperation, Italian Cooperation and the Ministry of Agriculture were introduced modern technologies in the production of wines.
Now there are several producers of wine, Chã, Sodade, Montrond and others, all of the Fogo Island who sell red, white and rosé wines.
The marketing the Fogo Island wine is widespread in the whole of the Cape Verde archipelago and have the perspective of being exported. The trade of this product is one of the important sources of income specifically for Fogo Island farmers of Chã das Caldeiras region. Together with agriculture, tourism has been very important to the economy of this region.
Tourism also has gradually developed making it a good source of revenue. In the last decade it has contributed significantly to the development of the island's economy and some typical products of the island, such as coffee, wine and the presence of the volcano have been an asset for the development of rural tourism (López-Guzmán et. al., 2011).
Combining tourism with the commercialization of typical products of the region contributes to a typical trademark of the island of Fogo. To achieve this objective, it is necessary to accomplish certain quality requirements and even the socio-economic conditions that the country demands.
The ease of access to information, awareness of the population of their rights, tourism development and the adherence of Cape Verde to the World Trade Organization (WTO) in 2008, puts Cape Verde in a larger market with greater competition. These news national and international conditions require producers and Cape Verdean traders
highest demand in terms of quality of its products. So, it is always necessary to make an exhaustive study of any product commercialized in order to ascertain its quality or even to improve it for increased competition.
1.4. OBJECTIVE
This work has the purpose to identify and quantify, in the wines of Fogo Island, the following compounds:
Phenolic compounds;
Sulfur compounds;
Volatiles aroma compounds.
Apply the chemometrics analysis to classify and distinguish the wines according to their concentrations of:
Phenolic compounds;
Sulfur compounds;
2.1. INTRODUCTION TO PHENOLIC COMPOUNDS
Phenolic compounds are secondary plant metabolites which are found in the leaves, seeds, grapes and they are extracted from the wine during the vinification process. The type and concentration of these compounds depend on such factors as the type of grape and its ripening stage, climatic conditions, soil type and winemaking (La Torre et. al., 2006). They are the major components of the wine with a percentage from 30% to 40% among macromolecular compounds present in wine (Gonçalves et. al., 2012).
They come from grapes and other results of chemical and biochemical processes in the production process, especially during fermentation and aging. During production, the must in contact with oxygen causes the oxidation of phenolic compounds causing wine browning. When the maturation is finished, the phenolic oxidation decreases and the concentration of phenolic compounds stabilizes (Andreu-Navarro et. al., 2011).
These compounds have an important role in assessing the quality of the wine since they contribute in defining certain sensory characteristics such as color, flavor, hardness and astringency directly or by combination with other compounds (Kelebek et. al., 2010).
The main phenolic compounds in wine and grapes are divided into two groups, the non-flavonoid and non-flavonoid. Flavonoids are composed of compounds of anthocyanins, flavonols and flavano-3-ols. In non-flavonoids phenolic compounds in wines are mainly hydroxycinnamic acids, hydroxybenzoic acids and volatile phenols such as stilbene (resveratrol) (Kelebek et al., 2010).
2.1.1.
Anthocyanins
Anthocyanins are water-soluble pigments responsible for the red, blue and purple color of most flowers, grapes and young wine (Košir et al., 2004; Monagas et. al., 2007). Their molecular structures derived from glycosylated 3,5,7,3′-tetrahydroxyflavylium cation which is represented in the figure 2.1 (Košir et al., 2004; Ribéreau-Gayon et.al., 2006).
The molecule of anthocyanin is constituted from an aglycone or anthocyanidin moiety which is glycosylated by one or more sugars in its natural state. The most prevalent sugars are D-glucose, L-rhamnose, D-galactose, D-xylose and arabinose and they usually link at carbons 3, 5, 7, 3’ and 5’. The difference between aglycone are the number of hydroxyl groups and the degree of methylation of those groups (Košir et al., 2004).
3'' 4'' 2'' 5'' 1'' O H H H H OH O H 6'' OH O H H H 8a 4a 8 5 7 6 2 3 O+ 1 4 O H OH O 1' 4' 3' 5' 2' 6' OH R2 R1 H H H H H
Figure 2.1 - Molecular structure of monoglucoside anthocyanin.
The glycosylated part can form esters with acetic, p-coumaric, caffeic, ferulic or sinapic acids and sometimes with p-hydroxybenzoic and malonic acids (Košir et. al., 2004). In the wines and grapes were identified five free anthocyanins of malvidine (MAL), cyanidine (CYA), delphinidine (DEL), petunidine (PET) and peonidine (PEO). Their formulas are represented in table 2.1 (Ribéreau-Gayon et. al., 2006).
Table 2.1 - Substituents and the respective anthocyanins Substituents Aglycone R1 R2 OH H Cyanidine OCH3 H Peonidine OH OH Delphinidine OH OCH3 Petunidine
OCH3 OCH3 Malvidine
In the wines and Vitisvinifera grapes species only monoglucoside anthocyanins (fig. 2.2) and acylated monoglucoside anthocyanins (fig. 2.3) were identified (Ribéreau-Gayon et. al., 2006).
Figure 2.2 - Molecular structure of anthocyanin-3-monoglucoside.
CH CH O O 4'' 5'' O 1'' 2'' 3'' OH O H O H CH2 6'' 2 3 O+ 1 O H OH O 1' 4' 3' 5' 2' 6' OH R5 R3 O H
Figure 2.3 - Molecular structure of anthocynin-3-monoglucoside acylated by p-coumaric acid in carbon 5''.
(Ribéreau-Gayon et. al., 2006)
4'' 5'' O 1'' 2'' 3'' OH O H O H HOH2C 6'' 2 3 O+ 1 O H OH O 1' 4' 3' 5' 2' 6' OH R2 R1
The structure of anthocyanins is pH dependent. Below pH 3.2 there are two indistinct interconvertible forms, the red flavilium cation and the blue quinoidal. At pH 1.5 ninety-six percent of anthocyanins are in the flavilium cation and to pH 2.5 ninety-sixty-seven percent in the flavilium cation. Above pH 2 there are several peak broadening because the slow interconversion between species (Košir et. al., 2004). This variation with pH is represented in figure 2.4 with species Vitis vinifera in wine.
Gl – glucose
Chalcone nearly colorless
Carbinol base colorless
-H+
+H2SO3,-H+
Quinoidal base violet
Flavilium ion red
Flavene sulfonate colorless
Figure 2.4 - Structure and equilibria of the anthocyanins present in Vitis vinifera species in wine with pH OH OGl OH O H R1 R2 OH O O OH OGl OH O H R1 R2 O H O OH OGl OH O R1 R2 O+ OH OGl OH O H R1 R2 O OH OGl OH O H R1 R2 SO3H
2.1.2.
Flavonols.
Flavonols are a subclass of flavonoids, the most common are quercetin, kaempferol, myricetin and isorhamnetin or quercetin-3-methylether (Makris et. al., 2006; Silva et. al., 2012). Their color vary from white to yellow and the molecular structure are presented in figures 2.5 to 2.8 (Makris et. al., 2006).
O OH OH O H OH O
Figure 2.5 - Molecular structure of kaempferol.
O OH OH O H OH O OH
Figure 2.6 - Molecular structure of quercetin.
O OH OH O H OH O OH OH
O OH OH O H OH O OMe
Figure 2.8 - Molecular structure of isohramnetin.
In grapes, the flavonols molecules are presented mainly in monoglycoside form in which molecules sugar are linked to hydroxyl group in the carbon 3 of the O-containing ring but the substitution can happen in other position. These flavonols glycosides of myricetin, quercetin and kaempferol form co-pigment with the anthocyanins in red wines and with oxidation products of tanins they are responsible for the color of white wines and grapes (Makris et al., 2006).
The basic structure rings and with the convention labelling is presented in figure 2.9 (Makris et. al., 2006).
8 5 7 6 2 3 O 4 4' 5' 3' 6' 2' O OH A C B
Figure 2.9 - Basic ring structure of flavonols and convention labelling.
Currently there is much interest in the study of flavonols because of its antioxidant potential, anti-inflammatory, anti-allergic, hepatoprotective, anti-viral, anti-carcinogenic (Silva et. al., 2012).
2.1.3.
Flavan-3-ols
The flavan-3-ols are compounds that play an important role in defining the characteristics of wines. They are extracted from grapes skins and seeds during the winemaking process. During this process structural transformation takes place through oxidation and condensation reactions with influence on wine astringency and color (González-Manzano et. al., 2004). They interact with anthocyanins to form co-pigment which help to stabilize the color of red wine and formation of new pigment during wine aging (González-Manzano et al., 2004).
The basic unit of flavan-3-ols are catechin, epicatechin and their isomers present in the figures 2.10 and 2.11, and the nomenclature present in the tables 2.2 and 2.3. These molecules have two benzene cycle bonded by a saturated oxygenated heterocycle. The structure has two asymmetrical carbons (C2 and C3) that are the origin of the isomers (Ribéreau-Gayon et al., 2006). 8 5 7 6 2 3 O 4 4' 5' 3' 6' 2' 1' OR'' OH O H OH OH R'
Figure 2.10 - Molecular structure of catechin series.
Table 2.2 - Nomenclature of catechin
R’ R’’ Catechin
H H (+) – catechin (2R,3S)
H H (–) – catechin (2S,3R)
OH H gallocatechin
8 5 7 6 2 3 O 4 4' 5' 3' 6' 2' 1' OR'' OH O H OH OH R'
Figure 2.11 - Molecular structure of epicatechin series.
Table 2.3 - Nomenclature of epicatechin
R’ R’’ Epicatechin
H H (+) – epicatechin (2S,3S)
H H (-) – epicatechin a (2R,3R)
OH H epigallocatechin
The flavano-3-ols can exist as monomers or polymers called proanthocyanidins or condensed tannins. These when heated in strongly acidic medium release anthocyanidins. The structure of proanthocyanidins varies with its sub-unit constituent, the degree of polymerization and the connection position. Figure 2.12 represents the general structure of a proanthocyanidin in which flavano-3-ols monomers are linked through carbon-carbon 4 and 8 or 4 and 6 (Lorrain et. al., 2013; Ribéreau-Gayon et. al., 2006).
8 5 7 6 2 3 O 4 4' 5' 3' 6' 2' 1' OH OH O H OH OH R 8 5 7 6 2 3 O 4 4' 5' 3' 6' 2' 1' OH OH O H OH OH R 8 5 7 6 2 3 O 4 4' 5' 3' 6' 2' 1' O H OH OH O H O H R 8 5 7 6 2 3 O 4 4' 5' 3' 6' 2' 1' OH OH O H OH OH R
2.1.4.
Benzoic, cinamic acids and derivates
The phenolic compounds no-flavonoids in wine are essentially derived from benzoic acid, cinnamic acid and volatile phenols including the stilbene (resveratrol). Their structures are elucidated in the figures 2.13 a) and b) and the derivatives are presented in table 2.4 (Ribéreau-Gayon et. al., 2006).
a) b)
Figure 2.13 - Molecular structure of a) benzoic acid and b) cinammic acid.
Table 2.4 - Nomenclature of phenolic acids present in grapes and wines.
Benzoic acid R1 R2 R3 R4 Cinammic acid
p-Hydroxybenzoic
acid
H H OH H p-Coumaric acid
Protocatechuic acid H OH OH H Caffeic acid
Vanilic acid H OCH3 OH H Ferulic acid
Gallic acid H OH OH OH
Syringic acid H OCH3 OH OCH3 Sinapic acid
Salicylic acid OH H H H Gentisic acid OH H H OH COOH R1 R2 R3 R4 R1 R2 R3 R4 COOH
2.1.5.
Stilbenes – Resveratrol.
The stilbenes, particularly resveratrol, have been studied in recent years because of the benefits of those compounds may have on human health. They are biosynthesized in grapevines in defense of fungal diseases such as Botrytis cinerea, abiotic stress and UV irradiation (Kostadinović et al., 2012). Resveratrol can occur in two isomeric forms, cis and trans, as shown in figure 2.14 a) and b).
2 1 3 6 4 5 1' 3' 4' 2' 5' 6' OH O H O H 2 1 3 6 4 5 1' 3' 4' 2' 5' 6' OH O H OH a) b)
Figure 2.14 - Molecular structure of a) cis and b) trans-3,5,4'-trihidroxystilbene (resveratrol) (Wu, et. al., 2013).
3.1. INTRODUCTION TO SULFUR COMPOUNDS IN WINES
The sulfur compounds are parts of a large group of compounds which affect the sensorial quality of the wines. The majority contributes to unpleasant characteristic in wines but there are other like mercapto-1-hexanol, 4-mercapto-4-methyl-2-pentanone, 3-mercaptohexyl acetate, 3-mercapto-3-methyl-1-butanol which have a great impact (Capone et. al., 2011; Moreira et. al., 2010; Ribéreau-Gayon et al., 2006). The threshold values of these compounds are very low, producing strong olfactory impact in wines even if the concentration are low (Mestres et. al., 2000). There are many kinds of sulfur aroma in wine, pleasant like passion fruits, grapefruits and coffee; and unpleasant like rotten eggs, onion, garlic, which indicated bad storage conditions or a deficient production process (Capone et. al., 2011; Mestres et. al., 2000; Mora et. al., 1986).
The sulfur compounds can be classified by molecular structure in thiols, sulfides, polysulfides and heterocycle compounds. In wine, they are split in two groups according with their volatilities: the volatiles or light sulfur compounds, those with boiling point below 90 ºC and the less volatiles or high sulfur compounds with boiling point above 90ºC (Mestres et. al., 2000). The volatiles have low perception values but because their volatility can be eliminated by aeration, racking or by a copper treatment (Moreira et. al., 2004). Otherwise, the high sulfur cannot be eliminated by an easy process remaining in the products therefore affecting the wine quality.
The sulfur compound’s formation mechanism it is not very understood, but some authors suggest the formation by two processes involving the enzymatic and non-enzymatic process. The enzymatic process results from sulfur-containing amino acids degradation like methionine and cysteine; metabolism of pesticides and formation of fermentation products. The non-enzymatic involves chemical, photochemical and thermal reaction during winemaking and storage (Berger & Media, 2007; Fedrizzi et. al., 2007; Landaud et. al., 2008; Mestres et. al., 2000). The figure 3.1 is an explanation of the sulfur compound’s mechanism formation with methionine (Landaud et. al., 2008; Moreira et. al., 2008; Wang et. al., 2003).
There are many heavy sulfur compounds identified in wine with different odor, including 2-mercaptoethanol (boxer, farmyard, poultry smell), methylthioethanol (french bean aroma), 3-methylthio-1-propanol (methionol) (potato, soap, cauliflower, cooked cabbage aroma), 4-methylthio-1-butanol (onion, garlic, earthy aroma), 2-methyltetrahydrothiophen-3-one (metallic, natural gas aroma),
cis-2-methyltetrahydrothiophen-3-ol (odorless), trans-2-cis-2-methyltetrahydrothiophen-3-ol (onion, chive-garlic odor) benzothiazol (rubber odor), 3-methylthiopropionic acid (butter, rancid odor) and dimethylsulphone (odorless) (Mestres et. al., 2000; Landaud et. al., 2008; Moreira et. al., 2010).
On the other side, there are sulfur compounds with pleasant odor like 3-mercapto-1-hexanol (grapefruit flavor, passion fruit), 3-mercaptohexyl acetate (boxwood, passion fruit), 4-mercapto-4-methyl-1-butanol (citrus zest) identified in Sauvignon blanc wines (Capone et. al., 2011; Moreira et al., 2010; Ribéreau-Gayon et. al., 2006).
In the tables 3.1 and 3.2 are presented the molecular structure of heavy sulfur compounds, their odor, threshold values and concentration founds in wines.
Table 3.1 - Molecular structure of heavy sulfur compounds in wines
Sulfur compounds
Molecular structure
S-Ethylthioacetate S O
2-Mercaptoethanol HO SH 2-Methyltetrahydrothiophen-3-one S O CH3 3-Methylthio-1-propanol H3C S O H 2-Methylthioethanol H C 3 S OH Ethyl-3-methylthiopropionate H3C S O CH3 O 3-(Methylthio)propyl acetate H3C S O CH3 O 3-Mercapto-1-propanol HS OH Dimethyl sulfone H3C S CH3 O O Benzothiazole N S 4-Methylthio-1-butanol H C 3 S OH 3-Methylthio-1-propionic acid S OH O (Mestres et. al.,2000)
Table 3.2 - Odor, threshold values and concentration of heavy sulfur compounds in wines
Sulfur compound Odor/flavour
Threshold values (µg.L-1)
Wine concentration
(µg.L-1)
2-Mercaptoethanol Box tree, poultry, farmyard, burnt rubber
600 in red wine 450 in white wine
ND - 400 2-Methyltetrahydrothiophen-3-one Metallic, natural gas,
butane-like 250 in red wine 150 in white wine 14.8 - 237 3-Methylthio-1-propanol (Methionol) Cooked potato, cauliflower, cabbage 3200 in red wine 4500 in white wine 224 - 5655 2-(Methylthio)ethanol French been, cauliflower 640 in red wine
800 in white wine
25 - 98 Ethyl-3-methylthiopropionate Sulfurous, metallic 300 - 1000 wine 0 - 10 3-(Methylthio)propyl acetate Mushroom, onion, garlic 115 in red whine
100 in white wine
0 - 17 3-Mercapto-1-propanol Sweat odor, roasted,
potato, broth
60 in model solution * Dimethyl sulfone Odorless - - Benzothiazole Rubber - 0 - 6 4-Methylthiobutanol Metallic-bitter, grassy,
onion, chive-garlic
80 in wine 100–1000 in hydroalcoholic solution
ND - 181 3-Methylthio-1-propionic acid Chocolate, roasted,
butter, rancid
50 in model solution; 244 in red wine
1 - 140
ND – not detected;
4. VOLATILES AROMA COMPOUNDS IN
WINES
4.1. INTRODUCTION TO VOLATILES AROMA COMPOUNDS IN WINES
Wine volatiles comprise several compounds of different chemical classes with a large range of concentration between ng.L-1 to mg.L-1. Several volatiles compounds such as
alcohols, terpenes, hydrocarbons, esters, ketones, acids, aldehydes, ethers, sulfur, nitrogen and lactones were identified in wines (Barros et. al., 2012). They play a very important role in wine flavor which depends on the correlation between chemical composition and perception threshold since many volatiles compounds have a concentration below of their sensory threshold (Vilanova & Sieiro, 2006). Many of these compound confer a floral, fruity and citrus attributes to wines which is very important to wine qualities (Ugliano & Henschke, 2009).
4.1.1.
Terpenes
Terpenes belong to important class of volatiles compounds in wine because of their high concentration and low aroma threshold (Vilanova & Sieiro, 2006). They are from grape, also formed during maturation and influenced by the characteristics of soil, climate and viticulture processes (Michlmayr et. al., 2012; Vilanova & Sieiro, 2006).
The most predominant monoterpenes in white wine Muscatel are linalool, geraniol, nerol, α-terpeniol, β-citronellol and hotrienol (Dziadas & Jeleń, 2010; Mateo & Jiménez, 2000; Rocha et. al., 2007; Takoi et. al., 2010). Typical floral aroma of these compounds are rose-like (geraniol, nerol), coriander (linalool), camphoraceous (linalool oxides) and green (nerol oxides) (Marais, 1983; Rocha et. al., 2007). Monoterpenes can occur in wine and grapes in free form or bound with sugar as glycosides and these glycosides form are the more abundant (Dziadas & Jeleń, 2010; Mateo & Jiménez, 2000).
Figure 4.1 - Molecular structure of monoterpenes in wines Muscat
geraniol nerol β-citrolleol
α-terpeniol linalool hotrienol O H O H O H O H O H O H (Takoi et al., 2010).
4.1.2.
Nor-isoprenoids
Nor-isoprenoids are substances formed by degradation of carotenoid such as β-carotene, lutein, neoxanthin and violaxanthin, released by hydrolysis of glycosides molecules during winemaking or aging processes (Silva Ferreira & Guedes de Pinho, 2004; Vinholes et. al., 2009). The nor-isoprenoids compounds identified in wines were β-damascenone, β-ionone, 1,1,6-trimethyl-1,2-dihydronaphthalene (TDN) and vitispirane (Fig. 4.2) (Silva Ferreira & Guedes de Pinho, 2004). Like so many others volatiles compounds, these compounds have an important role in sensorial wine aroma because of their low olfactory perception threshold and a pleasant odor descriptor related to tea, violet, exotic flowers, stewed apple, eucalyptus and camphor (Mendes-Pinto, 2009; Vinholes et. al., 2009).
β-ionone TDN β-damascenone vitispirane CH3 C H3 CH3 CH3 O CH3 C H3 CH3 CH3 O CH3 C H3 CH3 O
4.1.2.
Esters
Esters are very common in wines, they are formed in wine by two ways, enzymic esterification during fermentation and chemical esterification during aging steps (Ribéreau-Gayon et. al., 2006). Ethyl esters like acetates are formed enzymically during fermentation and are very important wine aroma (Roussis et. al., 2005). Because of their fruity fragrance, many esters are denominated “fruity esters” principally those who have low molecular weight. Others like ethyl esters of hexanoic, octanoic and decanoic acids, isoamyl acetate and isobutyl acetates are often considered to give wine much of its vinous fragrance (Roussis et. al., 2005).
In the table 4.1 are presented some esters and others volatile compounds with their odor characteristics (Vilanova et. al., 2010).
Table 4.1 - Characteristics of some volatile compounds in wine
Volatile compounds Odor descriptor Odor threshold/ µg.L-1 Alcohols
1-propanol - 750000
2-methyl-1-propanol Álcohol, banana, solvent
65000 1-butanol Álcohol, fusel 150000
3-methyl-1-pentanol - -
2-phenylethanol Rose, sweetish 10000 1-Hexanol Vegetable, grass 800
Ethyl esters
Ethyl butyrate Papaya, sweetish, butter
20 Ethyl 2-methylbutyrate Fruity 18 Ethyl 3-methylbutyrate Fruity, apple 3 Ethyl hexanoate Fruity, apple, sweetish 14 Ethyl lactate Strawberry, raspberry 154700 Ethyl octanoate Fruity, apple 5 Ethyl decanoate Fruity, apple, solvent 200
Acetates
3-Methylbutyl acetate Banana, apple, estery 30 Hexyl acetate Sweetish, perfumed 670 2-Phenylethyl acetate Rode, honey, tobacco 250
Volatile fatty acids
2 + 3-methylbutyrate Cheese, oldhops, sweaty
34 Butyric acid Rancid, cheese 173 Hexanoic acid Geranium, vegetable 30 Octanoic acid Sweat, cheese 500 Decanoic acid Rancid, fat 1000 Dodecanoic acid Soapy, waxy 6100
Monoterpenes
Linalool Flower, lavander 25 α-terpineol Pine, lily of the valley 250
Citronelol Green lemon 100
Nerol Rose, lime 400
2010)
Chemometric analysis is an important tool when we have results with many samples and variables, from them extract significant and useful information. This allows to simplify the results and facilitate its analyses. The field of application is very wide, as example, signal processing, experimental design, optimization, data mining, multivariate calibration and classification (Moncayo et. al., 2015).
Rergading classification methods, the chemometric analysis comprises several statistic methods which can be grouped in unsupervised and supervised methods. In unsupervised methods there are no prior assumed classification model over the data in a matrix, while in supervised methods are defined by two data sets, objects (input) and classes (target) (Moncayo et. al., 2015). In unsupervised methods the sample gives the algorithm without information that belong to any class, but in supervised methods, data training samples and to perform the models and output of cases, are used training samples (Martelo-Vidal & Vázquez, 2014).
In unsupervised chemometric methods, the Principal Component Analysis (PCA) and Hierarchical Cluster Analysis (HCA) are the most popular methods (Jiang et. al., 2015; Yi et. al., 2015; Zhao et. al., 2014). The Linear Discriminant Analysis (LDA) is one of supervised method of classification (Azcarate et. al., 2013; Zhao et. al., 2014).
These methods try to discovery a relationship between classes and objects, referred as a model, which represents a set of features that define the classification process. The membership of new objects (unknowns for the models) is predicted on the basis of their similiarity to a certain class in the model (Moncayo et. al., 2015).
In the wines, there are many studies using chemometrics methods like PCA, LDA, HCA to distinguish or to classify wines from diferent regions or grapes varieties (Versari et. al, 2014).
5.1. PRINCIPAL COMPONENTS ANALYSIS (PCA)
The PCA attempted to reduce the dimensions of an initial multivariate dataset to a smaller number of uncorrelated variables with the maximized variances, that permits the analysis of a dataset using the most important variables. Its not useful for discriminating classes as it just provides an overview of the overall data without taking into account the class information to build the model. Its usually coupled with other chemometrics
methods (LDA, SIMCA, etc) in order to achieve a classification model (De Andrade, Do Nascimento, Pereira, Hallwass & Paim, 2013).
PCA involves a transformation of the data represented in the follow equation:
= +
Where is the original data matrix of dimension I x J. I is objects and J variables. The individual variables (columns) of are denoted by and are all vector in the I-dimensional space (Moncayo et al., 2015).
A linear combination of those variables can be written as = + + where are the weight of variables. is score matrix with dimension I x A, where A is the number of principal components (PC) considered. is the loading matrix with A x J dimension, where each vector contains the regression coefficient. represent the matrix of residuals. The principal component is defined for the pair of eigenvector and
(Moncayo et al., 2015).
5.2. LINEAR DISCRIMINANT ANALYSIS (LDA)
LDA classification model is created on the basis of the estimation of several discriminant functions, which are linear combinations of the original variables, minimizing the variances within-class and maximizing the variance between classes :
= ( )( )
∈
= ( )( )
Where and are the number of classes and the number of training objects for each classes, is each class object, is the means for each class and is the total mean vector. The model takes into account different variances of each variable and also the correlation between variables. The prediction results for the validation set is obtained projecting each unknown object on the discriminant functions and these are always assigned to a single class according to the minimal distance to the centroid of each class (Moncayo et al., 2015).
5.3. HIERARCHICAL CLUSTER ANALYSIS (HCA)
HCA is a multivariate approach that aims to identify natural groups or clusters among objects in a dataset, through minimization of the within-cluster variance and maximization of the between cluster variance (Bayo & Lopez-Castellanos, 2016). This method characterizes similarities among samples by examining interpoint distances representing all possible samples pairs in high dimensional space. The sample similarities are represented on two dimensional diagrams call dendograms (Lima et. al., 2010).
The most similar objects are first grouped, and these initial groups are merged according to their similarities. Eventually as the similarity decreases all subgroups are fused into a single cluster. In the single linkage method, the distance or similarities between two clusters A and B is defined as minimum distance between a point A and B (Patras et. al., 2011).
( , ) = , , for in A and in B
6. ANALYSIS OF COMPOUNDS IN WINES
OF FOGO ISLAND
6.1.
ANALYSIS OF PHENOLIC COMPOUNDS IN WINES OF FOGO
ISLAND
6.1.1.
Methods of analysis
High performance liquid chromatography (HPLC) is the main analytical method and linked with mass spectrometry enables an identification of many phenolic compounds in wine. Because of the wine samples complexity and low concentration of phenolic compounds, it is needed an extraction process before injection on HPLC. The most common extraction methods for phenolic compounds in wine are solid phase extraction (SPE) and liquid liquid extraction (LLE) (Marquez et. al., 2012).
6.1.2.
Chemicals and materials
The compounds used in the study were (CAS number in brackets) malvidin-3-O-glucoside chloride (7228-78-6), (±)-catechin trihydrate (7295-85-4), t-ferulic acid (537-98-4, Aldrich), p-coumaric acid (501-(537-98-4, Sigma), gallic acid monohydrate (5995-86-8, Sigma-Aldrich), trihydrate caffeic acid (331-39-5), syringic acid (530-57-4), vanilic acid (121-34-6) and quercetin (117-39-5), all purchased from Sigma-Aldrich and Janssen Chimica. The solvent used were acetonitrile, ethyl acetate, deionized water, formic acid and methanol. All standard and solvent used were analytical grade. The SPE Supelclean cartridge LC-18 6 mL was purchased from Sigma-Aldridge.
6.1.3.
Preparation of standard solutions
The standard solution was prepared dissolving individuals weighted standard in methanol at 1000 mg.L-1 of concentration. The standard solution was protected from light
and maintained at -10ºC. The works solutions were prepared in 12% hydroalcoholic standard solution with 3.5 g.L-1 of tartaric acid and pH 3.5 adjusted with NaOH 0.1 M.
6.1.4.
Samples
The wines samples were Chã (white and red), Montrond (white and red), Sodade (white, red and rose) and Sangue de Vulcão. All wines were from Fogo Island and each one was randomly chosen three samples. The samples analysed were from different producers but all from the same Island.
6.1.5.
Procedure
6.1.5.1. Anthocyanins extraction by Solid Phase Extraction
The anthocyanins extraction from wine by SPE was done with Supelclean LC-18 6 mL cartridge according to the method proposed by Marquez et. al. (2012). A volume of 3 mL of wine was passed through a cartridge that was previously activated with 5 mL of methanol and washed with 7 mL aqueous 0.01% (v/v) HCl solution. The cartridge was successively washed with 10 mL of HCl 0.01% (v/v) and 5 mL ethyl acetate and the anthocyanins were recovered with 2.5 mL of methanol acidified to pH 2 with HCl. The anthocyanins samples were concentrated to 500 µL with nitrogen steam.
6.1.5.2. Non-anthocyanic compounds extraction by Liquid Liquid
Extraction
The extraction of non-anthocyanics compounds was done according to the method proposed by Porgali & Büyüktuncel (2012). A volume of 5 mL was placed in Corning tube and 5 mL of ethyl acetate was added. The mixture was agitated for 5 minutes and the two phases, aqueous and organic phase, were separated by MIKRO centrifugater for 1 minute at 3000 rpm. Then 4,5 ml of organic phase was removed and the ethyl acetate was evaporated by nitrogen steam. The volume was adjusted to 500 µL with methanol solution.
6.1.6.
Liquid chromatography mass spectrometry diode array
detector conditions
The phenolic compounds were analysed in LC-MS-DAD. A Hypersil Gold C18 (250 x 4.6 mm, 5 µm) column was used and the eluents were A (99% H2O: 1% HCO2H) and B
(80% CH3CN: 19% H2O: 1% HCO2H). The gradient elution was 0-14 min, 8% B, 30 min,
8-20 %B, 16 min, 20-30% B, 20 min, 30-40% B, 10 min, 40-50% B and 10 min, 50-80% B. The detector is Thermo Fischer Scientific LTQ Orbitrap with an electrospray ion source and a high resolution fourier transform mass spectrometer (HR-FT-MS). The voltage on the electrospray needle was 3 kV and the capillary temperature 190 ºC. Full scan spectra were recorded over the range m/z 100-1000 in positive mode to anthocyanins and negative mode to other compounds. The data were processed by X-calibur software.
6.2. ANALYSIS OF HEAVY SULFUR COMPOUNDS IN WINE
6.2.1.
Method of analysis
The analysis of sulfur compounds in wine was carried out by gas chromatography with flame photometric detector (GC-FPD). The method applied was proposed by Moreira et. al. (2004) with liquid liquid extraction and analysis by GC-FPD. This detector has a particularity and an advantage of detecting only sulfur compounds in the samples.
6.2.2.
Chemicals and materials
The sulfur standard studied were (CAS Number in bracket) S-ethylthioacetate (625-60-5), 2-mercaptoethanol (60-4-2), 2-(methylthio)-ethanol (5271-38-(625-60-5), benzothiazole (95-16-9), dimethyl sulfone (67-71-0), 4-(methylthio)-1-butanol (20582-85-8), 3-(methylthio)-1-propanol (505-10-2), 3-mercapto-1-propanol (19721-22-3), ethyl-(methylthio)propionate (3047-32-3),2-methyltetrahydrothiophen-one (13679-85-1), 3-methylthio-1-propionic acid (646-05-01), 3-ethylthio-1-propanol (18721-61-4) and ethyl(methylthio)acetate (4455-13-4) (internal standard, IS) were purchased from Sigma-Aldrich and Lancaster. The cis and trans-2-methyltetrahydrothiophen-3-ol were prepared by reduction of 2-methyltetrahydrothiophen-3-one. The solvents used, dichloromethane, ethanol and water were all products with analytical grade.
6.2.3.
Samples
The wine samples were Chã wine (white and red), Sodade wine (white, red and rosé), Montrond wine (white and red) and Sangue Vulcão wine (red). The samples analysed were from different producers but all from the same Island.
6.2.4.
Preparation of standard solutions
Fifty milliliter of stock solution of each standard was prepared in ethanol at 1g.L-1 of
concentration. One hundred ml of mix work solution was prepared in ethanol at 1mg.L-1
by dilution of stock solution. The internal standard solution, ethyl(methylthio)acetate, was prepared in 50 mL of hydroalcoholic solution of water/ethanol 12% (v/v) at 10 mg.L-1.
The calibration solutions were made with 12% hydroalcoholic standard solution, 3.5g.L -1 of tartaric acid and pH 3.5 adjusted with NaOH 0.1 M.
6.2.5.
Liquid liquid extraction
The internal standard was added to 50 mL of wine sample or standard solution at 30 µg.L-1. Four grams of anhydrous sodium sulphate was added to the samples and
extracted twice with 5 mL of dichloromethane for 5 min. The organic phases were mixed and 2 mL of extract was concentrated to 1/10 under nitrogen flow. Two microliters of concentrated extract were injected into the chromatograph.
6.2.6.
GC-FPD conditions
Analyses were carried out on a Hewlett-Packard (HP) 5890 gas chromatograph, equipped with a ame photometric detector (FPD), and the HP Chemstation software was used. The FPD used an interference lter set at 394 nm. The extract was injected in the splitless mode for 0.3 min, into a CP-WAX 58(FFAP)-CB column (Chrompack) of 30 m × 0.32 mm and 0.2 µm phase thickness. The oven temperature programme start at 50 ºC to 220 ºC (40 min) at 2 ºC.min-1. The injector and detector temperatures were
250 ºC. The carrier gas used was hydrogen at 1–2 mL.min-1. The FPD used hydrogen at
90 mL.min-1, air at 100 mL.min-1 and make up gas (nitrogen) at 20 mL.min-1.
6.2.7.
Calibration curve and limit of detection
The FPD response is a power function between peak area and concentration. Since the response for all sulfur compounds was nearly quadratic, the Hubaux-Vous limit detection was applied (Catalan et. al., 2006). The graph was plotted by square root of ratio between peak area of analyte with internal standard, (Aanalyte/AIS)1/2, versus concentration and the
determination coefficient were good for all compounds. The limit of detection (LOD) was expressed as 3.3SD/S, S, is the slope of the calibration curve and SD is the standard deviation of the response estimated by standard deviation of y-intercept of regression line (ICH, 2005). The calibration curve was evaluated by coefficient of determination R2.
6.3. ANALYSIS OF VOLATILES COMPOUNDS IN WINE
6.3.1.
Method of analysis
The analysis of all volatile compounds in wine was made by HS-SPME-GC-MS/IT, headspace solid phase microextraction and gas chromatography with mass spectrometry/ ion trap, a method optimized by Barros et. al. (2012). All calibration curve parameters were set up by Barros et. al. (2012).
6.3.2.
Materials and chemicals
The volatile compounds studied were (CAS number in brackets): limonene (5989-54-8, Fluka), cis-linalool oxide (5989-33-3, Fluka), terpinolene (586-62-9, Aldrich), β-linalool (78-70-6, Sigma), β-terpineol (138-87-4, Sigma), α-terpineol (98-55-5, Sigma), nerol (106-25-2, Aldrich), geraniol (106-24-1, Sigma), α-ionone (6901-97-9, Aldrich), neryl acetate (141-12-8, Aldrich), β-ionone (6901-97-9, Aldrich), nerolidol (7212-44-4, Aldrich), ethyl butanoate (105-54-4, Merck), ethyl hexanoate (123-66-0,Sigma), hexyl acetate (142-92-7, Merck), diethyl succinate (123-25-1, Merck), ethyl octanoate (106-32-2, Merck), phenylethyl acetate (103-45-7, Merck) and phenylethyl alcohol (60-12-8, Sigma). A hydrocarbon mixture C6–C20 was obtained from Fluka. NaCl and NaOH were
purchased from Merck. The SPME fiber used was
divinylbenzene/carboxen/polydimethylsiloxane 50/30 μm (DVB/CAR/PDMS) purchased from Supelco.
6.3.3.
Samples wine
The samples wine from Cape Verde were Chã (red and white), Sodade (red, white and rose), Montrond (red and white) and Sangue de Vulcão (red).
6.3.4.
Chromatographic conditions
GC-IT/MS analysis were performed on a Varian CP-3800 gas chromatograph (USA) equipped with a Varian Saturn 4000 ion trap mass detector (USA), a Saturn GC-IT/MS workstation software version 6.8, a Combi-PAL autosampler (Varian Pal Autosampler, Switzerland) and the Cycle Composer software (CTC Analytics System Software, Switzerland). Chromatographic separation was achieved using a capillary column VF-5 ms (30 m x 0.2VF-5 mm x 0.2VF-5 μm) from Varian and a high purity helium C-60 (Gasin, Portugal) as carrier gas at a constant flow of 1.0 mL.min 1, in splitless injection mode.
An initial oven temperature of 40 °C was held for 1 min, and then increased 5 °C.min1 to
250 °C (5 min) followed to increase 5 °C.min 1 to 300 °C (10 min). The ion trap detector
was set as follow: the transfer line, manifold, and trap temperatures were 280 °C, 50 °C and 180 °C, respectively. All mass spectra were acquired in the electron impact (EI). The mass range was 35–600 m/z, with a scan rate of 6 scan.s 1. The emission current was
50 μA, and the electron multiplier was set in relative mode to auto-tune procedure. The analysis was performed in full scan mode (Barros et. al., 2012).
6.3.5.
Procedure
Before the analysis the fiber was conditioned according to the manufacturer recommendation. Five millimeter of wine sample or standard was put in a vial of 20 ml with 0.5 g of NaCl. The wine sample was stirring at 250 rpm for 5 min at 45 ºC. Then the fiber was exposed to the headspace at 45 ºC for 20 min, under continuous stirring (250 rpm). The desorption time into GC injector was 2 min at 230 ºC.
6.4. STATISTICAL ANALYSIS
For all result, Tukey test was carried out with PAST software to verify statistically significant differences among mean values. The level of significance in the Tukey test was α = 0.05. All chemometrics analyses and graphics presented were carried out with SPSS version 20 software.
7. PRESENTATION AND DISCUSSION OF
RESULTS
7.1.
PRESENTATION OF RESULTS FOR PHENOLIC COMPOUNDS
7.1.1. Calibration curves of standard solutions
The results for chromatogram of a standard mix solution are presented in the table 7.1 with the retention time, RT, and their wavelength absorption.
To each phenolic compound standard, calibration curve was determined by linear regression and the limit of detection (LOD) was estimated with the method proposed by ICH (2005). The LOD was expressed by 3.3*SD/S, S, is the slope of the calibration curve and SD is the standard deviation of the response estimated by standard deviation of y-intercept of regression line. The table 7.1 presents the parameters of calibration curve of standard solutions. The second value of wavelength presented in the table correspond the maximum absorption spectrum.
Table 7.1 - Retention times, wavelength, concentration range, limit of detection, slope and intercept of the linear regression curves for the standard phenolic compounds.
Phenolic Compounds RT /min Wavelenght λ /nm Concentration /mg.L-1 LOD /mg.L-1 R 2 Linear equation Slope (m) Intercept (b) Anthocyanins Malvidin-3-O-glucoside 49.7 277 (526) 0.5 – 50 2.8 0.992 73908 -34990 Non-anthocyanic
Gallic acid monohydrate 10.4 271 1 – 20 1.8 0.992 2333662 -2444644
(+)-catequin 33.3 280 1 – 20 1.5 0.987 8001006 -697892 Vanillic acid 38.1 260 (292) 1 – 30 1.2 0.998 1542217 -964593 Caffeic acid 39.7 269 (323) 0.5 – 30 2.2 0.992 7709937 -62599 Syringic acid 41.7 274 0.5 – 30 1.9 0.993 2340995 975930 p-Coumaric acid 53.0 310 0.5 – 30 2.4 0.989 5828715 -926006 Quercetin 61.4 352 1 – 20 2.0 0.993 8544324 -1298797 Kaempferol-3-O-glucoside 66.6 266 (346) 1 – 20 2.3 0.991 2297963 93301