Nadja Vanessa Rosa Velez
Prevalence and impacts of pollution by plastic debris
along shores of south Portugal and Morocco.
UNIVERSIDADE DO ALGARVE Faculdade de Ciências e Tecnologias
Nadja Vanessa Rosa Velez
Prevalence and impacts of pollution by plastic debris
along shores of south Portugal and Morocco.
Dissertation for Master’s degree in Marine Biology Advisors: Dr. Katy Nicastro (CCMAR) Dr. Gerardo Zardi (CCMAR) UNIVERSIDADE DO ALGARVE Faculdade de Ciências e Tecnologias
2017
“
Prevalence and impacts of pollution by plastic debris
along shores of south Portugal and Morocco.
”
Declaração de autoria de trabalho
Declaro ser a autora deste trabalho, que é original e inédito. Autores e trabalhos consultados estão devidamente citados no texto e constam da listagem de referências incluída.
Nadja Vanessa Rosa Velez ___________________________________ Direitos de cópia © Copyright: Nadja Velez
A Universidade do Algarve tem o direito, perpétuo e sem limites geográficos, de arquivar e publicitar este trabalho através de exemplares impressos reproduzidos em papel ou de forma digital, ou por qualquer outro meio conhecido ou que venha a ser inventado, de o divulgar através de repositórios científicos e de admitir a sua cópia e distribuição com objetivos educacionais ou de investigação, não comerciais, desde que seja dado crédito ao autor e editor.
Acknowledgments
This project might have my voice but is a result from efforts shared by many without who it would never be what it is.
I would like to thank both my supervisors, Katy Nicastro and Gerardo Zardi who were always patient, assertive and supportive, but above all else always kind and gentle . Your incredible support as both researchers and persons has no match to any other person I have met. You inspire me to become a more complete and balanced person. I always refer to both of you as a pair, but each of your unique personalities had an important role to play on this marathon. I wish you the greatest joy on this new adventure of making a person.
Sampling required a lot of sweat from many. I'm thankful to Marcelo, Sarit, Pauline, Marie, Jethro, Oceane, Antoine, Gé Barroca, Pedro Madeira, Vera Pereira, Vânia Afonso, Ricardo, Susana Meireles, who didn't give up on the task of counting the never ending pieces of pottery in Ria Formosa. All of you have a free pass for popcorn at my place. Jethro and Pauline, your support and dedication was uniterable, and those french crepes made the writing process so much tastier. I will miss you and your compost. In both lab and field, thank you so much Rúben for all your help, attention and smart insights. I might still be counting plastic by now without the help and encouragement of all of you.
In particular I am deeply grateful to Carla Lourenço, Zahira and Profesor Brahim who put a lot of effort in aiding me with logistics and sampling of Morocco. Without you and Harissa, this project would have been impossible and I would not know what's a cojac, although I still don't know where Agadir is.
I am grateful for my family, and it sure is a large one to thank for: my sweet grandparents, my mom, my dad, my other mom, my brothers Lea and Jorge, and Cookie, of course. Thank you for the love and all that you have taught me. As always you remind me to be the best of me.
I am equally thankful for my other family. In particular, Sara and Mimo, you are the best, thank you for everything. I can't even describe how much I adore you sisters. You sure know how to "navigate the mayonnaise" with me.
I'm thankful to my cat Lídia. I named you after Ricardo Reis poems and ironica ll y, without you by my side staring at the river of life it would be way less joyful. Sometimes your affection is all the support I need to stand strong. Other times your judgmenta l morning stare is all I need to get out of bed.
Last but not least, Marcelo Gordo, I am so grateful to have you in my life. Your love, kindness and support still surprise me to this day. Your little chaos is just the structure I need. As always, you remind me that flexible and positively buoyant castles are the smarter choice to build in a rather chaotic world. We shall now go explore planet Earth: above and beneath the epilimnion.
I'm thankful for the sponsors of this project, BioNept, for trusting and allowing me to be a part of their team by engaging in this project. Without it my world would be smaller and I would have never had some of you in my life, something for which I am grateful beyond measure.
“If you would be a real seeker after truth, it is necessary that at least once in your life you doubt, as far as possible, all things.”
Abstract
Given the ongoing increase of plastic waste, plastic debris is now considered an emerging pollutant in the marine environment. Around the world, plastics make up the largest portion of marine debris. The presence of big-sized plastic (i.e. macroplast ics; >5mm) in the marine environment represents an ecological and aesthetic concern, with economic repercussions for the tourist industry and a hazard for health and numerous marine-industries. Once in the marine environment, plastic debris is washed ashore wher e they are prone to fragmentation due to the combined photo-oxidative processes and higher temperatures (relatively to cool temperatures of the sea). There is increasing evidence that macroplastics can break down through UV radiation and wave action into small sized plastic particles, known as microplatics (<5mm). Because of their small size, they become bioavailable to organisms throughout the food-web where they can have direct adverse effects by not being digestible, containing harsh chemicals (persistent organic pollutants), and being transported to upper trophic levels. Few and geographically restricted studies on plastic contamination have been carried in southern Europe. Importantly, the incidence and impact of plastic debris targeting large stretches of coastlines and along southern Portugal and Morocco remains largely unknown.
This thesis can be subdivided into two main studies: a large scale and a mesoscale study. Both sets of experiment considered various types of material with a particular foc us on plastic. The general aim of the large scale study was to describe marine debris pollut io n on the beach, particularly plastic debris, along the south of Portugal and Morocco Atlantic coastline. This was done by assessing (a) the debris composition and (b) the prevalence of microplastics in sediment. The overall aim of the mesoscale study was to determine plastic pollution and marine debris within Ria Formosa Natural Park and its temporal variability. This was done by comparing coastal, exposed sites with lagoon beach locations and assessing the seasonal prevalence of the debris composition.
For the large scale study, plastic was the most abundant debris material and most debris had an undifferentiated source. Predominant winds and coast exposure were the factors that best explained the distribution. Filament was the most consistent and abundant type of microplastic across the study. However fragment also contributed substantially at all sites, being predominant at MA, SA, PA and SB sites. Overall, plastic contamina t io n on the form of debris and microplastic is abundantly present throughout the study area but its distribution is not even and lacks a geographical pattern.
For the mesoscale study, exposure and site had a significant effect over debris material composition and source, while seasonality did not. Abundance of debris was very distinct between exposures, with sheltered sites having larger abundance than exposed sites. Debris was most abundant in sheltered PF, and least abundant in exposed PF. Exposed sites were dominated mostly by plastic material while sheltered sites were dominated mostly by ceramic. Sheltered sites were all statistically different while one pair of exposed sites was not statistically different in material composition. Most of the debris had an undifferentiated source across all levels (exposure, site, month). Also, most debris items belonged to smaller size categories (meso or macro) across all sites. On the sheltered side of the lagoon where wave action has less strength there is a potential for higher retention of debris, which would partly explain the disparity in abundance between exposures. In addition, the sheltered sites tend to have house constructions built above the beach, made of ceramic bricks with asbestos roofs (a potentially toxic material). Both materials were present on sheltered sites. This and the similarity between sources of debris and local activities at each site suggest that contamination on the sheltered side of Ria Formosa is highly linked to the land-based activities occurring at each site. Such knowledge suggests that tailormade local strategies for debris mitigation might optimize debris removal and prevention on sheltered sites of Ria Formosa.
Keywords:
Marine debris, Marine litter, Microplastic, Plastic
Resumo
Com o contínuo aumento da produção de plástico, os detritos marinhos são agora considerados um contaminante emergente no ambiente marinho. Por todo o mundo, a maioria dos detrítos marinhos são compostos por plástico. A presença de plásticos grandes (macroplásticos, >5mm) no ambiente marinho representa uma preocupação ecológica e estética, com implicações económicas sérias, tanto a nível de turismo, como outras industrias dependentes do mar, como a pesca.
Uma vez no ambiente marinho, os detrítos marinhos são levados até à praia onde são mais susceptiveis a fragmentar devido aos efeitos combinados de processos foto-oxidativos e temperaturas relativamente altas (comparativamente à temperatura do mar).
Existe evidência que os macroplásticos (>5mm) podem ser degradados em microplásticos (<5mm) através de efeitos combinados como a radiação UV, temperatura e acção mecânica das ondas. Devido ao seu tamanho reduzido, os microplásticos estão disponíveis para organismos de toda a rede trófica, onde podem provocar efeitos adversos por não serem digeríveis (afectando o sistema digestivo, podendo ter efeitos na sobrevivência e capacidade reprodutora de diferentes organismos) e por conterem químicos como os poluentes orgânicos persistentes (POP), afetando o individuo e podendo potencialmente ser transportado para outros níveis tróficos quando o individ uo é predado.
Alguns estudos locais foram feitos previamente em Portugal, e até à data nenhum em Marrocos, pelo que o conhecimento sobre a incidência de plásticos (macroplasticos e microplásticos) continua em grande parte por descobrir.
Os objectivos deste estudo consistem em avaliar a prevalência e o impacto de macro e microplástico nas praias ao longo das costas do Sul de Portugal e Marrocos. Mais especificamente, o estudo foi desenvolvido numa a) escala espacial larga ao longo do sul de portugal e costa Atlântica marroquina, e b) mesoscala, dentro do sistema lagonar costeiro Ria Formosa, no sul de Portugal,.
O debris marinho foi estudado através de um procedimento de amostragem “standing-stock” efectuado mensalmente na Ria Formosa (em 3 locais dentro de dois níveis de exposição na lagoa costeira) e desempenhado com uma só amostragem na costa portuguesa e marroquina. (em 8 locais). A prevalência de microplásticos no sedimento foi tambem feita para o estudo de larga escala onde se avaliou a quantidade e qualidade (categorias) dos microplásticos.
No estudo de larga escala, o padrão de ventos predominantes e a exposição da praia foram os factores que melhor explicaram a variabilidade entre sítios. As categorias de microplásticos mais abundantes foram filamentos e fragmentos. O local com a maior abundância de debris marinho, tanto na análise de “standing-stock” como na análise de microplástico foi RA, com uma diferença de ordens de magnitude comparativamente aos restantes locais amostrados.
Uma vez que não há estudos prévios sobre a contaminação de detrítos marinhos em Marrocos, este estudo pode funcionar como uma primeira avaliação. É de particular interesse porque recentemente o governo marroquino tomou medidas para diminuir a poluição de plástico no país ao limitar o acesso a sacos de plástico.
No estudo de mesoescala, os factores que melhor explicaram a variabilidade entre locais foram a exposição e o tipo de actividades locais. Na exposição interna das ilhas do sistema lagonar costeiro, o material mais abundante foi cerâmica devido à grande presença de peças de tijolo, enquanto que na exposição exterior o material dominante foi plástico. Também presente no interior das ilhas, estavam numerosos fragmentos de amianto, um material tóxico para o ambiente e saúde humana que terá chegado à praia como debris de construção, abrasividade do mar sobre as casas construidas no local, ou como consequência das recentes demolições de construções na Ria Formosa, nomeadamente no local de amostragem Praia de Faro Interior. A diversidade de actividades a ocorrer em cada local de amostragem corresponde à diversidade de tipos de debris encontrados. As actividades que determinaram a predominância de diferentes materiais encontrados foram actividades recreativas na praia (onde plástico de pacotes e pontas de cigarro são encontrados), pesca (onde plásticos de cabos e redes de aquacultura de ostras e de armações para pesca são encontradas), residência/construção de habitação (materiais de construção e materiais utilizados no dia-a-dia tais como molas de roupa). Isto sugere que a maioria das fontes de poluição de debris na zona menos exposta da Ria Formosa são baseadas em terra. Temporalmente, alguns materiais tiveram mais flutuação de abundância que outros, não demonstrando um padrão temporal. Esta variabilidade reforça a importância de ter múltiplos pontos de amostragem num local e de analisar a sazonalidade para ter uma avaliação mais real da verdadeira condição de poluição de debris marinho numa área para evitar subestimação ou sobrestimação de certas categorias e fontes de poluição.
Palavras-chave:
Index 1. Introduction………..………..1 2. Methodology……….………....………7 2.1. Large scale study…...……….……….…..…………..…..………7
2.1.1. Debris………...………...………..7
2.1.2. Microplastic ……….………….…... 8
2.2. Mesoscale study ………...……….…...10
2.3. Data analysis..………...…..……...……11
3. Results………...………..13
3.1. Large scale study……….…………...……..…………...…13
3.1.1. Debris………...…………...…13 3.1.2. Microplastic……..……….………….…………18 3.2. Mesoscale study……….……..…………21 4. Discussion…….………...………...………32 4.1.Large Scale...……….……….…………32 4.2.Mesoscale.……….…………36 5. Conclusions………...…..40 6. References………...…42
List of Figures
Figure 1: Schematic representation of study areas, sampling procedures and frequency of sampling.………...7 Figure 2: Debris sampling procedure. Walking pattern of surveyor while sampling a
transect (A.) and transect disposition on sampling area (B.). Source: A. - adapted from Opfer 2012).……….………..8 Figure 3: Examples of each microplastic category: A. filament, B. fragment, C.
Styrofoam, D. Pellet. ………...……….………..10 Figure 4: Sampling sites distribution in the large scale study. Proportion of each material,
size, source and plastic origin are described by color coded pies per site. ………...………..15 Figure 5: Principal coordinate analysis (PCO) based on a Bray – Curtis simila r it y
resemblance matrix on standardized by total and square root transformed data of debris material composition at each site in the large scale
study.………...16 Figure 6: Principal coordinate analysis (PCO) based on a Bray – Curtis simila r it y
resemblance matrix on standardized by total and square root transformed data of debris source at each site in the large scale
study……….………..…17 Figure 7: Mean abundance and proportion of each microplastic category per
site.……….….19 Figure 8: Principal coordinate analysis (PCO) based on a Bray – Curtis similarity
resemblance matrix on square root transformed data of microplastic source at each site in the large scale study.………..………..20 Figure 9: Sampling sites distribution in the meso scale study by exposure level. Proportion
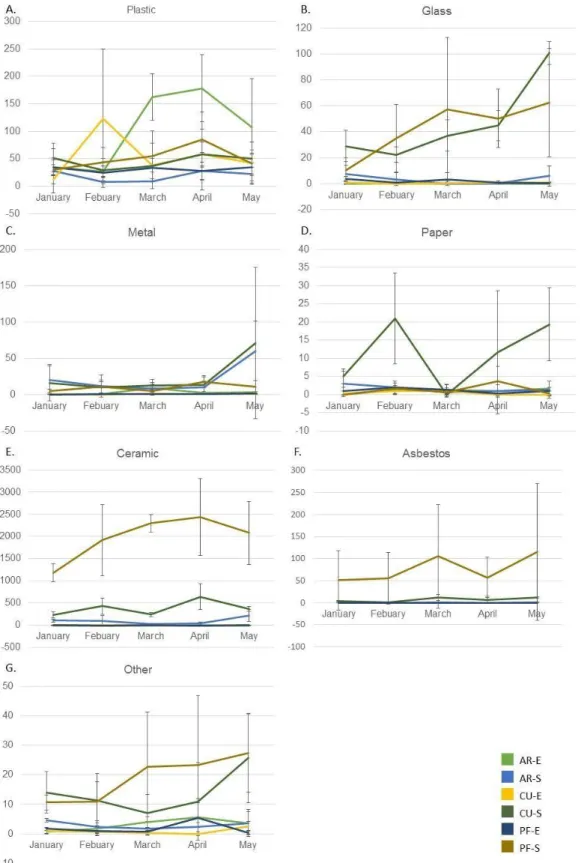
of each material, source and size are described by color coded pies per each site………..…………..……...23 Figure 10: Seasonality of each debris material per site in the mesoscale
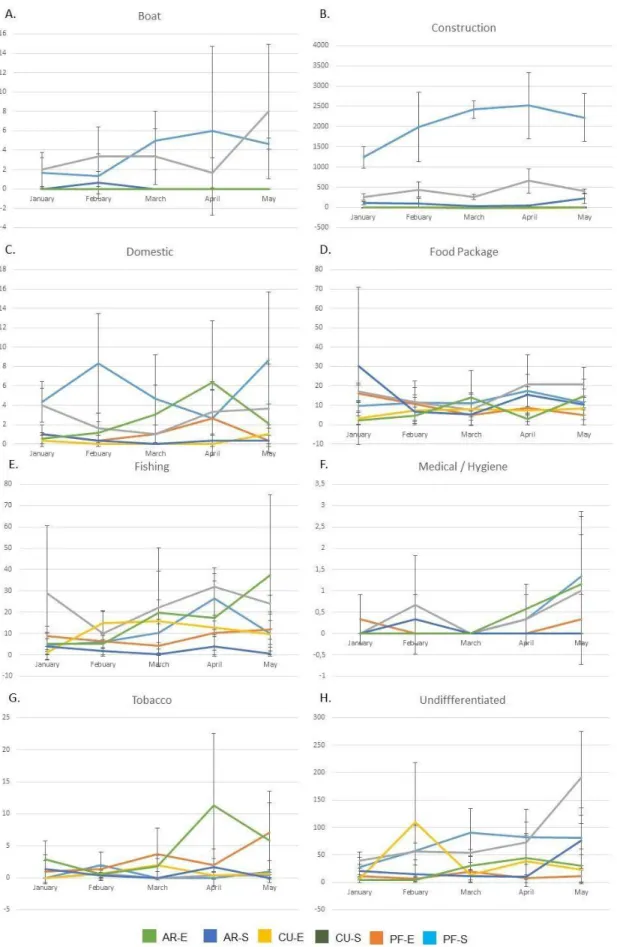
Figure 11: Seasonality of each debris source per site in the mesoscale study……….……….……….25 Figure 12: Principal coordinate analysis (PCO) based on a Bray – Curtis similar it y
resemblance matrix on square root transformed data of debris material at exposed (E) and sheltered (S) exposures of Ria Formosa in mesoscale sudy……….………...26 Figure 13: Principal coordinate analysis (PCO) based on a Bray – Curtis similar it y resemblance matrix on square root transformed data of debris material per month of sampling on Ria Formosa (mesoscale study)....…..………..……….……27 Figure 14: Principal coordinate analysis (PCO) based on a Bray – Curtis similar it y
resemblance matrix on square root transformed data of debris material on each site of Ria Formosa (mesoscale study)………...28 Figure 15: Principal coordinate analysis (PCO) based on a Bray – Curtis similar it y
resemblance matrix on square root transformed data of debris source at exposed (E) and sheltered (S) exposures of Ria Formosa in mesoscale study……….……….29 Figure 16: Principal coordinate analysis (PCO) based on a Bray – Curtis similar it y
resemblance matrix on square root transformed data of debris source per
month of sampling on Ria Formosa (mesoscale
study)………...………..30 Figure 17: Principal coordinate analysis (PCO) based on a Bray – Curtis similar it y
resemblance matrix on square root transformed data of debris source on each site of Ria Formosa (mesoscale study)……….31
Acronyms
ANOVA Analysis of variance EPS Expanded polystyrene HDPE High density Polyethylene LDPE Low density Polyethylene LLDPE Linear low density Polyethylene
MC Monte Carlo
NOAA National Oceanic and Atmospheric Administration (US) PE Polyethylene
PET Polyethylene Terephthalate
PERMANOVA Permutational multivariate analysis of variance POP Persistent Organic Pollutants
PP Polipropylene PS Polistyrene PUR Poliurethane PVC Polyvinylchloride
1. Introduction
Plastic is one of the most successful materials in history. It revolutionized the manufacturing industry by being a versatile, relatively inexpensive and potentiall y transparent material. Plastics have existed for just over a century, and its mass production started only in the 1950s. Globally, between 1964 and 2004 the production per year has increased from 15 million tons to 311 million tons, a 20-fold increase in 50 years. Trends point to a double in production numbers until 2034, and an almost fourfold until 2050 (Carson et al. 2011; PlasticsEurope 2015; World Economic Forum 2016).
A major portion of plastic produced each year is destined for packaging (26 % to 39.5%; World Economic Forum 2016; PlasticsEurope 2015). Most packaging is designed for one utilization only. Out of all plastic packaging 72% is not recovered for recycling or repurposing, of which 40 % ends in landfills and 32 % escapes the collection system, either by not being collected or by being mismanaged or discarded illegally (World Economic Forum 2016). This has a direct economic impact. By having a mindset of a single use of packaging and consequently recycling only 5 % of it, it is estimated that the remaining 95 % yields to an annual monetary loss of 80 to 120 billion US dollars. On top of that, most of the current recycling plastics produce lower value items that are not recyclable themselves (World Economic Forum 2016).
Although these estimates report an important gap of the current economic and resource system, they do not reflect the most concerning problem caused by the mismanage me nt of plastic: leakage of plastic into the marine environment (marine debris).
Marine debris can be defined as solid materials entering the marine environment, either of anthropogenic manufacture or processing, or naturally occurring flotsam (Cole et al. 2011; Gregory 2009). Contamination by marine debris, in particular plastic debris, is one of the major contemporary threats to the health of marine ecosystems (Claessens et al. 2013; Cole et al. 2011; Derraik 2002; Gregory 2009).
According to scientific and government reports, although the percentage of plastic in marine debris varies according to site, it is always found to be as the most abundant type of debris (Barnes et al. 2009; Derraik 2002; STAP 2011).
There are various ways how plastic materials may reach the marine environment and these can be roughly distinguished by having a land or an ocean-based source. Oceanbased sources account for 20% of plastic debris and consist mainly of trash ille ga ll y
dumped by ships and loss of fishing gear material by fisherman (18% of total plastic debris), such as nets and ropes, which are currently mostly made of plastic and often discarded into the ocean (Andrady 2011; Derraik 2002; Hinojosa & Thiel 2009; Watson et al. 2006).
Land-based debris accounts for the remaining 80%. These are mainly litter left by beachgoers (recreational use), litter transported by municipal drainage and rivers, and industrial pellets lost during transportation or through run-off while in the processing factories (Derraik 2002). Industrial pellets are primary plastics, that is plastic particles originally manufactured to be under 5mm of size, either designed to incorporate products (such as industrial abrasives and some health and beauty products like toothpaste, facial cleaner and exfoliants; Cole et al. 2011; Fendall & Sewell 2009) or to be further processed into other items (secondary plastics).
Both primary and secondary plastics can break down into multiple smaller plastic fragments (Cole et al. 2011). This process can occur in nature through the means of photodegradation (light induced degradation), thermooxidative degradation (degradation by slow oxidation at moderate temperatures), hydrolysis (degradation by reacting with water) and biodegradation (degradation through living organisms; Andrady 2011). Usually, multiple types of degradation are acting simultaneously. The most efficie nt plastic degradation found in nature is photo-oxidative degradation (a combinat io n between photodegradation and thermooxidative degradation) where the UV-B from sunlight initiates a cascade of oxidative reactions promoting bond-cleavage (Andrady 2011; Cole et al. 2011; Gregory 1999; Thompson et al. 2004).
Photo-oxidation is the most effective degradation process on plastics on the beach surface or exposed to air and sunlight. While in the marine environment, mechanica l action by the waves helps the process, but the lower temperatures and often lower oxygen concentration delays the photo-oxidative process (Andrady 2011; Barnes et al. 2009; Claessens et al. 2013). For this reason, the beach environment promotes a much faster degradation rate than the marine environment (Andrady 2011; Corcoran 2015).
Although a wide variety of plastics are positively buoyant by having a lower density than water (such as Polyethylene PE and Polipropylene PP), others have a density higher than water (Polyvinylchloride PVC, nylon, acrylic) and tend to sink becoming the so-called “benthic plastic” (Corcoran 2015). Lightweight plastic may sink because of biofouling by bacteria, algae or other organisms, and when these are grazed they may resurface again, ultimately resulting in a cyclic bobbing motion.
Plastic is made of a variety of long synthetic organic polymers that result from the polymerisation of different kinds of monomers. Most plastics are resistant to biodegradation, but there is evidence of microbiota capable of metabolizing plastic and this could offer new insights to engineering better ways of degrading plastic that has been properly disposed (Yang et al. 2013; Zettler et al. 2013).
Some plastic products have been wrongly named as "biodegradable" by having starch added to the matrix of plastic polymers like polyofins. Once in the environment, the starch is biodegraded and mineralized, but the plastic particles within the matrix are released in the form of microparticles, thus still polluting the environment.
Plastic pollution is often noticed because of its unappealing aesthetic (Gregory 2009). However, its ecological and economic impacts greatly surpass the aesthetical problem (Ryan et al. 2009). Economically, tourism, leisure and recreational activities can be directly affected by marine debris, as well as recreational boating and commercia l shipping (Gregory 1999). Medical, drug and personal hygiene products may carry diseases, sharp objects and fishing gear (even from other materials like glass or metal) have the potential of entangling and cutting barefoot beach users, constituting a health hazard. However, the hazards resulting from ecological impacts may bring the most significant consequences, through loss of fisheries subsistence as a consequence of ghost fishing and loss of ecosystem services (Al-masroori et al. 2004; Gregory 1999; Laist 1995). The direct impact of macroplastics (plastic fragments larger than 5 mm) include injury and death of marine life by entanglement and ingestion, smothering of the benthos by preventing gas-exchange (endangering sensitive ecosystems like coral reefs and seagrass beds), creation of artificial hard substrates, chemical toxicity and dispersal of potentially invasive species (Barnes et al. 2009; Cole et al. 2011; Gregory 1999; Gregory 2009; Sheavly 2007).
Most of the reports so far are on entanglement and ingestion of macroplastic by vertebrates (Laist 1997; Wright et al. 2013). Laist (2007) described that at least 267 species had reports being affected by plastic as marine debris. This included 86% of all sea turtle species, 44% of all seabird species and 43% of all marine mammal species. Ingestion of macroplastic is also described for more than 180 species, including species from the previously mentioned taxa (Laist 1997).
Currently, most plastic in the marine environment is microplastic (Claessens et al. 2013; Martins & Sobral 2011; Wright et al. 2013). Due to its relatively small size microplastic becomes bioavailable to organisms throughout the food-web; several direct
negative effects have been reported (Wright et al. 2013). Studies have reported microplastic ingestion by mussels, barnacles, marine worms, amphipods, echinoder m larvaea, sea cucumbers and even zooplankton (Cole et al. 2013; Cauwenberghe et al. 2015; Laist 1997; Hentschel 2015; Vandermeersch et al. 2015; De Witte et al. 2014; Wright et al. 2013). Transfers through trophic levels have been demonstrated between the mussel Mytillus edulis and the crab Carcinus maenas (Farrell & Nelson 2013). Effects of ingestion vary between energy reserves decrease, inflammation, prolonged gut residence times and suppressed feeding, reduced growth and reproduction (Wright et al. 2013).
Microplastics have been observed in intertidal and subtidal sediments worldwide (Claessens et al. 2013). When in sediment, microplastics change the sediment physical properties: heat transfer decreases and water permeability increases due to the increased grain size and smooth surface of plastics (Carson et al. 2011). Consequently, desiccation risk may be higher for biota, such as interstitial meiofauna, inhabiting patches of sediment with high concentration of microplastic. Moreover, organisms such as sea turtles that require subtle temperature variations for their life cycles may experience substantia l effects (Mrosovsky et al. 2009).
Part of the plastic success is also due to the possibility of engineering the polymer molecular structure as well as adding additives (chemicals and metals) to the matrix, providing different properties to the final material such as heat resistance, flexibilit y, stiffness, weight and even electrical conductivity (Andrady 2011). These additives have a wide variety of functions (e.g. antimicrobials, colorants, foaming agents, antioxida nts, lubricants, flame retardants), diversifying their utilitarian interest (Andrady 2011). Chemicals like phthalates, Bisphenol A (BPA), polybrominated diphenyl ethers (PBDE) and tetrabromobisphenol A (TBBPA) are used to improve plastic property performance, but are released when plastic is degraded and have been shown to have significa nt negative effects on living organisms (including humans), such as disruption of endocrina l and reproductive systems (Oehlmann et al. 2009; Talsness et al. 2009). Moreover, microplastics are particularly susceptible to adsorb Persistent Organic Pollutants (POP) which are frequently hydrophobic and therefore have a higher affinity to the plastic surface than to the water.
The distribution of marine debris is patchy and mainly driven by predominant winds, currents, coastal geography and demography (Barnes et al. 2009; Thompson 2010). For instance, it has been observed that plastic debris is more abundant nearby urban areas than in remote areas, although the impact on remote areas is currently increasing significa nt l y
(Gregory 1999; Barnes 2005; Barnes et al. 2009). Closed or semi-closed seas such as the Caribbean sea (Siung-chang 1997) and the Mediterranean sea (Cristina et al. 2016; Galgani et al. 1995; Galgani et al. 1996; Galil et al. 1995) tend to have a higher density of marine debris (Barnes et al. 2009). Pelagic plastic often gets retained within gyres (large areas of circular currents). Extremely high concentrations of floating plastic fragments have been reported in the Northern and Southern Atlantic and Pacific Oceans and in the Indian Ocean (Eriksen et al. 2013; Martinez et al. 2009; Moore 2008).
Regular monitoring of plastic debris in intertidal areas is crucial to estimate overall contamination levels and fluctuations as well as to identify potential sources of contamination. Accumulation and standing stock surveys are the two most common types of survey used to assess the amount of beach litter (Lippiatt et al. 2013). Both methods provide information on the density and quality of the debris, an assessment of long- term balance between input and withdrawal of marine debris and therefore of its overall impact. Accumulation surveys require a higher frequency of sampling than standing-stock surveys. With a sampling frequency of 3 days, accumulation studies can have underestimate plastic debris by 50 %, and with a sampling frequency of one month the underestimation is one order of magnitude higher (Smith & Markic 2013). For this reason, a standing-stock survey is usually chosen for less frequent sampling events and for more geographically wider assessments. Methodology based on the density separation princip le are ideal to extract microplastic from sediment samples (Claessens et al. 2013; HidalgoRuz et al. 2012).
The Portuguese and Moroccan coasts are both located on the North Atlant ic Ocean, and make up for the entry of the Mediterranean Sea by being separated at the Gibraltar strait. Both Atlantic Ocean and Mediterranean Sea have been the focus of multiple studies describing beach, pelagic and benthic plastic debris pollution. However, few studies have described plastic contamination along the Portuguese coastline and none along Moroccan shores. Most studies carried out in Portugal focused on northern and central shores. Plastic items with persistent organic pollutants (POP) pollute the local intertidal beach of Alcobaça, and two other beaches in the Lisbon region (Frias et al. 2010; 2011; 2013). It has been estimated that microplastic makes up 72% of all marine plastic debris found on the west coast of Portugal (Martins & Sobral 2011). Zooplankton in Portuguese waters have been found to ingest microplastic (Frias et al. 2014) while microplastics were found on the stomach contents of 17 species of commercial fish (Neves et al. 2015). Resin pellets found in ten beaches along the western Portuguese
coastline represented 53 % of the total marine debris (Antunes et al. 2013) and fishing nets are the predominant type of benthic debris in the canyon of Cabo de São Vicente (Oliveira et al. 2015). One study describes the prevalence of microplastic in Tejo river intertidal area highlighting distance to nearest sewage, urban center and coastline as critical variables affecting plastic contamination (Gonçalves 2016). The only study carried out in southern Portugal focused on subtidal sediments, where 56% of samples had microplastics, most of which were filaments and fragments whose polymers were identified through µ-FTIR. (Frias et al. 2016).
A modelling report estimated that, globally, Morocco ranks 18th in the list of the top 20 countries ranked by mass of mismanaged plastic waste (an estimate of 0.05 to 0.12 million metric tonnes per year). Similar amounts of mismanaged plastic waste are produced by all the 23 coastal European union countries jointly (Jambeck et al. 2015). Population size and waste management quality were the main relevant factors highlighted by this report.
This thesis can be subdivided into two main sections: a large scale and a mesoscale study. Both studies considered various types of material with a particular focus on plastic.
The general aim of the large scale study was to describe marine debris contamination in the sediment of intertidal beaches along southern Portuguese and Atlantic Moroccan shores. This was done by assessing (a) the prevalence of microplast ics in sediment and (b) the debris composition.
The overall aim of the mesoscale study was to determine marine debris contamination within the coastal lagoon system of Ria Formosa Natural Park. Both sheltered (within the lagoon) and exposed (open coast) sites were considered in this study. At each site, I assessed (a) temporal fluctuations (monthly time scale) of macro debris contamination and (b) the prevalence of microplastics in the sediment of intertidal sandy and muddy beaches.
2. Methodology
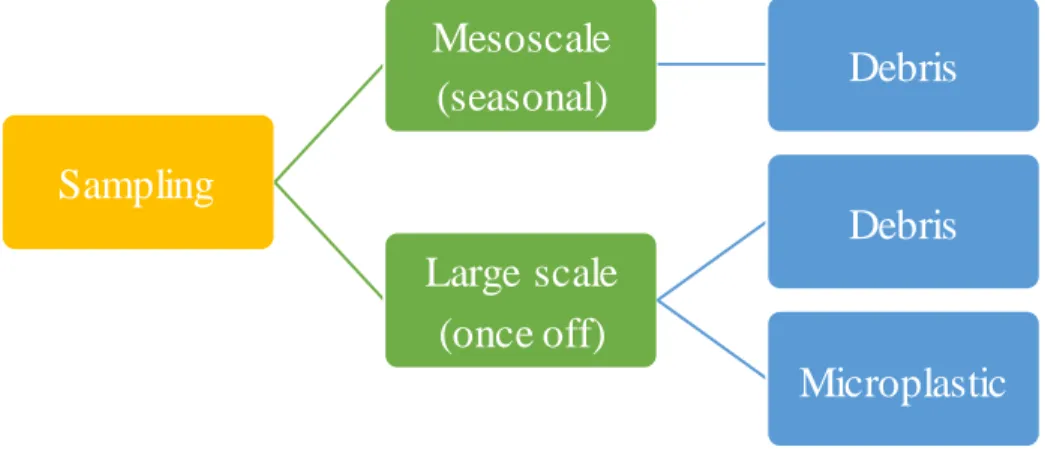
This thesis is subdivided into two main studies (Fig. 1):
1. A large spatial scale, once-off quantitative and qualitative analyses of marine debris and microplastic contamination of beach sediment along Atlantic shores of south Portugal and Morocco.
2. A meso spatial scale, long term (monthly, for 5 month) quantitative and qualitat i ve analyses of marine debris contamination of beach sediment along the barrier islands of Ria Formosa National Park (Portugal).
Both sets of studies will consider various types of material with a focus on plastic.
Fig. 1- Schematic representation of study areas, sampling procedures and frequency of sampling.
2.1. Large scale study
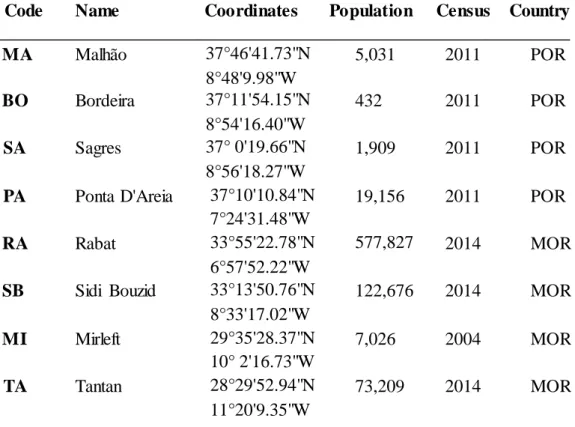
Eight sampling sites were surveyed for debris and microplastic (see Supplementary material, Table 1S). All sampling sites had similar beach morphology (i.e. a minimum of 200m of sandy beach and with sand above the high tide line during a spring tide) and were in proximity to an urban area (i.e. 0 km away from an urban area). Sampling occurred within a period of 30 days, on spring tides lower than 1.2m above the local hydrographical zero.
2.1.1. Debris
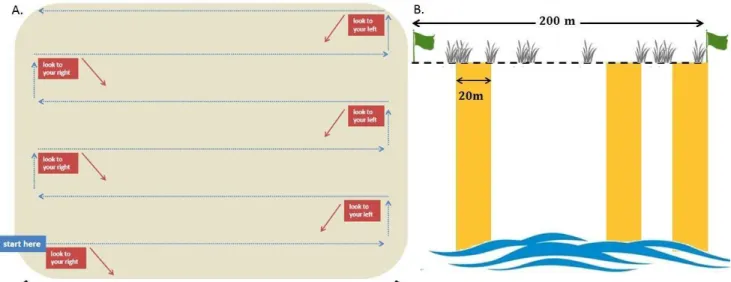
Debris assessment followed a standing-stock procedure (Opfer et al. 2012; Lippiatt et al. 2013). At each sampling site, a 200m section of the beach was selected. Within these 200m, 3 transects of 5m width each, traced perpendicularly to the back
Sampling
Mesoscale
(
seasonal
)
Debris
Large scale
(
once off
)
Debris
Microplastic
of the shoreline, were randomly selected prior to sampling (Lippiatt et al. 2013). Debris size categories in Barnes et al. (2009) were used as guidelines: meso (between 0.5mm and 2cm), macro (from 2cm to 10cm) and mega (larger than 10cm). Microplastic (smaller than 0.5mm) was not considered in this study. Debris type categories were based on Marine Conservation society’s beach watch survey form (Marine conservation Society 2012) and adapted after a preliminary survey in December of 2015 at Ria Formosa. Each debris type was sorted into material and source categories.
The surveyor followed the walking patterned described by Opfer et al. (2012), registering the encountered debris on the form and using a manual counter for debris categories with very high abundance (Fig. 2).
Fig. 2- Debris sampling procedure. Walking pattern of surveyor while sampling a transect (A ; Source: adapted from Opfer 2012) and transect arrangement on sampling area (B ).
2.1.2. Microplastic
A transect of 30m was located on the high tide line and three 50x50 cmquadrants were randomly selected. Sand surface samples (2cm) were placed into aluminium container, sealed and brought to the laboratory for further analyses. No plastic material was used while sampling.
In the laboratory, samples were oven dried at 60ºC until constant weight was reached. Dried samples were weighted and then sieved through two sieves, one of
5mm to exclude macroplastics from the sample and another one of 500µm to separate particles of two size categories (above and below 500µm).
The extraction of microplastics from the sediment followed the density separation principle (Hidalgo-Ruz et al. 2012). As plastic particles are positively buoyant in highly dense water, a concentrated saline NaCl solution (333g.L, using Elix water) was added to each of the sediment size classes to separate the microplastic by elutriation.
Less dense particles were suspended by adding salt saturated water, mixed and left to settle. Supernatant was collected with a pipette and filtered through a qualitat i ve filter. Mixing and filtering was repeated twice. (Claessens et al. 2013; Hidalgo-ruz & Thiel 2012).
To prevent possible contamination, benches were clean and covered in paper and trays wrapped and covered with clean aluminium foil to store material in use. All solutions and glassware was kept covered at all times to avoid airborne contaminat io n. Material was frequently cleaned with distilled water during the procedure and a laboratory coat was used to prevent cloth fibres contamination. To prevent cross sample filament contamination, metal sieves were cleaned often with a pure acetone bath (Nel & Froneman 2015; De Witte et al. 2014). Three control procedures were carried to assess potential contamination where an average of 1 filament (SD=1.00) and 0.67 fragments (SD=0.58) were present.
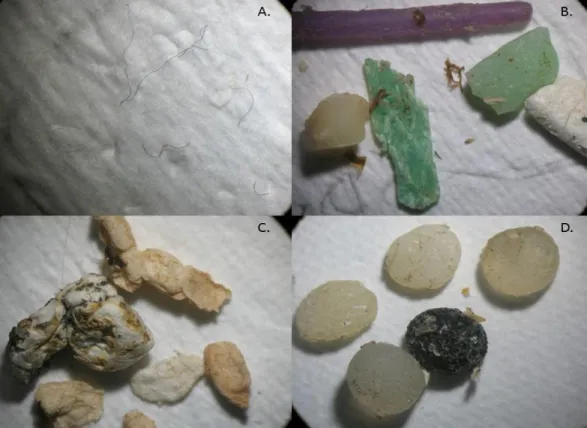
The qualitative filters were analyzed under the dissecting microscope inside glass petri dishes. Microplastic particles were measured and sorted into a category (filament, film, pellet and fragment; Hidalgo-ruz and Thiel 2012) and counted (Fig. 3).
Fig. 3 – Examples of each microplastic category: A. filament, B. fragment, C. Styrofoam, D. Pellet.
2.2. Mesoscale study
Sheltered sites (-S) within the coastal lagoon of Ria Formosa and exposed sites (-E; i.e. facing the open sea) were selected (n=3; Fig. 9) Sites were visited every month for a period of 5 months (from January to May 2016) and sampled each time using a standing stock survey procedure (as in Lippiatt et al. 2013; Opfer et al. 2012).
Sampling always occurred in spring tides (tide height up to 1m). Every sampling event of each site occurred on the same 200m transect throughout the whole study. Sampling design was similar to that described for debris in the large scale study in section 2.1.1 but with transects width of 20m.
Cement blocks were widely present in certain sites such as PF-S and CU-S. However, cement closely resembles sand. To avoid misidentification, cement blocks were excluded from the analysis.
2.3. Data Analyses
To test for differences in debris abundance among sites of the large scale study, two datasets were used. One with data grouped by material (i.e., plastic, metal, paper, glass,
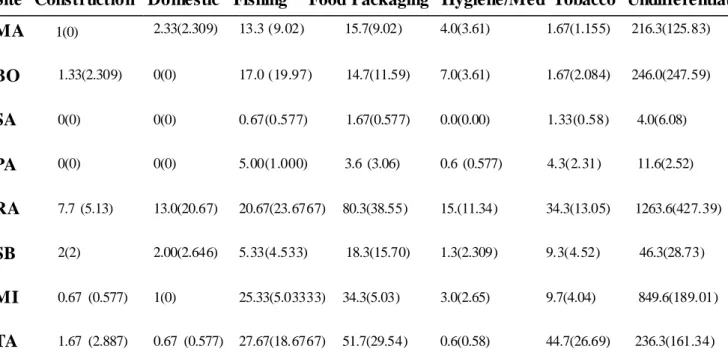
ceramic, asbestos and other) and one with data grouped by source (i.e., constructio n, domestic, fishing, tobacco, food packaging, hygiene / medical and undifferentiat ed). Similarly, to test for differences in microplastic abundance among sites, a dataset was created with data grouped by microplastic type. A one way PERMANOVA was performed with site as the fixed factor and abundance as the dependent variable.
To test for differences between exposed and sheltered sites in the mesoscale study debris abundance was either grouped by material (i.e., plastic, metal, paper, glass, ceramic, asbestos and other) or by source (i.e., boat, construction, domestic, fishing, tobacco, food packaging, hygiene/medical and undifferentiated). A three-way PERMANOVA was performed with exposure and month as fixed factors, site as a random factor nested in exposure and abundance as the dependent variable.
A Bray–Curtis dissimilarity matrix was used for square root transformed multivar ia te measures on all sets of data. To search for significant sources of variation, post hoc comparisons were performed using pair-wise tests and applying Bonferroni correction to reduce potential type I errors in multiple comparisons. Monte Carlo Pvalue was preferred over permutation P-value when very few unique permutations were possible (Anderson 2005). Permutation tests of multivariate dispersion (PERMDISP; Anderson 2004) were used to check the homogeneity in the average dissimilarities of samples from the central location of their group. SIMPER procedure (Clarke 1993) was used to identify the percentage contribution (%) that each variable made to the betweensites Bray-Curtis dissimilarities. The cut off for low contributions was 50% of cumulative percentage of average dissimilarity between sites.
To visualize spatially the datasets, a principal coordinate analysis (PCO) based on a Bray–Curtis similarity resemblance matrix was performed. Additionally, boxplots (Fig. 1S ,2S) were plotted for each individual category of the large scale study. Moreover, linegraphs were plotted for each individual category in the mesoscale, seasonal study.
PERMANOVA, PERMDISP, SIMPER and PCO analysis and respective Post hoc analysis were performed using PRIMER 6.1.15 & PERMANOVA+ 1.0.5 software (PRIMER-E Ltd 2012).
Boxplots were performed using SPSS Statistics 17.0 software (IBM SPSS Inc. 2012).
3. Results
3.1. Large scale study 3.1.1. Debris
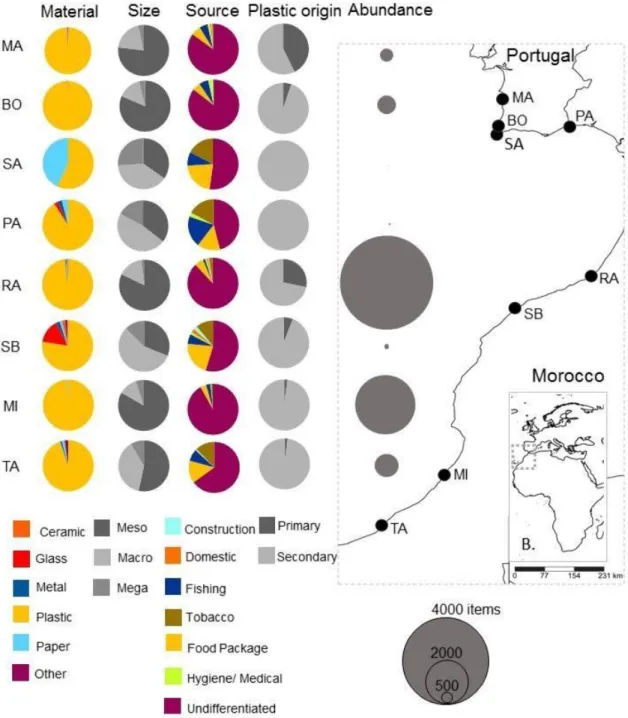
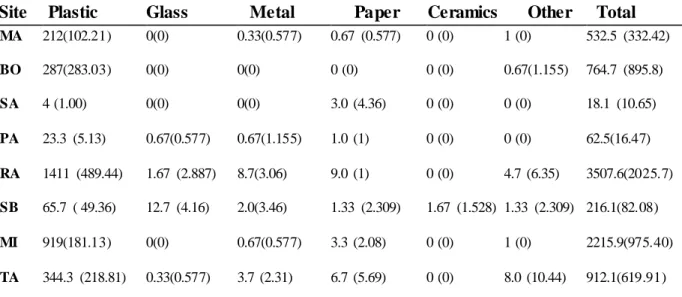
A total of 10023 litter items were encountered across the standing-stock surveys. Debris was most abundant in RA, MI and TA, and least abundant in SA, PA and SB (Fig. 4). Overall, plastic items accounted the vast majority of litter at all sites. Most debris items belonged to smaller size categories (Meso or Macro) across all sites. Most of the debris had an undifferentiated source. Within the identifiable sources of debris, food packaging, fishing and tobacco were the most important, with variable contribution among sites. Across all sites, most plastic was secondary plastic with the exception of RA and MA where primary plastic was more than 25%. No primary plastic was found at SA and PA.
Site had a significant effect on debris abundance when grouped by materia l (PERMANOVA: F7,16= 11.16; p= 0.0001). The two sites with lowest abundance of debris were significantly different from the two sites with the highest abundance of debris (pairwise comparison: SA, RA: t(7)= 5.34, p(MC)< 0.0018; SA, MI: t(7)= 5.50, p(MC)< 0.0018; PA, RA: t(7)= 6.30, p(MC)< 0.0018; PA, MI: t(7)= 6.56, p(MC)< 0.0018) (Table 3S). Multivariate dispersion was homogeneous among levels (PERMDISP: F7,16= 2.01; p= 0.441).
Site had a significant effect on debris abundance when grouped by source (PERMANOVA: F7,16=9.4485, p= 0.0001). Two pair wise comparisons were significantly different: PA vs. RA: (t(7)= 7.59, p(MC)< 0.00179) and PA vs. MI (t(7)=8.50, p(MC)<0.00179; Table 4S). Multivariate dispersion was homogeneous among levels (PERMDISP: F7,16= 1.44; p=0.801).
Principal coordinate analysis (PCO) did not show a geographical clustering pattern (Fig. 5, Fig. 6). However, replicates within each site tends to cluster together in all sets of data (debris by material and debris by source). Overall, those sites that are not part of the main cluster have the lowest abundances of debris (Table 2S, 3S).
When data were grouped by material, plastic was the main contributor to the dissimilarities among sites (SIMPER: 44%-91%) with the exception of the pair PA vs. SB where instead glass (34%) contributed the most, followed by plastic (29%).
The site with highest abundance of plastic was RA while SA had the lowest plastic abundance (Table 2S). Glass had the highest abundance in SB and was present in RA, TA and PA. Metal had its highest abundance in RA and was present at all sites except for BO and SA. Paper was present at all sites with the exception of BO. The site with the highest paper abundance was RA. Ceramic was only present at SB. Asbestos was not recorded at any site of the large scale study, and thus it was not included in the analysis.
When data were grouped by sources, undifferentiated debris was the main contribute to the dissimilarities among sites (SIMPER: 28.87% - 72.29%). Fishing (13.4% - 26.4%), tobacco (11.35% - 27.6%), medical/hygiene (13.4% - 21.3%) and food packaging (12.9%) also had an important contribution to the dissimilarity between few pairs of sites (Table 3S). Sites with the lowest abundance of debris coincided with the lowest undifferentiated debris and this increased the contribution of other types of debris with recognizable sources.
Fig. 4. - Sampling sites distribution in the large scale study. Proportion of each material, size, source and plastic origin are described by color coded pies per site.
Fig. 5. Principal coordinate analysis (PCO) based on a Bray – Curtis similar it y resemblance matrix on standardized by total and square root transformed data of debris material composition at each site in the large scale study.
Fig. 6. Principal coordinate analysis (PCO) based on a Bray – Curtis similar it y resemblance matrix on standardized by total and square root transformed data of debris source at each site in the large scale study.
3.1.1. Microplastic
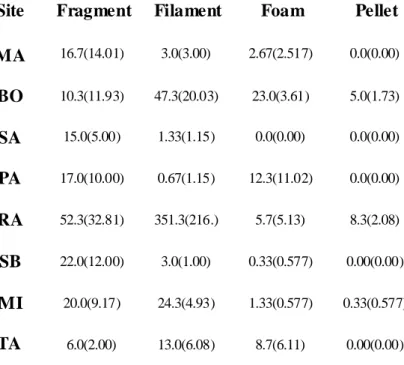
Microplastic was present at all sites. In total, 2013 pieces of microplastic were recorded (Fig. 7). Microplastic was particularly abundant in RA and BO and least abundant in SA, SB and MA. Overall, the most abundant type of microplastic was fragment, followed by either filament or foam. Pellets were present in RA, BO and MI and absent at all other sites. Industrial pellets were the predominant type of pellets but few cosmetic-like pellets were present. The only type of foam encountered at all sites was styrofoam.
Site had a significant effect on microplastic abundance (PERMANOVA: F(7,16)= 8.019; p= 0.0001). Pairwise comparison were significant in two cases: SA vs RA (t(7)= 5.47, p(MC)<0.00179) and BO vs SA (t(7)= 6.32, p(MC)<0.00179;
Bonferroni: α = 0.00179). Multivariate dispersion was homogeneous among levels (PERMDISP: F7,16= 3.02; p=0.290). The main contribution to the dissimilarities among sites was either fragment (SIMPER: 38.6%-63.8%) foam (30.5%-51.1) or fila me nt (30.5% - 51.1%). Pellet was only relevant for the dissimilarity between the pair BO and TA (25.13%). RA vs. BO comparison tended to have dissimilarity mostly explained by the fragment category.
Principal coordinate analysis (PCO) did not show a geographical pattern (Fig. 8). Replicates within each site tend to cluster together. The sites RA and BO grouped closely and slightly isolated from the remaining sites, which is consistent with previous ly described SIMPER analysis.
Fig. 7. Mean abundance and proportion of each microplastic category per site.
Fig. 8. Principal coordinate analysis (PCO) based on a Bray – Curtis similar it y
resemblance matrix on square root transformed data of microplastic source at each site in the large scale study.
3.2. Mesoscale study
A total of 249232 litter items were encountered across all standing-stock surveys (Fig. 9). Debris material and source seasonality over the period of 5 months is described in Fig. 10,11. Debris was most abundant in PF-S, and least abundant in PF-E (Fig. 9). Overall, ceramic items accounted for the vast majority of litter at sheltered sites, while at exposed sites plastic was the most predominant item recorded. Across all sites, most debris items belonged to the smallest size categories (meso or macro). Across all leve ls (exposure, site, month), most of the debris had an undifferentiated source. Within the identifiable sources of debris, construction, food package, fishing and tobacco were the most abundant. Primary plastic was only found once in Ria Formosa (CU-E in May, 11 pellets).
Overall, exposure (PERMANOVA: F1,60= 9.30; p (MC)< 0.01) and sites (F4,60= 19.19; p< 0.001) had a significant effect on abundance of debris when grouped by materia l while month did not show a significant effect (F4,60= 1.45; p= 0.203). There was an effect of the nested factor site because most of the sites were significantly different within the level exposed and sheltered (pairwise comparison: AR-S, Cu-S: t(2)= 5.26; p< 0.016; AR-S, PF-S : t(2)=8.04; p< 0.016; Cu-S, PF-S: t(2)=6.72; p<
0.016; Cu-E vs PF-E (AR-E, Cu-E : t(2)= 2,07; p< 0.016; AR-E, PF-E : t(2)=3.02; p< 0.016; Cu-E, PF-E: t(2)=1.43; p> 0.016). Multivariate dispersion was homogeneous for the factor exposure (PERMDISP: F1,88=2.04, p=0.188) and month (F4,85=0.14, p=0.976) but not for the factor site (F5,84=7.88, p<0.001) indicating that the significant effect of site detected in the PERMANOVA could also be due to difference in the dispersion of the data for this term.
Principal Coordinate Analysis was coherent with the results of the PERMANO VA (PCO; Fig. 12,13,14). There was a clear segregation between sheltered and exposed sites when data was plotted by the factor exposure while, when plotted by the factor month, there was a complete overlap among the different months (Fig. 13,16). The overlap suggests a lack of a consistent pattern, as supported by the line graphs where seasonal variability does not seem to follow a trend (Fig. 10). When data was plotted by site, replicates within each site tend to cluster together on the PCO. However, the clusters of sheltered sites were clearly segregated, while the clusters of exposed sites overlap, which
suggests that debris material is more dissimilar between sheltered sites than between exposed sites.
Ceramic was the main contribution to dissimilarities between exposures (SIMPER: 54%). Plastic contributed to most of the dissimilarities among exposed sites (39 - 53%) while ceramics contributed to most of the dissimilarities among sheltered sites (37-62%). Dissimilarities among months was mostly explained by ceramic (2632%) and plastic (25-32%).
Overall, site (PERMANOVA:F4,60= 24.18; p<0.001) and exposure (F1,60= 6.71; p(MC)<0.01) had a significant effect on the abundance of debris grouped by source while month did not show a significant effect (F4,60= 1.32; p=0.242). All pairs of sites were statistically different within levels of the factor exposure (pairwise comparison: PF-S, CU-S: t(2)=7.30, p<0.016; PF-S, AR-S: t(2) =8.61, p<0.016; CU-S, AR-S: t(2)=5.44, p<0.016; PF-E, CU-E: t(2)=1.88, p<0.016; PF-E, E: t(2)=2.98, p<0.016; CU-E, AR-E, p<0.016). Multivariate dispersion was not homogenous between the levels of the factor exposure (PERMDISP: F1,88=4.86, p<0.05) and levels of the factor site (F5,84=6.94, p<0.001), with several pairs of sites being statistically different (pairwise comparison: (PF-S, PF-E: t(15)=3.43, p<0.016; PF-S,CU-E: t(15)=3,97, p<0.016; PF-S,AR-S: t(15)= 4.63 ,p<0.016; PF-S, AR-E: t(15)= 5.12, p<0.016; CUS,E: t(15)= 3.07, p<0.016; CU-S, AR-S: t(15)=3.46, p<0.016). This indicates that the significant variance of the factor site and exposure detected in the PERMANOVA could also be due to differences in the dispersion of the data. Month had a homogeneous multivariate dispersion (F4,85=0.26, p=0.931). Construction was the main source of dissimilarity between exposures (SIMPER: 62%), sites (39-79%) and months (51-55%).
Principal Coordinate Analysis was coherent with the results of the PERMANO VA (PCO; Fig. 15,16,17). Similarly to the PCO of debris grouped by material, there was a clear segregation between sheltered and exposed sites when data was plotted by the factor exposure (Fig. 15). For data plotted by the factor site, replicates within each site tend to cluster together on the PCO, where the clusters of sheltered sites were clearly segregated while the clusters of exposed sites overlap, suggesting that debris source is more dissimilar between sheltered sites than between exposed sites (Fig. 17). For data plotted by month, there was a complete overlap among the different months (Fig. 16). Similar l y to the PCO of debris grouped by material plotted by factor month, the overlap suggests lack of a consistent pattern, as supported by the line graphs (Fig. 11).
Fig. 9. - Sampling sites distribution in the meso scale study by exposure level. Proportion of each material, source and size are described by color coded pies per each site.
Fig. 10 – Seasonality of each debris material per site. Vertical bars stand for standard deviation.
Fig. 11 – Seasonality of each debris source per site. Vertical bars stand for standard deviation.
Fig. 12. Principal coordinate analysis (PCO) based on a Bray – Curtis similar it y resemblance matrix on square root transformed data of debris material at exposed (E) and sheltered (S) exposures of Ria Formosa in mesoscale study.
Fig. 13. Principal coordinate analysis (PCO) based on a Bray – Curtis similar it y resemblance matrix on square root transformed data of debris material per month of sampling on Ria Formosa (mesoscale study).
Fig. 14. Principal coordinate analysis (PCO) based on a Bray – Curtis similar it y resemblance matrix on square root transformed data of debris material on each site of Ria Formosa (mesoscale study).
Fig. 15. Principal coordinate analysis (PCO) based on a Bray – Curtis similar it y resemblance matrix on square root transformed data of debris source at exposed (E) and sheltered (S) exposures of Ria Formosa in mesoscale study.
Fig. 16. Principal coordinate analysis (PCO) based on a Bray – Curtis similar it y resemblance matrix on square root transformed data of debris source per month of sampling on Ria Formosa (mesoscale study).
Fig. 17. Principal coordinate analysis (PCO) based on a Bray – Curtis similar it y resemblance matrix on square root transformed data of debris source on each site of Ria Formosa (mesoscale study).
4. Discussion
Marine debris, particularly plastic debris, is widely spread across multiple types of marine ecosystems, even reaching the most remote areas (Goldstein et al. 2013; Taffs & Cullen 2005). However, the distribution of marine debris has a high spatial variabilit y that results from the interaction of multiple environmental and social factors (Goldstein et al. 2013; Jambeck 2015). Ocean currents and large-scale atmospheric patterns promote the accumulation of floating debris in convergence zones and gyres (Goldstein et al. 2013; Martinez et al. 2009). Locally, environmental factors like ocean swells and currents, wind patterns and geography are often associated to differential distribution of debris (Browne et al. 2010; Barnes et al. 2009; Taffs & Cullen 2005). Interaction of social factors such as size of coastal populations, waste generation and management, and local activities are important factors when considering debris source (Jambeck 2015).
This study documents widespread prevalence of marine debris, though its distribution and composition is spatially variable (on both a large scale and mesoscale perspective) and temporally variable (mesoscale seasonal study). Both environmental and social factors where important when considering debris distribution and abundance, although not equally depending on the observation scale. On a large scale variability was mainly explained by wind patterns, exposure and size of local populations. For mesoscale, exposure of site and local activities frequently shape the composition variability between sites. Abundance and contribution of materials had large variability over time, highlighting the need for further understanding of local factors, extensive sampling and widespread seasonal monitorisation of marine debris.
4.1. Large scale study
This study demonstrates clear evidence of a widespread presence of marine debris in intertidal areas. In particular, plastic was present at all sites under the form of debris and microplastic.
Plastic accounted for most of debris on the shoreline, ranging from 57% to 100% of total litter. Similar importance has been reported globally, where plastic is the main component of beach stranded debris (up to 95%) (Galgani et al.2015). The most common source was undifferentiated debris, but within the identifiable sources of debris, food packaging, fishing and tobacco were the most abundant. Most items of these three sources
were composed by plastic material, as well as much of the undifferentiated debris, which supports the dominance of plastic material across sites.
The distribution of debris did not follow a geographical pattern, which was unexpected. Morocco ranks as 18th country on the list of top countries that misma na ge plastic waste and is estimated to generate 0.05-0.18 MMT/year of plastic marine debris (Jambeck 2015), a rank equivalent to what the 23 coastal countries of EU would score together. This results from the interaction of some social factors such as size of coastal populations, state of the economy, total waste generation and respective percentage of plastic waste, and waste mismanagement (Jambeck 2015). For this reason, a geographica l pattern would be expected where beaches in Portugal, as a country with better waste management, less population and less waste generation, would have less debris contamination than morocco. Indeed, the highest contamination levels are found on RA, MI and TA, sites in morocco located nearby the largest human populations of the study (Table 1S). However, this relationship does not suffice on explaining the totality of variability.
Interaction with other social factors like local management (such as unknown cleanups) and local activities (like recreational use) on site could also be factors. (Barnes et al. 2009; Taffs & Cullen 2005). The sampling event was done under the period of one month during May/June, which is the beginning of tourist season for both countries who receive many tourists for recreational beach use. Both Portugal and Morocco are known for having beach cleanups to improve the recreational use. In Morocco, RA and SB were found to have frequent beach cleanups on a daily/weekly basis prior to the sampling event. In Portugal, although such events are frequent and organized locally (and news about them tend to only spread locally as well), to the best of my knowledge, no frequent organized cleanups were done prior to the sampling events.
After the sampling event of this study, the Moroccan government banned the production, import, sale and distribution of plastic bags to reduce plastic waste, for what this study might be used as a baseline evaluation for future comparisons. A similar measure was taken in Portugal in February 2015, where the government implemented a tax over consumption of plastic bags. The measure was successful by decreasing 74% of the consumption of carrier plastic bags, while the utilization of reusable plastic bags increased by 61% (Martinho et al. 2017). The tax was highly accepted by the consumer,
but no effects were detected over the overall population perception of the impacts carrier bags have in the environment, particularly as marine litter (Martinho et al. 2017).
Amongst the environmental factors that most influence the debris distribution are wind patterns and currents. Plastic is mostly distributed on the upper part of the water column, which is also the most susceptible to have current direction be influenced by the wind direction (Kukulka 2012). Wind patterns contribute to differential distribution of plastic debris on coastal shores by influencing surface currents, and plastic debris (under the form of larger pieces and micoplastic) tends to accumulate more on windward than leeward shores (Debrot et al. 2013; Ivar do Sul et al. 2009; Underwoods 2016).
During the month of sampling, the predominant direction of the wind was NNW at all sites but SB where NNE was predominant. The direction towards which the beach opposed the sea was different among sites: TA facing N, MI facing NW, RA facing NNW, MA and SB facing W, BO facing WNW, SA facing S and PA facing SSW.
For most sites, wind from NNW blows from ocean to land, while wind from NNE blows from land to sea (Wisuki ). The two sites that were exception to this situation were PA and SA, which face S and SSW and were among the sites with smaller abundance of plastic debris. The sites that were less sheltered from predominant wind direction (sites facing N, NNW or NW) were the sites with highest debris abundance (RA, MI and TA). The sites MA and BO face W and WNW respectively, and therefore were more sheltered from predominant winds than the previous, having intermediate debris abundance. Although SB is also facing W, the predominant wind direction at the site was NNE, for what wind would blow from land to sea.
This observation provides a general good fit with the debris distribution along the coastline. It is likely that when wind blows from the ocean to the beach deposition of floating sea based debris might increase. Contrastingly, wind blowing from land to ocean could increase removal of land-based debris on the beach. This is coherent with the obtained results. Out of the considered social and environmental factors, predominant wind patterns direction and consequent surface currents coupled with the direction towards which the beach was faced provided the most coherent explanation of debris distribution along the coast of South Portugal and Morocco.
Regarding debris source, the three most important identifiable sources were food package, fishing and tobacco. This is in accord with previous worldwide records as food packaging is the most fabricated plastic item and plastic fishing gear debris is widespread.