An SEM, EDS and vibrational spectroscopic study of the silicate mineral
meliphanite (Ca,Na)
2
Be[(Si,Al)
2
O
6
(F,OH)]
Ray L. Frost
a,⇑, Andrés López
a, Frederick L. Theiss
a, Antônio Wilson Romano
b, Ricardo Scholz
ba
School of Chemistry, Physics and Mechanical Engineering, Science and Engineering Faculty, Queensland University of Technology, GPO Box 2434, Brisbane, Queensland 4001, Australia
b
Geology Department, School of Mines, Federal University of Ouro Preto, Campus Morro do Cruzeiro, Ouro Preto, MG 35400-00, Brazil
h i g h l i g h t s
Meliphanite
(Ca,Na)2Be[(Si,Al)2O6(F,OH)] is a
crystalline sodium calcium beryllium silicate.
The mineral was characterized by scanning electron microscopy (SEM) with energy dispersive spectroscopy (EDX).
EDX analysis shows high
concentrations of Si and Ca and low amounts of Na, Al and F.
Raman spectroscopy identifies bands in the OH stretching region.
g r a p h i c a l
a b s t r a c t
a r t i c l e
i n f o
Article history:
Received 8 July 2014
Received in revised form 24 August 2014 Accepted 11 September 2014
Available online 2 October 2014
Keywords:
Meliphanite Melitite Leucophanite Raman spectroscopy Infrared spectroscopy
a b s t r a c t
The mineral meliphanite (Ca,Na)2Be[(Si,Al)2O6(F,OH)] is a crystalline sodium calcium beryllium silicate
which has the potential to be used as piezoelectric material and for other ferroelectric applications. The mineral has been characterized by a combination of scanning electron microscopy (SEM) with energy dispersive spectroscopy (EDS) and vibrational spectroscopy. EDS analysis shows a material with high concentrations of Si and Ca and low amounts of Na, Al and F. Beryllium was not detected. Raman bands at 1016 and 1050 cm 1are assigned to the SiO and AlOH stretching vibrations of three dimensional
silox-ane units. The infrared spectrum of meliphanite is very broad in comparison with the Raman spectrum. Raman bands at 472 and 510 cm 1are assigned to OSiO bending modes. Raman spectroscopy identifies
bands in the OH stretching region. Raman spectroscopy with complimentary infrared spectroscopy enables the characterization of the silicate mineral meliphanite.
Ó2014 Elsevier B.V. All rights reserved.
Introduction
The mineral meliphanite has the formula (Ca,Na)2Be[(Si,Al)
2-O6(F,OH)][1]. The mineral was discovered in 1852 and is named
after the Greek word for honey because of the honey like colour of the mineral. Please see the picture of the meliphanite mineral used in the graphical abstract. Considerable variation in colour
may be observed among samples of meliphanite from orange to black. The mineral is known from several places worldwide[2–4]
and is often collected as a semi-precious jewel (please seehttp:// www.gemsociety.org/article/meliphanite-jewelry-and-gemstone-information/). It should be noted that there are a range of formulae which are given for meliphanite including [(Ca,Na)2Be(Si,Al)2
(O,OH,F)7], Ca(Na, Ca)BeSi206F, (Ca,Na)2Be[(Si,Al)2O6(F,OH)] and
Ca4(Na,Ca)4Be4AlSi7O24(F,O)4[5]. It is apparent that the exact
for-mula of the mineral remains to be precisely determined and of course, it may vary according to the sample origin. It is apparent
http://dx.doi.org/10.1016/j.saa.2014.09.018 1386-1425/Ó2014 Elsevier B.V. All rights reserved.
⇑Corresponding author. Tel.: +61 7 3138 2407; fax: +61 7 3138 1804.
E-mail address:[email protected](R.L. Frost).
Contents lists available atScienceDirect
Spectrochimica Acta Part A: Molecular and
Biomolecular Spectroscopy
that some of the physical properties of the mineral meliphanite remain to be measured.
The mineral is tetragonal with space groupI4 bar andZ= 8[1].
The cell dimensions are a= 10.5257(3) Å, c= 9.8868(4) Å,
V= 1095.37(8) Å3. The crystal structure was solved by comparison
with the silicate mineral melitite[1]. The crystal structure consists of infinite sheets of SiO4and BeO4tetrahedra between which Ca or
(Ca, Na) are sandwiched. The coordination polyhedra of these cat-ions are distorted trigonal prisms. Grice and Hawthorne[5]refined the structure of meliphanite and state that the anomalous biaxial character of tetragonal meliphanite is likely due to stress within the crystal structure as a result of twinning. The presence of alu-minium in the tetrahedra layers enables the distinction between meliphanite and leucophanite, Ca4Na4Be4Si8O24F4 [6]. These two
minerals are noted for their fluorescent properties[7](seehttp:// www.csiro.au/luminescence/Default.aspx). Gugiaite Ca2BeSi2O7is
a melitite mineral and is named for the Chinese village of Gugia where it was first discovered[8]. It occurs mostly in skarns with melanite adjacent to an alkali syenite. Shortly after the discovery of gugiaite, it was noted that a new name was unnecessary as it could have been considered an end member of meliphanite differ-ing mainly in containdiffer-ing much less Na and F. Recent data have con-firmed that gugiaite does differ from meliphanite optically and structurally [5]. Gugiaite is a melilite and is distinctly different from other beryllium minerals such as meliphanite and
leucopha-nite [5]. These beryllium bearing minerals are strongly
piezoelectric.
No Raman spectroscopic studies of meliphanite and related
minerals have been forthcoming [9]. Some infrared studies of
selected calcium silicates have been undertaken[10,11]. Few stud-ies have been made on beryllium containing silicates. Studstud-ies of hydrogen bonding in silicates relates the position of the hydroxyl stretching vibration to the hydrogen bond distances[12]. Some discussion in the literature relates to the presence of OH groups in the structure of meliphanite[5]. Some Raman spectra of calcium silicates have been collected and a number of the spectra were shown to be dependent upon the number of condensed silica
tet-rahedra [13]. Such detailed assignment of infrared and Raman
bands for a wide range of silicate structures was made by Dowty
[14–17]. The thermal decomposition of calcium silicates has also been measured[18–20].
There is an apparent lack of information on the vibrational spec-tra of meliphanite. The reason for such a lack of information is not known; yet the mineral contains siloxane units. Such units lend themselves to vibrational spectroscopy. Raman spectroscopy has proven most useful for the study of mineral structure [21–24]. The objective of this research is to report the Raman and infrared spectra of meliphanite and to relate the spectra to the mineral structure.
Experimental
Samples description and preparation
The meliphanite sample studied in this work forms part of the collection of the Geology Department of the Federal University of Ouro Preto, Minas Gerais, Brazil, with sample code SAC-144. The mineral originated from from Østskogen larvikittbrudd, Tvedalen (Tveidalen), Larvik kommune, Vestfold fylke, Norway. A detailed study of the locality was published[25].
The sample was gently crushed and the associated minerals were removed under a stereomicroscope Leica MZ4. The melipha-nite studied in this work occurs in association with siderite. Scan-ning electron microscopy (SEM) in the EDS mode was applied to support the mineral characterization.
Scanning electron microscopy (SEM)
Experiments and analyses involving electron microscopy were performed in the Center of Microscopy of the Universidade Federal de Minas Gerais, Belo Horizonte, Minas Gerais, Brazil (http:// www.microscopia.ufmg.br).
Meliphanite crystals were coated with a 5 nm layer of evapo-rated carbon. Secondary Electron and Backscattering Electron images were obtained using a JEOL JSM-6360LV equipment. Qual-itative and semi-quantQual-itative chemical analyses in the EDS mode were performed with a ThermoNORAN spectrometer model Quest and was applied to support the mineral characterization. The same sample was used for SEM with EDS and vibrational spectroscopy.
Raman microprobe spectroscopy
Crystals of meliphanite were placed on a polished metal surface on the stage of an Olympus BHSM microscope, which is equipped with 10, 20, and 50objectives. The microscope is part of a
Renishaw 1000 Raman microscope system, which also includes a monochromator, a filter system and a CCD detector (1024 pixels). The Raman spectra were excited by a Spectra-Physics model 127 He–Ne laser producing highly polarized light at 633 nm and col-lected at a nominal resolution of 2 cm 1and a precision of ±1 cm 1
in the range between 200 and 4000 cm 1. Repeated acquisitions on
the crystals using the highest magnification (50) were
accumu-lated to improve the signal to noise ratio of the spectra. Raman Spectra were calibrated using the 520.5 cm 1 line of a silicon
wafer. The Raman spectrum of at least 10 crystals was collected to ensure the consistency of the spectra. An image of the melipha-nite crystals measured is shown in the graphical abstract. Clearly the crystals of meliphanite are readily observed, making the vibra-tional spectroscopic measurements readily obtainable.
Infrared spectroscopy
Infrared spectra were obtained using a Nicolet Nexus 870 FTIR spectrometer with a smart endurance single bounce diamond
ATR cell. Spectra over the 4000–525 cm 1 range were obtained
by the co-addition of 128 scans with a resolution of 4 cm 1and a
mirror velocity of 0.6329 cm/s. Spectra were co-added to improve the signal to noise ratio.
Spectral manipulation such as baseline correction/adjustment and smoothing were performed using the Spectracalc software package GRAMS (Galactic Industries Corporation, NH, USA). Band component analysis was undertaken using the Jandel ‘Peakfit’ soft-ware package that enabled the type of fitting function to be selected and allows specific parameters to be fixed or varied accordingly. Band fitting was done using a Lorentzian–Gaussian cross-product function with the minimum number of component bands used for the fitting process. The Gaussian–Lorentzian ratio was maintained at values greater than 0.7 and fitting was under-taken until reproducible results were obtained with squared corre-lations ofr2greater than 0.995.
Results and discussion
Chemical characterization
The SEM image of meliphanite sample studied in this work is
shown in Fig. 1. The image shows a cleavage fragment up to
2 mm. Qualitative chemical analysis shows a homogeneous phase, composed by Ca, Na, Al and Si. Minor amount of fluorine was also observed. No other contaminant elements were detected and the
sample can be considered as a pure single phase (Fig. 2). No Be was determined because of its low atomic number.
Vibrational spectroscopy
The Raman spectrum of meliphanite over the 100–4000 cm 1
spectral range is shown inFig. 3a. This figure shows the position and relative intensity of the Raman bands. It is noted there are large parts of the spectrum where little or no intensity is observed. The Raman spectrum is therefore subdivided into sections based upon the types of vibration being studied. It is noted that in the OH stretching region between 3000 and 3800 cm 1, considerable
intensity is observed. The infrared spectrum of meliphanite over the 500–1500 cm 1spectral range is displayed inFig. 3b. This
fig-ure shows the position and relative intensities of the infrared
bands. There is minimal intensity observed beyond 1500 cm 1.
The infrared spectrum is subdivided into sections based upon the type of vibration being analysed.
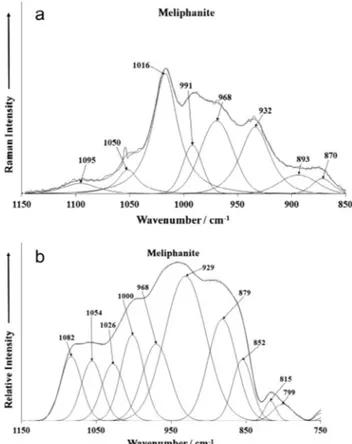
The Raman spectrum of meliphanite over the 850–1150 cm 1
spectral range is shown in Fig. 4a. The structure of meliphanite consists of three dimensional silicate sheets with multiple linked silica tetrahedra [1,5]. Raman bands are observed at 932, 968,
991, 1016, 1050 and 1095 cm 1 and are assigned to the SiO
stretching vibrations. The Raman bands at 870 and 893 cm 1
may be attributed to hydroxyl deformation modes. Dowty calculated the band positions for the different ideal silicate units.
Dowty showed that the SiO3 units had a unique band position
of 1025 cm 1 [17] (see Figs. 2 and 4 of this reference). Dowty Fig. 1.Backscattered electron image (BSI) of a meliphanite crystal fragment up to 2.0 mm in length.
Fig. 2.EDS analysis of meliphanite.
Fig. 3.(a) Raman spectrum of Meliphanite over the 100–4000 cm 1spectral range
and (b) infrared spectrum of Meliphanite over the 500–4000 cm1spectral range.
Fig. 4.(a) Raman spectrum of Meliphanite over the 800–1400 cm 1spectral range
calculated the Raman spectrum for these types of silicate networks
and predicted two bands at around 1040 and 1070 cm 1with an
additional band at around 600 cm 1. In this work we find the
Raman bands at 1050 and 1095 cm 1in agreement with the work
of Dowty. In this work we have an additional Raman band at 1016 cm 1. It is suggested that this band is due to AlOH vibrations.
The infrared spectrum over the 750–1150 cm 1spectral range is
reported inFig. 4b. The infrared spectrum is quite broad and may be resolved into component bands at 799, 815, 852, 879, 929, 968, 1000, 1026, 1054 and 1082 cm 1. These bands are assigned
to SiO and AlO stretching vibrations.
The Raman spectrum of meliphanite over the 350–850 cm 1
spectral range is shown inFig. 5a. The spectrum shows complexity. Intense Raman bands are observed at 472, 625, 666, 721 and 774 cm 1and are assigned to OSiO and OAlO bending vibrations.
Bands of lesser intensity are observed at 382, 421, 510, 534, 555
and 611 cm 1. These bands may also be attributed to the OSiO
and OAlO bending vibrational modes. Some of these bands may be assigned to FAlF bending modes. In order to sort out the exact assignment of these bands, it is necessary to undertake theoretical calculations to determine the exact position of the bands. Such work is beyond the scope of this research. The Raman spectrum of meliphanite over the 100–350 cm 1spectral range is shown in
Fig. 5b. Raman bands are found at 113, 147, 180, 207, 258 and 285 cm 1. These bands are simply described as lattice vibrations.
The question arises as to where bands that might be assigned to BeO and OBeO vibrations. Because of the low atomic mass of Be, these bands are predicted to occur at higher wavenumbers.
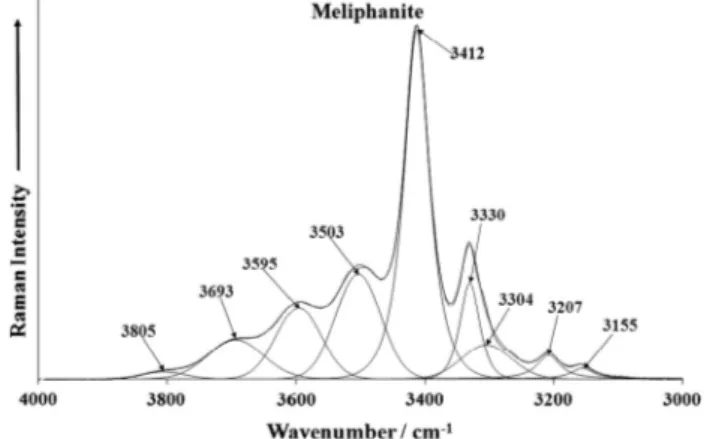
The formula of meliphanite is such that there are OH units involved in the structure [(Ca,Na)2Be[(Si,Al)2O6(F,OH)]. With such
a formula, it could be expected that there would be spectra observed in the hydroxyl stretching region. This is the case for
the Raman spectrum as may be observed inFig. 6; however, no
intensity in the infrared spectrum was observed. This is somewhat of a conundrum. The Raman spectrum of meliphanite over the
3000–4000 cm 1 spectral range shows a series of Raman bands
with different intensities.
The most intense band is observed at 3412 cm 1and is assigned
to the stretching vibration of OH units. Other Raman bands of les-ser intensity are obles-served at 3155, 3207. Other Raman bands of lesser intensity are observed at 3155, 3207, 3304, 3330 cm 1 on
the lower wavenumber side of the 3412 cm 1band. Raman bands
on the higher wavenumber side are noted at 3503, 3595, 3693 and 3805 cm 1. The observation of multiple Raman bands in this
spec-tral region supports the concept of the wide variability of hydrogen bonding of these OH units. Raman bands are observed at 3155, 3207, 3330, 3503, 3595 and 3693 cm 1. It is difficult to assign all
these bands simply to the stretching vibrations of the OH units. It is possible that some of these bands are due to AlF or SiF stretch-ing bands. The higher wavenumber bands may be due to SiOH stretching vibrations.
Conclusions
The mineral meliphanite (Ca,Na)2Be[(Si,Al)2O6(F,OH)] is related
to the minerals melitite, leucophanite and gugiaite. Chemical anal-ysis using the EDS technique combined with Raman spectroscopy suggest that the studied sample is an intermediate member of a series between meliphanite and an OH-rich unknown member. Be is not detected using the EDS technique. Fundamentally the mineral is a type of calcium silicate.
Raman spectroscopy identifies bands in the 3000–4000 cm 1
spectral region. Multiple bands are observed and are assigned to the stretching vibration of the OH units in the meliphanite
struc-ture. The most intense Raman band is found at 3412 cm 1. The
observation of a multiplicity of Raman bands supports the concept of a wide variation in the hydrogen bonding of these OH units.
A series of Raman bands at 932, 968, 991, 1016 and 1050 cm 1
are assigned to the stretching vibrations of the SiO units. Raman
bands at 870 and 893 cm 1 together with the infrared bands at
799 and 815 cm 1are attributed to hydroxyl deformation modes.
Multiple Raman bands are observed in the 350–850 cm 1spectral
region. Raman bands at 625, 636, 666, 721, 745 and 774 are assigned to OSiO bending vibrations. Raman spectroscopy enables the characterization of the vibrational spectrum of meliphanite and may be applied to several related minerals.
Acknowledgements
The financial and infra-structure support of the Discipline of Nanotechnology and Molecular Science, Science and Engineering
Fig. 5.(a) Raman spectrum of Meliphanite over the 300–800 cm 1spectral range
and (b) Raman spectrum of Meliphanite over the 100–300 cm1spectral range.
Fig. 6.Raman spectrum of Meliphanite over the 3000–4000 cm1spectral range.
Faculty of the Queensland University of Technology, is gratefully acknowledged. The Australian Research Council (ARC) is thanked for funding the instrumentation. The authors would like to acknowledge the Center of Microscopy at the Universidade Federal de Minas Gerais (http://www.microscopia.ufmg.br) for providing the equipment and technical support for experiments involving electron microscopy.
Appendix A. Supplementary material
Supplementary data associated with this article can be found, in the online version, athttp://dx.doi.org/10.1016/j.saa.2014.09.018.
References
[1]A.D. Negro, G. RossI, L. Ungaretti, Acta Cryst. 23 (1967) 260. [2]S.T. Badalov, Dokl. Akad. (1960) 15–16.
[3]I.V. Bel’kov, A.P. Denisov, Mat. Min. Kol’skogo Pol. 6 (1968) 221–224. [4]H.I. Jensen, Proc. Linnean Soc. N.S. Wales 32 (1908) 557–626. [5]J.D. Grice, F.C. Hawthorne, Can. Min. 40 (2002) 971–980. [6]W.H. Zachariasen, Zeit. Krist. 74 (1930) 226–229.
[7]H. Friis, A.A. Finch, C.T. Williams, Phys. Chem. Miner. 38 (2011) 45–57. [8]M. Fleischer, Am. Miner. 48 (1963) 211–212.
[9]C.L. Knight, M.A. Williamson, R.J. Bodnar, Microbeam Analysis (San Francisco) 24 (1989) 571–573.
[10]I.A. Belitskii, G.A. Golubova, Mater. Geneticheskoi i Eksperimental’noi Min. 7 (1972) 310–323.
[11]F. Pechar, D. Rykl, Casopis pro Min. Geol. 26 (1981) 143–156. [12]E. Libowitzky, Monatsh. Chem. 130 (1999) 1047–1059. [13]W. Pilz, Acta Phys. Hung. 61 (1987) 27–30.
[14]L. Ancillotti, E.M. Castellucci, M. Becucci, Proc. of SPIE-Int. Soc. Opt. Eng. 5850 (2005) 182–189.
[15]E. Dowty, Phys. Chem. Miner. 14 (1987) 542–552. [16]E. Dowty, Phys. Chem. Miner. 14 (1987) 122–138. [17]E. Dowty, Phys. Chem. Miner. 14 (1987) 80–93.
[18]Y. Okada, H. Shibasaki, T. Masuda, Onoda Kenkyu Hokoku 45 (1994) 126–141. [19]A. Winkler, W. Wieker, Zeit. Chem. 18 (1978) 375–376.
[20]A.E. Zadov, N.V. Chukanov, N.I. Organova, O.V. Kuz’mina, D.I. Belokovskii, M.A. Litsarev, V.G. Nechai, F.S. Sokolovskii, Zapiski Vserossiiskogo Miner. Obshchestva 130 (2001) 26–40.
[21]R.L. Frost, Y. Xi, Spectrochim. Acta A117 (2014) 428–433.
[22]R.L. Frost, R. Scholz, A. Lopez, Y. Xi, L.M. Graca, J. Mol. Struct. 1059 (2014) 20– 26.
[23]R.L. Frost, R. Scholz, A. Lopez, Y. Xi, Raman spectroscopy of the arsenate minerals maxwellite and in comparison with tilasite, Spectrochim. Acta, Part A (2014) (Ahead of Print).
[24]R.L. Frost, A. Lopez, Y. Xi, R. Scholz, A.L. Gandini, A vibrational spectroscopic study of the silicate mineral ardennite-(As), Spectrochim. Acta, Part A (2014) (Ahead of Print).