Raman and infrared spectroscopic characterization of the phosphate
mineral paravauxite Fe
2+
Al
2
(PO
4
)
2
(OH)
2
8H
2
O
Ray L. Frost
a,⇑, Ricardo Scholz
b, Andrés Lópes
a, Yunfei Xi
a, Zˇeljka Zˇigovecˇki Gobac
c,
Laura Frota Campos Horta
ba
School of Chemistry, Physics and Mechanical Engineering, Science and Engineering Faculty, Queensland University of Technology, GPO Box 2434, Brisbane, Queensland 4001, Australia
bGeology Department, School of Mines, Federal University of Ouro Preto, Campus Morro do Cruzeiro, Ouro Preto, MG 35400-00, Brazil c
Institute of Mineralogy and Petrography, Department of Geology, Faculty of Science, University of Zagreb, Horvatovac 95, 10000 Zagreb, Croatia
h i g h l i g h t s
Paravauxite is a rare phosphate mineral of formula
Fe2+Al
2(PO4)2(OH)28H2O.
Chemically, it is closely related to its basic namesake vauxite.
Another chemically closely related mineral is metavauxite a dimorph of paravauxite.
We have analysed this mineral using EDX analyses.
The mineral has been studied by vibrational spectroscopy.
g r a p h i c a l
a b s t r a c t
a r t i c l e
i n f o
Article history:
Received 17 June 2013
Received in revised form 15 July 2013 Accepted 22 July 2013
Available online 2 August 2013
Keywords:
Paravauxite Phosphate Raman spectroscopy Infrared spectroscopy
a b s t r a c t
We have undertaken a vibrational spectroscopic study of paravauxite the Siglo XX mine, Bustillo Prov-ince, northern of Potosí department, Bolivia. This mine is important source for rare and unusual second-ary phosphate minerals and is the type locality for a number of rare phosphates such as vauxite, sigloite, metavauxite and for jeanbandyite. The chemical formula of the studied sample was determined as
Fe2þ 0:95
;ðAl0:07ÞR1 :02ð
AlÞ2:09ð
PO4Þ1:97ð
OHÞ1:98
7:90ðH2OÞ.
The Raman spectrum is dominated by an intense Raman band at 1020 cm1assigned to the PO3 4 m1
symmetric stretching mode. Low intensity Raman bands found at 1058, 1115 and 1148 cm1are assigned
to the PO3
4 m3antisymmetric stretching vibrations. Raman bands of paravauxite at 537, 570, 609 and
643 cm1are assigned to the
m4PO34bending modes whilst the Raman bands at 393 and 420 cm1 are due to them2PO34bending modes. The Raman spectral profile of paravauxite in the hydroxyl stretch-ing region is broad with component bands resolved at 3086, 3215, 3315, 3421, 3505 and 3648 cm1.
Vibrational spectroscopy enables the assessment of the molecular structure of paravauxite to be undertaken.
Ó2013 Elsevier B.V. All rights reserved.
Introduction
Paravauxite is a rare phosphate mineral of formula Fe2+Al 2
(-PO4)2(OH)28H2O which occurs in hydrothermal tin veins, and also
in complex granite pegmatites[1]. It was discovered as a new
mineral on wavellite crystals at the tin mines of Llallagua, Bolivia
[2]. Paravauxite is a triclinic mineral with a= 5.233, b= 10.541,
c= 6.962 Å,
a
= 106.9°, b= 110.8°,c
= 72.1°, space group P1 and Z= 1 [3]. Chemically, it is closely related to its basic namesake vauxite [4,5], and appears to be different from vauxite only in the number of water molecules in the structure. Paravauxite has eight water molecules while vauxite has only six in its formula. Another chemically closely related mineral is metavauxite which1386-1425/$ - see front matterÓ2013 Elsevier B.V. All rights reserved. http://dx.doi.org/10.1016/j.saa.2013.07.048
⇑ Corresponding author. Tel.: +61 7 3138 2407; fax: +61 7 3138 1804.
E-mail address:r.frost@qut.edu.au(R.L. Frost).
Contents lists available atScienceDirect
Spectrochimica Acta Part A: Molecular and
Biomolecular Spectroscopy
is a dimorph of paravauxite. In this case, the structure of paravauxite is triclinic[3]while the structure of metavauxite[8]
is monoclinic in symmetry. Other members of the stewartite min-eral group[7], in which paravauxite belongs, are gordonite MgAl2
(-PO4)2(OH)28H2O [8], kastningite (Mn2+,Fe2+,Mg)Al2(PO4)2(OH)2
8H2O [9,10], laueite Mn2þFe32þðPO4Þ2ðOHÞ28H2O [11,12]
man-gangordonite (Mg2+,Fe2+,Mg)Al
2(PO4)2(OH)28H2O [8,15], sigloite
Fe3+Al
2(PO4)2(OH)37H2O [16,17], stewartite MnFe23þðPO4Þ2ðOHÞ2
8H2O[13]and ushkovite MgFe32þðPO4Þ2ðOHÞ28H2O[19–21].
As paravauxite is isostructural with laueite Mn2þFe3þ 2 ðPO4Þ2
ðOHÞ28H2O [3,12,14], it could be indirectly concluded that the
structure of paravauxite is based on an infinite chain of vertex-linked oxygen octahedra, with Al occupying the octahedral centres, the chain oriented parallel to thec-axis. Chains are in turn con-nected to others by PO4tetrahedra which also bridge through
iso-lated octahedra (with Fe2+ as centres). The laueite structural
formula is Mn2þFe3þ
2 ðOHÞ2ðPO4Þ2ðH2OÞ62H2O[12], and according
to analogy, the paravauxite structural formula is then Fe2+Al 2
(-OH)2(PO4)2(H2O)62H2O and the non-octahedrally bonded waters
appearing in a cavity left in the structure. In detailed description, in analogy with laueite structure[14], the chains of Al-octahedra decorated by flanking PO3
4 groups (which extend inc-direction)
meld in the a-direction by sharing one quarter of the flanking PO4vertices with octahedra of adjacent chains to form an [Al2
(-PO4)2(OH)2(H2O)2] sheet. In the resulting sheet, the PO4tetrahedra
are three-connected. There are two distinct octahedra in these sheets, one of which is six-connected within the sheet, and the other of which is only four-connected and has (H2O) at two
verti-ces. From another view, it could be also described that paravauxite sheet is composed of [Al(PO4)2O2] chains that are linked by (AlO6)
octahedra. These sheets stack in theb-direction and are linked by (Fe2+O
2H2O4 octahedra, and by hydrogen bonds involving the
interstitial (H2O) groups bonded to Fe2+ and interstitial (H2O)
groups held in the structure solely by hydrogen bonds.
Raman spectroscopy has proven most useful for the study of mineral structures. The objective of this research is to report the Raman and infrared spectra of paravauxite and to relate the spectra to the molecular structure of the mineral. The number of paravaux-ite occurrences is limparavaux-ited. This is the first report of a systematic study of paravauxite from Bolivia.
Experimental
Samples description and preparation
The paravauxite sample studied in this work was collected by one of the authors (Scholz) from the Siglo XX mine (also named Siglo Veinte, Catavi or Llallagua), a tin deposit located in the Andes Mountain, Bustillo Province, northern of Potosí department, Bolivia. In the middle of the 20th century Siglo XX was the most productive tin mine in the world. The mine is also an important source for rare and unusual secondary phosphate minerals and is the type locality for a number of rare phosphates such as vauxite, sigloite, metav-auxite and for jeanbandyite. The host rock is a conical subvolcanic stock of Tertiary age and the ore deposit is made up of porphyry and porphyry breccia. Llallagua’s stock is heavily altered, almost all of the original feldspar in the volcanic rock has been replaced by quartz, sericitic muscovite, clay tourmaline, pyrite and other minerals. The intrusion was sericitized, tourmalinized and silicified before any of the ores were deposited. Prior silicification of the wall rocks prevented the ore forming solutions from penetrating and replacing the porphyry, so the bulk of the ore was deposited in the open shear zones and fissures[22]. The first depositional stage of the veins is represented by quartz, tourmaline, bismuthinite and cassiterite, with minor wolframite and fluorapatite. The various phosphates, most abundantly wavellite, were formed in the final
stages of hydrothermal deposition, and were derived mostly from decomposition of primary fluorapatite[22].
In the Siglo XX mine, colorless to light blue paravauxite aggre-gates of crystals up to 3.0 mm in length mainly occur in association with eosphorite. Other secondary phosphates such as wavellite, metavauxite, vauxite, crandallite and childrenite also can be found in association. The sample was incorporated to the collection of the Geology Department of the Federal University of Ouro Preto, Minas Gerais, Brazil, with sample code SAB-006B. The sample was gently crushed and the associated minerals were removed under a stereo-microscope Leica MZ4.
Scanning electron microscopy (SEM)
Experiments and analyses involving electron microscopy were performed in the Center of Microscopy of the Universidade Federal de Minas Gerais, Belo Horizonte, Minas Gerais, Brazil (http:// www.microscopia.ufmg.br).
Paravauxite crystal aggregate was coated with a 5 nm layer of evaporated Au. Secondary electron and backscattering electron images were obtained using a JEOL JSM-6360LV equipment. Qual-itative and semi-quantQual-itative chemical analysis in the EDS mode were performed with a ThermoNORAN spectrometer model Quest and was applied to support the mineral characterization.
Electron probe micro-analysis (EPMA)
The quantitative chemical analysis of paravauxite single crys-tals was carried out using EPMA, with a Jeol JXA8900R spectrome-ter from the Physics Department of the Federal University of Minas Gerais, Belo Horizonte. The sample was embedded in epoxy resin and after polishing, coated with a thin layer of evaporated carbon. The electron probe microanalysis in the WDS (wavelength disper-sive spectrometer) mode was obtained at 15 kV accelerating volt-age and beam current of 10 nA. For each selected element was used the following standards: Fe – magnetite, Mg – MgO, Mn – rhodonite, P and Ca - Ca2P2O7, Al – Corundum, Na – Albite100
and F – Fluorite. Chemical formula was calculated on the basis of 18 oxygen atoms.
Raman microprobe spectroscopy
Crystals of paravauxite were placed on a polished metal surface on the stage of an Olympus BHSM microscope, which is equipped with 10, 20, and 50 objectives. The microscope is part of a Renishaw 1000 Raman microscope system, which also includes a monochromator, a filter system and a CCD detector (1024 pixels). The Raman spectra were excited by a Spectra-Physics model 127 He–Ne laser producing highly polarized light at 633 nm and col-lected at a nominal resolution of 2 cm1 and a precision of
±1 cm1in the range between 200 and 4000 cm1. Repeated
acqui-sitions on the crystals using the highest magnification (50) were accumulated to improve the signal to noise ratio of the spectra. Ra-man Spectra were calibrated using the 520.5 cm1line of a silicon
wafer. The Raman spectrum of at least 10 crystals was collected to ensure the consistency of the spectra.
A Raman spectrum of paravauxite is given in the supplementary information as Fig. S1. This spectrum was downloaded from the RRUFF data base (http://www.rruff.info/Paravauxite/R040179). Both polarized and depolarized spectra are provided. The mineral sample studied in the RRUFF data base also originated from Mina Siglo XX, Llallagua, Bolivia.
Infrared spectroscopy
Infrared spectra were obtained using a Nicolet Nexus 870 FTIR spectrometer with a smart endurance single bounce diamond ATR cell. Spectra over the 4000-525 cm1 range were obtained
by the co-addition of 128 scans with a resolution of 4 cm1and a
mirror velocity of 0.6329 cm/s. Spectra were co-added to improve
the signal to noise ratio. The infrared spectra are given in Supple-mentary information.
Spectral manipulation such as baseline correction/adjustment and smoothing were performed using the Spectracalc software package GRAMS (Galactic Industries Corporation, NH, USA). Band component analysis was undertaken using the Jandel ‘Peakfit’ soft-ware package that enabled the type of fitting function to be se-lected and allows specific parameters to be fixed or varied accordingly. Band fitting was done using a Lorentzian–Gaussian cross-product function with the minimum number of component bands used for the fitting process. The Gaussian–Lorentzian ratio was maintained at values greater than 0.7 and fitting was under-taken until reproducible results were obtained with squared corre-lations ofr2greater than 0.995.
Results and discussion
Chemical characterization
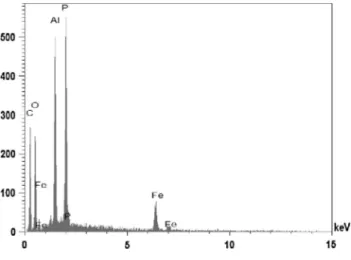
The SEM image of paravauxite sample studied in this work is shown inFig. 1. The image shows a paravauxite cleavage fragment with tabular habitus. No other mineral phase or zonation are ob-served. Qualitative chemical analysis shows Fe, P and Al as the dominant elements (Fig. 2). Quantitative chemical analysis via EMP allowed us to determine the chemical formula of the studied sample that can be written as:
ðFe2þ
0:95;Al0:07ÞR1
:02ðAlÞ2:09ðPO4Þ1:97ðOHÞ1:987:90ðH2OÞ
Vibrational spectroscopy
Background
Interestingly Farmer in his book on the infrared spectra of min-erals divided the vibrational spectra of phosphates according to the presence, or absence of water and hydroxyl units in the minerals
[23]. In aqueous systems, Raman spectra of phosphate oxyanions show a symmetric stretching mode (
m
1) at 938 cm1, theantisym-metric stretching mode (
m
3) at 1017 cm1, the symmetric bendingmode (
m
2) at 420 cm1 and them
4 mode at 567 cm1 [24–26].Farmer reported the infrared spectra of berlinite (AlPO4) with
PO4stretching modes at 1263, 1171, 1130 and 1114 cm1; bending
modes at 511, 480, 451, 379 and 605 cm1. Al–O modes were
found at 750, 705, 698 and 648 cm1. On hydration of the mineral
as with variscite (AlPO42H2O), PO4stretching modes were found
at 1160, 1075, 1050 and 938 cm1; bending modes at 515, 450
and 420 cm1; in addition H
2O stretching bands were found at
3588, 3110, 2945 cm1. For the mineral augelite (AlPO 4(OH)3),
infrared bands were observed at 930 (
m
1), 438 (m
2), 1205, 1155,1079, 1015 (
m
3) and 615, 556 cm1(m
4). For augelite, OH stretchingmodes were not observed.
Spectroscopy
The Raman spectrum of paravauxite over the 100–4000 cm1
spectral range is displayed inFig. 3a. This spectrum shows the po-sition and relative intensity of the Raman bands. There are large parts of the spectrum where no or little intensity is observed. Thus, the spectrum is divided into subsections depending upon the type of vibration being studied. The infrared spectrum of paravauxite over the 600–4000 cm1spectral range is displayed inFig. 3b. As
Fig. 1.Backscattered electron image (BSI) of a paravauxite single crystal up to 1.0 mm in length.
Fig. 2.EDS analysis of paravauxite.
Fig. 3.(a) Raman spectrum of paravauxite over the 100–4000 cm1spectral range.
(b) Infrared spectrum of paravauxite over the 500–4000 cm1spectral range.
for the Raman spectrum, there are large parts of the spectrum where no intensity is observed and therefore the spectrum is sub-divided into sections based upon the type of vibration being examined.
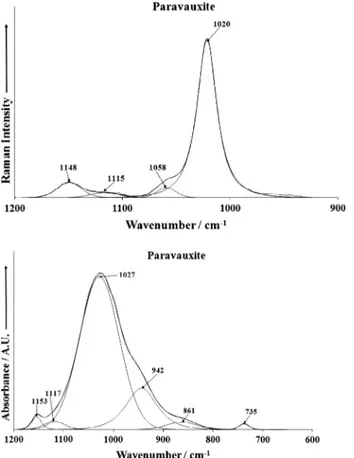
The Raman spectrum of paravauxite over the 900–1200 cm1
spectral range is reported inFig. 4a. This spectrum is dominated by an intense Raman band at 1020 cm1which is assigned to the
PO3
4
m
1symmetric stretching mode. Low intensity Raman bandsare found at 1058, 1115 and 1148 cm1and are assigned to the
PO3
4
m
3antisymmetric stretching vibrations. In the Ramanspec-trum of paravauxite given in the RRUFF data base, an intense Ra-man band is observed at 991 cm1.
The infrared spectrum over the 600–1200 cm1spectral range
is shown in Fig. 4b. The spectrum shows a broad profile which may be resolved into component bands. Infrared bands are ob-served at 1027, 1117 and 1153 cm1 and are assigned to the
PO3
4
m
3antisymmetric stretching vibrational mode. Other infraredbands are found at 735, 861 and 942 cm1. The first band may be
attributed to water vibrational mode. The latter two bands are likely due to hydroxyl deformation modes.
A comparison may be made with spectra of other aluminum containing phosphate minerals such as augelite [27] and tur-quoise[28]. In the Raman spectrum of augelite, an intense band is observed at 1108 cm1. The band is very sharp with a band
width of 7.0. This band is assigned to the
m
1symmetric stretch-ing mode. Breitstretch-inger et al. assigned a band at 1108 cm1forsyn-thetic augelites to this mode. The position is in sharp contrast to the value of 930 cm1published by Farmer[23]. In the infrared
spectrum the band at 1070 cm1 is assigned to this mode. In
the infrared spectrum bands of augelite are observed at 1204, 1171, 1142, 1102, 1070 and 1016 cm1. The position of these
bands may be compared with those reported by Farmer. Bands
were given as 1205, 1155, 1079 and 1015 cm1. The three higher
wavenumber bands (1204, 1171, 1142 cm1) are attributed to
the
m
3antisymmetric PO4stretching vibrations. An intense bandis observed at 1160 with a resolved component band at 1136 cm1which may be attributed to these vibrational modes.
For the turquoise from Senegal, Raman bands are observed at 1182, 1161 and 1104 cm1. Six bands are predicted from group
theory, but are not observed and this is attributed to accidental degeneracy. The two sets of Raman bands from the two indepen-dent phosphate units overlap. In the infrared spectrum of tur-quoise, the three higher wavenumber bands at 1195, 1161 and 1109 cm1 are ascribed to the
m
3 antisymmetric stretching
vibrations.
The Raman spectra of paravauxite in the 300–800 cm1 and
100–300 cm1spectral ranges are shown inFig. 5a and b. The first
spectrum displays a series of overlapping Raman bands. This spec-trum may be subdivided into sections. The first section is the 600– 800 cm1spectral region, the second section is the bands around
500 cm1 and the third section is the bands between 300 and
400 cm1. Raman bands at 537, 570, 609 and 643 cm1 are
as-signed to the
m
4PO34 bending modes. The Raman bands at 393and 420 cm1are due to the
m
2PO34bending modes. In the RRUFF
Raman spectrum, a Raman band at 589 cm1is shown and is
as-signed to the
m
4PO34 bending mode (please see Fig. S1). An intense
Raman band in the RRUFF spectrum is found at 430 cm1and this
band is assigned to the
m
2PO34bending modes.Raman bands are found at 299, 319 and 353 cm1 and are
attributed to MO vibrations. In the Raman spectrum of paravauxite in the RRUFF data base, Raman bands are observed at 133, 211, 232 and 283 cm1. Breitinger et al.[29]reported low intensity bands
for synthetic augelite at 750 and 530 cm1which were assigned
to the
m
(Al(O/OH)n) modes. The Raman spectrum displays aFig. 4.(a) Raman spectrum of paravauxite over the 800–1400 cm1spectral range.
(b) Infrared spectrum of paravauxite over the 500 to 1300 cm1spectral range. Fig. 5.(a) Raman spectrum of paravauxite over the 300–800 cm
1spectral range.
(b) Raman spectrum of paravauxite over the 100 to 300 cm1spectral range.
number of bands at 110,148,164, 196, 214 and 227 cm1. These
bands are simply described as lattice vibrations.
In the Raman spectrum of augelite, an intense band is ob-served at 635 cm1with component bands at 643 and 615 cm
1-and are assigned to the
m
4PO4mode. In the infrared spectrum ofaugelite, the band at 645 cm1is assigned to this
m
4PO4bending
mode. In the Raman spectrum bands are observed at 467, 439, 419 and 407 cm1. These bands are attributed to the
m
2bending
modes of the PO4units. The Raman spectra of turquoise in the
500–700 cm1 spectral range are complex with a significant
number of overlapping bands. This spectral region is where the
m
4phosphate bending modes are expected. For turquoise Ramanbands are observed at 643, 593, 570 and 550 cm1. The results of
FGA show that at least two phosphate bending modes would be expected. With loss of degeneracy this number would be ex-pected to increase. For the turquoise from Senegal, Raman bands are observed at 484, 468, 439 and 419 cm1. For the mineral
chalcosiderite two strong bands are observed at 445 and 397 cm1.
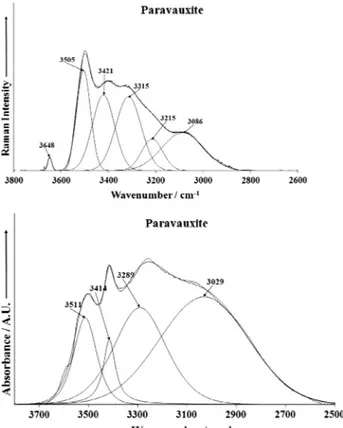
The Raman spectrum of paravauxite over the 2600–3800 cm1
spectral range is reported inFig. 6a. The Raman spectral profile is broad with component bands resolved at 3086, 3215, 3315, 3421, 3505 and 3648 cm1. The chemistry of paravauxite Fe2+Al
2
(-PO4)2(OH)28H2O is such that both water and hydroxyl units are
noted. Thus, it would be expected that bands due to both these units would be observed. The ratio of the hydroxyl to water OHs is 2/16. Thus, the intensity of the water stretching vibrations is expected to be intense. The first 4 bands are assigned to water vibrations. The band at 3648 cm1is attributed to the stretching
vibration of the hydroxyl units. Bands which may be assigned to water molecules normally occur at lower wavenumbers than the stretching bands of the OH units. It is noted that this band is ab-sent in the infrared spectrum. The band at 3505 cm1 could be
assigned either way but the assignment to a water stretching vibration is more likely. The infrared spectrum of paravauxite in the 2500–3800 cm1spectral range is shown inFig. 6b. Infrared
bands are observed at 3029, 3289, 3414 and 3511 cm1. These
infrared bands are attributed to water stretching vibrations. Hy-droxyl stretching vibrations are more readily observed in the Ra-man spectrum and the water stretching bands are very readily observed in the infrared spectrum as water is a very strong infra-red absorber.
A comparison may be made with the OH stretching region of senagalite. Intense very sharp Raman bands are observed at 3505 and 3610 cm1 with shoulders on the high wavenumber side at
3507 and 3614 cm1. These bands are attributed to OH stretching
vibrations. The series of low intensity Raman bands are observed at 3099, 3206, 3270, 3339, 3374 and 3429 cm1and are assigned to
water stretching vibrations. In the infrared spectrum, bands are ob-served at 3490 and 3609 cm1with shoulder bands at 3502 and
3603 cm1. These bands are ascribed to the stretching vibrations
of the hydroxyl units. Intense infrared bands are found at 3061, 3089, 3211, 3261, 3332 and 3424 cm1and are assigned to water
stretching vibrations.
The Raman spectrum of paravauxite in the 1400–1800 cm1
spectral range is illustrated inFig. 7a; even though the spectrum suffers from a lack of signal, three bands may be resolved ay 1490, 1582 and 1639 cm1. The last band is assigned to the water
bending modes. The infrared spectrum over the 1400–1800 cm1
spectral range is shown in Fig. 7b. Three infrared bands are re-solved at 1505, 1592 and 1640 cm1. This last band is ascribed to
water bending modes. The other bands may be due to hydroxyl deformation vibrations.
Fig. 6.(a) Raman spectrum of paravauxite over the 2600–4000 cm1spectral range.
(b) Infrared spectrum of paravauxite over the 2600–4000 cm1spectral range.
Fig. 7.(a) Raman spectrum of paravauxite over the 1300–1800 cm1spectral range.
(b) Infrared spectrum of paravauxite over the 1300–1800 cm1spectral range.
Conclusions
As paravauxite is isostructural with laueite Mn2þFe3þ 2
ðPO4Þ2ðOHÞ28H2O[13], it could be indirectly concluded that the
structure of paravauxite is based on an infinite chain of vertex-linked oxygen octahedra, with Al occupying the octahedral centres, the chain oriented parallel to thec-axis. Chains are in turn con-nected to others by PO4tetrahedra which also bridge through
iso-lated octahedra (with Fe2+as centres). Chemically, paravauxite is
closely related to its basic namesake vauxite[5,6], and appears to be different from vauxite only in the number of water molecules in the structure. Paravauxite has eight water molecules while vauxite has only six in its formula.
The paravauxite sample studied in this work is from the type locality, the Siglo XX mine. The chemical formula calculated on the basis of EMP analysis can be written as
ðFe20:þ95;Al0:07ÞR1
:02ðAlÞ2:09ðPO4Þ1:97ðOHÞ1:987:90ðH2OÞ:
A combination of Raman spectroscopy at ambient temperatures complimented with infrared spectroscopy has been used to char-acterize the phosphate mineral paravauxite. The Raman spectrum is dominated by an intense Raman band at 1020 cm1assigned to
the PO3
4
m
1 symmetric stretching mode. Low intensity Ramanbands found at 1058, 1115 and 1148 cm1 are assigned to the
PO3
4
m
3 antisymmetric stretching vibrations. Raman bands ofparavauxite at 537, 570, 609 and 643 cm1are assigned to the
m
4PO3
4 bending modes whilst the Raman bands at 393 and
420 cm1are due to the
m
2PO34bending modes. The Raman
spec-tral profile of paravauxite in the hydroxyl stretching region is broad with component bands resolved at 3086, 3215, 3315, 3421, 3505 and 3648 cm1. Assignment of these bands is
some-what difficult. The bands are assigned to water and hydroxyl unit stretching vibrations (seeTable 1).
Acknowledgments
The financial and infra-structure support of the Discipline of Nanotechnology and Molecular Science, Science and Engineering Faculty of the Queensland University of Technology, is gratefully acknowledged. The Australian Research Council (ARC) is thanked for funding the instrumentation. The authors would like to acknowledge the Center of Microscopy at the Universidade Federal de Minas Gerais (http://www.microscopia.ufmg.br) for providing the equipment and technical support for experiments involving electron microscopy. R. Scholz thanks to CNPq – Conselho Nacional
de Desenvolvimento Científico e Tecnológico (Grant No. 306287/ 2012-9). Zˇ. Zˇigovecˇki Gobac thanks to Ministry of Science, Educa-tion and Sports of the Republic of Croatia, under Grant No. 119-0000000-1158. L.F.C. Horta thanks to PET/Geologia/UFOP.
Appendix A. Supplementary material
Supplementary data associated with this article can be found, in the online version, athttp://dx.doi.org/10.1016/j.saa.2013.07.048.
References
[1]J.W. Anthony, R.A. Bideaux, K.W. Bladh, M.C. Nichols, Arsenates, Phosphates, Vanadates, vol. IV, Mineral Data Publishing, Tucson, 2000.
[2]S.G. Gordon, Science 56 (1922) 50.
[3]W.H. Baur, Neues Jahrb. Min. (1969) 430–433. [4]S.G. Gordon, Am. Min. 7 (1922) 108.
[5]S.G. Gordon, Proc. Acad. Nat. Sci. Phila. 75 (1923) 261–270. [6]W.H. Baur, R.R. Rao, Naturwissenschaften 54 (1967) 561.
[7]M.E. Back, J.A. Mandarino, Fleischer’s Glossary of Mineral Species, The Mineralogical Record Inc, Tucson, 2008.
[8]P.B. Leavens, A.L. Rheingold, Neues Jahrb. Min. (1988) 265–270.
[9]J. Schlüter, K.-H. Klaska, K. Friese, G. Adiwidjaja, Neues Jahrb. Min. (1999) 40– 48.
[10]G. Adiwidjaja, K. Friese, K.-H. Klaska, J. Schlüter, Zeit. Krist. 214 (1999) 465– 468.
[11]H. Strunz, Naturwissenschaften 41 (1954) 256. [12]P.B. Moore, Am. Min. 50 (1965) 1884–1892.
[13]P.B. Moore, Laueite, Neues Jahrb. Min. 123 (1975) 148–159.
[14] D.M.C. Huminicki, F. C. Hawthorne, The crystal chemistry of the phosphate minerals, in: Paul H. Ribbe (Ed.), Reviews in Mineralogy and Geochemistry, Phosphates. Geochemical, geobiological and materials importance. 2002. [15]P.B. Leavens, J.S. White, G.W. Robinson, J.A. Nelen, Neues Jahrb. Min. (1991)
169–176.
[16]R.L. Frost, Y. Xi, R. Scholz, F.M. Belotti, M. Candido Filho, J. Mol. Struct. 1033 (2013) 258–264.
[17]C.S. Hurlbut Jr., R. Honea, Am. Min. 47 (1962) 1–8.
[19]B.V. Chesnokov, V.A. Vilisov, G.E. Cherepivskaya, M.G. Gorskaya, Zapiski Vsesoyuznogo Mineralogicheskogo Obshchestva 112 (1983) 42–46. [20]P.J. Dunn, Min. Rec. 16 (1985) 463–464.
[21]M.A. Galliski, F.C. Hawthorne, Can. Min. 40 (2002) 929–937. [22]J. Hyrsl, A. Petrov, Min. Rec. 37 (2006) 117–162.
[23] V.C. Farmer, Mineralogical Society Monograph 4: The Infrared Spectra of Minerals, London, 1974.
[24]R.L. Frost, W. Martens, P.A. Williams, J.T. Kloprogge, Min. Mag. 66 (2002) 1063– 1073.
[25]R.L. Frost, W.N. Martens, T. Kloprogge, P.A. Williams, Neues Jahrb. Min. (2002) 481–496.
[26]R.L. Frost, P.A. Williams, W. Martens, J.T. Kloprogge, P. Leverett, J. Raman Spectrosc. 33 (2002) 260–263.
[27]R.L. Frost, M.L. Weier, J. Mol. Struct. 697 (2004) 207–211.
[28]R.L. Frost, B.J. Reddy, W.N. Martens, M. Weier, J. Mol. Struct. 788 (2006) 224– 231.
[29]D.K. Breitinger, J. Mohr, D. Colognesi, S.F. Parker, H. Schukow, R.G. Schwab, J. Mol. Struct. 563–564 (2001) 377–382.
Table 1
Chemical composition of paravauxite from the Siglo Veinte mine (mean of 10 electron microprobe analyses). H2O calculated by stoichiometry.
Constituent wt.% Range (wt.%) Number of atoms Probe standard
FeO 14.50 15.44–16.55 0.95 Magnetite
MgO 0.01 0.00–0.03 0.00 MgO
Al2O3 23.34 25.40–26.90 2.16 Al2O3
P2O5 29.59 32.33–33.60 1.97 Ca2P2O7
MnO 0.11 0.04–0.30 0.01 Rhodonite
CaO 0.00 0.03–0.07 0.00 Ca2P2O7
Na2O 0.11 0.01–0.14 0.00 Albite100
F 0.08 0.00–0.13 0.00 Fluorite
H2O 33.93 Calculated by stoichiometry H2O – 7.90 OH – 1.98
Total 101.67