Braz. J. of Develop., Curitiba, v. 3, n. 1, p. 161-177, jan./jun. 2017. ISSN 2525-8761
Spatial Dimension of Economic Growth in the Philippines:
Identifying New Areas of Growth
Dimensão espacial do crescimento econômico nas Filipinas:
Identificando Novas Áreas de Crescimento
Recebimento dos originais: 10/12/2016 Aceitação para publicação: 03/02/2017
Arianne dela Rosa Dumayas
Doctor, Division of Economics
Instituição: Facutly of Economics, Chuo University, Tokyo, Japan Endereço: 〒192-0393 Tokyo, Hachioji, Higashinakano, Japão
E-mail: ariannedumayas@gmail.com
ABSTRACT
The Philippines economy is on the upswing trend amid the global economic slowdown. Against this backdrop of prospective economic boom, it is noteworthy to explore the spatial dimension of this growth as accelerated growth comes with both the promise of shared and inclusive development as well the perils of exacerbated spatial inequality. Like many developing countries, the concentration of economic activities is skewed towards the capital region, National Capital Region (NCR) and its neighboring regions of Calabarzon and Central Luzon. However, as the Philippines is continuously embedded in dynamic and fragmented international production networks (IPN), other regions have the opportunity to catch-up. Using both regional and provincial data, this study will sketch the spatial dimension of growth and development in the Philippines and identify potential new areas of growth. To determine these potential growth areas, this study devises provincial dynamism index which is composed of economic, safety, education, health, infrastructure and governance indicators. This study has found out that while the NCR and its adjacent regions remain to be the top contributor to country’s total output, the fastest-growing region is Central Visayas which grew at an average of 14.95 percent from 2009-2013 and followed by Central Luzon and Caraga Region in Northern Mindanao. This particular finding implicitly suggests the possible diffusion of growth to other regions. The study has also found out that in terms of provincial dynamism, among the top 10 provinces which ranked the highest in all the indices, there are four provinces (Cebu, Pangasinan, Isabela, and Negros Occidental) which are not located within the peripheries of the capital. The findings of this study are useful for both policy makers and local administrators who aim to stimulate growth and development and for firms who plan to locate to areas which can satisfy their requirements and provide optimal profit.
Keywords: Economic Development. Social Development. Growth Areas. Spatial Inequality.
RESUMO
A economia das Filipinas está na tendência de crescimento em meio à desaceleração econômica global. Neste contexto de potencial boom econômico, vale a pena explorar a dimensão espacial desse crescimento, pois o crescimento acelerado vem com a promessa de um desenvolvimento
Braz. J. of Develop., Curitiba, v. 3, n. 1, p. 161-177, jan./jun. 2017. ISSN 2525-8761
compartilhado e inclusivo, bem como com os perigos da desigualdade espacial exacerbada. Como muitos países em desenvolvimento, a concentração das atividades econômicas é desviada para a região da capital, Região da Capital Nacional (NCR) e suas regiões vizinhas de Calabarzon e Luzon Central. No entanto, como as Filipinas está continuamente incorporado em dinâmicas e fragmentadas redes internacionais de produção (IPN), outras regiões têm a oportunidade de catch-up. Utilizando dados regionais e provinciais, este estudo irá esboçar a dimensão espacial do crescimento e desenvolvimento nas Filipinas e identificar potenciais novas áreas de crescimento. Para determinar estas áreas de crescimento potencial, este estudo desenvolve o índice de dinamismo provincial, que é composto por indicadores econômicos, de segurança, educação, saúde, infra-estrutura e governança. Este estudo descobriu que enquanto a NCR e suas regiões adjacentes continuam a ser o principal contribuinte para a produção total do país, a região de crescimento mais rápido é Visayas Central, que cresceu a uma média de 14,95 por cento de 2009-2013 e seguido por Central Luzon e Região de Caraga no norte de Mindanao. Este achado particular sugere implicitamente a possível difusão do crescimento para outras regiões. O estudo também descobriu que, em termos de dinamismo provincial, entre as 10 maiores províncias que classificaram o mais alto em todos os índices, existem quatro províncias (Cebu, Pangasinan, Isabela e Negros Occidental) que não estão localizadas nas periferias da capital. As conclusões deste estudo são úteis tanto para os decisores políticos e administradores locais que visam estimular o crescimento e o desenvolvimento e para as empresas que planejam localizar em áreas que podem satisfazer suas necessidades e proporcionar um lucro ideal.
Palavras-chave: Desenvolvimento Econômico. Desenvolvimento Social. Áreas De Crescimento.
Desigualdade Espacial.
1 INTRODUCTION
Growth and development do not spread evenly across geographic spaces. Some regions achieve prosperity while some regions remain poor. This uneven distribution of growth and development across geographic spaces exists everywhere, but particularly evident in developing countries like the Philippines. There is huge gap in terms of growth and development among Metro Manila and the regions in Mindanao.
This spatial pattern of growth and development is often attributed two forces of first-nature geography (Sachs, 2001) and second nature geography (Krugman, 1991). First-nature geography pertains to physical endowments and areas blessed with good location and availability of resources tends to be more affluent. Second-nature geography argues that interaction among economic agents and man-made agglomeration could also shape the spatial pattern of development.
Spatial inequality would naturally occur in the process of development, however, as what the World Development Report (2009, p.20) enunciates, “no places should be left behind mired in poverty.” Thus, actions and policies that would allow catch-up or integration of lagging regions with the leading regions are highly-needed. With the expansion of international production networks (IPN) in which the Philippines is increasingly linked, there are strong opportunities that would allow lagging regions to catch up. In order to plot out inclusive development strategies that
Braz. J. of Develop., Curitiba, v. 3, n. 1, p. 161-177, jan./jun. 2017. ISSN 2525-8761
take into consideration the spatial inequality, knowledge of the local conditions is important. Using both regional and provincial data, this study illustrates the spatial dimension of growth and development in the Philippines. This study also identifies areas which has the strong potential to grow and possible locations for business by constructing a provincial dynamism index.
The paper is organized as follows: Section 2 explains the data and methodology used; Section 3 discusses spatial inequality in the Philippines; Section 4 analyzes the characteristics of the provinces and elucidates the potential of the provinces as well as the problem that needs to be address; Section 5 concludes the paper.
2 DATA AND METHODOLOGY
2.1 DATA
The primary source of data in this study is National Statistical Office (NSO). The study used the latest data for each indicator, however, as the schedule of the survey varies, reference year is not uniform. To illustrate the spatial disparity, economic and social indicators at the regional level is used. However, for analysis and construction of provincial dynamism index, the following data that are available on the provincial level are used.
Table 1 - List of Indicators
Categories Indicators Year
Demography
Land Area 2007
Population 2010
Population density 2010
Economy
Real per capita income 2009
Wage Rate Non-Agriculture 2012
Wage Rate Agriculture 2012
Total number of banks 2012
Total bank deposits (millions) 2012
Number of Micro Small Medium Enterprise(MSME) 2011
Employment in MSME 2011
Braz. J. of Develop., Curitiba, v. 3, n. 1, p. 161-177, jan./jun. 2017. ISSN 2525-8761
Poverty Incidence among Population (%) 2012
Education
Mean Years of Schooling 2008
Literacy rate (simple literacy) 2000
Net Enrolment Ratio (NER) in Primary Education
2006-2007 Completion Rate in Primary Education
Net Enrolment Rate (NER) in Secondary Education
Completion Rate in Secondary Education
Number of Higher Education Institution(HEI) 2010
Enrollment in State Universities and Colleges(SUC)
2011-2012
Graduates in State Universities and Colleges(SUC)
2010-2011
Security
Crime Incidence (Crime per Population) 2012
Crime Solution Efficiency 2012
Traffic Accident (Traffic Accident Per Population) 2012
Weather and Climate-related risks 2010
Geophysical risk 2010
Infrastructure
Paved Road Length KMs(Road Density) 2012
Permanents Bridges Linear Meters(Bridge Density) 2013
Total Number of Airports 2010
Total Number of Ports 2012
Energized Barangay (%) 2012
Number of Telephone Lines 2012 Number of Special Economic Zones 2012
Health
Life expectancy at birth (years) 2009
Number of Household with Access to Safe Water 2011
Number of Household with Access to Sanitary Toilet 2011
Total Health Workers 2011
Number of Government Doctors 2011 Ratio of Barangay Health Station 2011
Braz. J. of Develop., Curitiba, v. 3, n. 1, p. 161-177, jan./jun. 2017. ISSN 2525-8761
Governance
Good Governance Index 2012
State of Performance 2010
Internal Revenue Allotment 2011
Total Local Sources (tax and non-tax) 2011
IRA Dependency 2012
Basic Social Welfare Spending 2013
Source: Author’s construction
2.2 METHODOLOGY
The construction of the Provincial Dynamism index is computed using various indicators that can be grouped into six categories: economics, education, health, security, infrastructure, and governance. These indicators were standardized using the formula below:
( I v I v) I vP Iv X AVE S ST (I=a, b,…e; V=1,2,3,4…n; P=P1, P2, P3…P80)
Where XIv is the value of the indicator of I of a province P; AVEIv is the mean value; and STIv is the standard deviation of the indicator I of element E.
Score of the indicator I was obtained using the formula below
(1/ ) n I Iv IvP I vP S n S
The provincial dynamism index was computed based on the formula below:
(1 / 6) e p Iv I a PD S
Principal Component Analysis (PCA) is then used to discern the similarities or difference in the set of variables and plot these variables into two-dimensional space. This representation could identify characteristics of each province, particularly, its strengths and weaknesses. The study used MS Excel and XLStat to process the data.
Braz. J. of Develop., Curitiba, v. 3, n. 1, p. 161-177, jan./jun. 2017. ISSN 2525-8761 3 SPATIAL DISPARITY IN THE PHILIPPINES
3.1 THE PHILIPPINES
The Philippines is one of the fastest-growing economy in the world. It has achieved an average growth rate 6-7 years in the last five years. This economic boom was mainly driven by the stellar growth in services sector, particularly the business processing and outsourcing(BPO) industry. The country has 100 million inhabitants which makes it the 12th most populous country in
the world.
The Philippines is an island-nation located in Southeast Asia. It has a total land area of 300,000 square kilometers and 7, 107 islands. The topography of these islands are diverse: mountains, hills, valleys, and plains. The climate is humid tropics but temperature and precipitation level differs across the islands. The Philippine is home to various ethnic groups which are speaking almost 170 different languages.
There are three main group of islands in the Philippines; Luzon, Visayas, Mindanao. The country is divided further into 17 regions, 80 provinces, 138 cities, 1,496 municipalities, and 42,025 barangays1. There were only 8 regions during the post-independence in 1956 but additional regions were created in the following decades: Metro Manila or National Capital Region in 1975; Autonomous Region of Muslim Mindanao2(ARMM) and Cordillera Administrative Region(CAR) in 1989; CARAGA in 1995; and reorganization of Region IV(Southern Tagalog) to Region IV-A (Calabarzon) and Region IV-B(MIMAROPA).
3.2 SPATIAL DISPARITY AT THE REGIONAL LEVEL
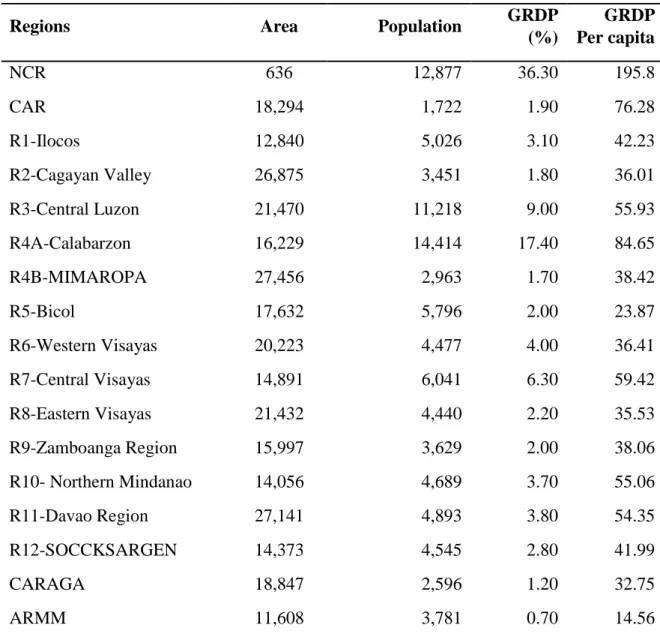
In terms of land area, Region IV-A (MIMAROPA) is the biggest region and the National Capital Region (NCR) is the smallest. NCR is the smallest region but it is the most populated region with 11.5 million packed within 636 kms. CARAGA and Region II (Cagayan Valley) are the least populated regions.
In terms of contribution to country’s total output, NCR contributes 36.3% of the total output in 2013, followed by Region IV-A Calabarzon with 17%, and Region III (Central Luzon)
1Barangay, the smallest administrative unit, is derived from the Malay word, Balangay, which means sailboat. Early inhabitants are said to have
reached the islands through these sailboats.
Braz. J. of Develop., Curitiba, v. 3, n. 1, p. 161-177, jan./jun. 2017. ISSN 2525-8761
with 9%. In the Visayas area, Central Visayas is the main contributor and in Mindanao, Northern Mindanao and Davao region are the main sources of economic output. NCR also has the highest GRDP per capita with 195,806 pesos and ARMM has the lowest with only 14,566 pesos in 2013. Most regions have evolved from agricultural-based economy to manufacturing or services-driven. Unfortunately, ARMM has yet to follow that development path as it remains to be dependent mainly on agriculture. Looking at the economic growth, Central Visayas is the fastest-growing region which grew at an average of 14.95 percent from 2009-2013, followed by Central Luzon (9.1 percent), NCR (9.85 percent) and Caraga Region (8.45 percent) in Northern Mindanao.
Table 2 - Demography and Economy
Regions Area Population GRDP
(%) GRDP Per capita NCR 636 12,877 36.30 195.8 CAR 18,294 1,722 1.90 76.28 R1-Ilocos 12,840 5,026 3.10 42.23 R2-Cagayan Valley 26,875 3,451 1.80 36.01 R3-Central Luzon 21,470 11,218 9.00 55.93 R4A-Calabarzon 16,229 14,414 17.40 84.65 R4B-MIMAROPA 27,456 2,963 1.70 38.42 R5-Bicol 17,632 5,796 2.00 23.87 R6-Western Visayas 20,223 4,477 4.00 36.41 R7-Central Visayas 14,891 6,041 6.30 59.42 R8-Eastern Visayas 21,432 4,440 2.20 35.53 R9-Zamboanga Region 15,997 3,629 2.00 38.06 R10- Northern Mindanao 14,056 4,689 3.70 55.06 R11-Davao Region 27,141 4,893 3.80 54.35 R12-SOCCKSARGEN 14,373 4,545 2.80 41.99 CARAGA 18,847 2,596 1.20 32.75 ARMM 11,608 3,781 0.70 14.56
* Land Area(sq.kms.), Population (2015) in thousand, GRDP(2013), GRDP per capita(2013) in thousand pesos
Braz. J. of Develop., Curitiba, v. 3, n. 1, p. 161-177, jan./jun. 2017. ISSN 2525-8761
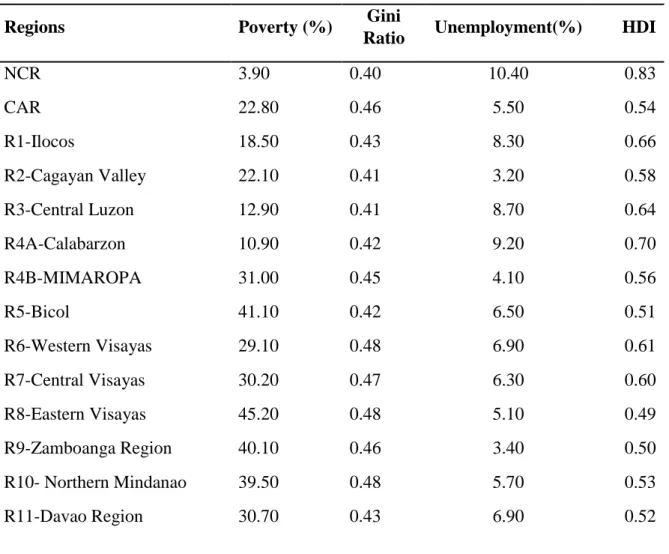
Spatial disparity persists not only in terms of economic development but also in terms of social development. The national poverty incidence is relatively high at almost 32 percent in 2012. NCR (3.90 percent) has the lowest poverty incidence in 2012, followed by Calabarzon (10.90 percent) and Central Luzon (12.90 percent). Meanwhile, ARMM (55.80 percent), Soccksargen (44.70 percent), and Eastern Visayas (45.20 percent) are considered as the poorest regions. Income inequality as measured by gini ratio is comparatively high national level with 0.42. Interestingly, while ARMM is the poorest region but its income inequality is found to be the lowest in the country at 0.29 in 2012. Eastern Visayas (0.48), Western Visayas (0.48), and Northern Mindanao (0.47) have the highest rate of income inequality. Meanwhile, the relatively advanced and adjacent regions of NCR (10.40 percent), Calabarzon (9.20 percent) and Central Luzon (8.70 percent) have the highest prevalence of unemployment. On the other hand, unemployment rate is found lowest at Cagayan Valley (3.2) and Zamboanga Region(3.4). NCR has a remarkably higher human development index3(HDI) of 0.83 in 2012, while ARMM has lowest HDI of 0.33.
Table 3 - Social Indicators
Regions Poverty (%) Gini
Ratio Unemployment(%) HDI
NCR 3.90 0.40 10.40 0.83 CAR 22.80 0.46 5.50 0.54 R1-Ilocos 18.50 0.43 8.30 0.66 R2-Cagayan Valley 22.10 0.41 3.20 0.58 R3-Central Luzon 12.90 0.41 8.70 0.64 R4A-Calabarzon 10.90 0.42 9.20 0.70 R4B-MIMAROPA 31.00 0.45 4.10 0.56 R5-Bicol 41.10 0.42 6.50 0.51 R6-Western Visayas 29.10 0.48 6.90 0.61 R7-Central Visayas 30.20 0.47 6.30 0.60 R8-Eastern Visayas 45.20 0.48 5.10 0.49 R9-Zamboanga Region 40.10 0.46 3.40 0.50 R10- Northern Mindanao 39.50 0.48 5.70 0.53 R11-Davao Region 30.70 0.43 6.90 0.52
3HDI is measured based on the following indicators: life expectancy at birth, mean years of schooling, expected years of schooling, and gross national
Braz. J. of Develop., Curitiba, v. 3, n. 1, p. 161-177, jan./jun. 2017. ISSN 2525-8761
R12-SOCCKSARGEN 44.70 0.45 4.40 0.48
CARAGA 40.30 0.44 6.00 0.50
ARMM 55.80 0.29 4.60 0.33
* Poverty Rate(2012), Gini Ratio(2012), Unemployment(2013), HDI(2012) Source: NSO
4 RESULTS AND DISCUSSION
4.1 ESTIMATION OF PROVINCIAL DYNAMISM INDEX
High provincial dynamism index would mean vibrant local economy, good local governance, presence of infrastructure, educated citizens, presence of health-support, and relatively high level of security. Provinces with high provincial dynamism index are in darker shade, while provinces with low provincial dynamism index are in lighter shade (Figure 1).
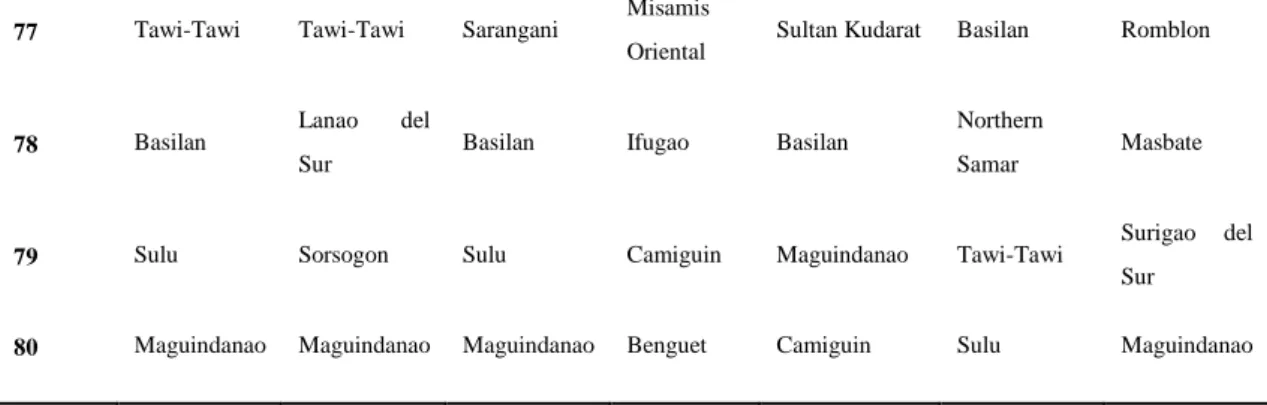
The top provinces that have the highest computed provincial dynamism index index are the following: Metro Manila4 (3.444), Cebu (0.610), Laguna (0.588), Cavite (0.521), Bulacan (0.487), Rizal (0.490), Batangas (0.474), Pangasinan (0.351), Negros Occidental (0.331), and Isabela (0.339). Except for Cebu, Pangasinan, and Negros Occidental, the rest of the top provinces are located within regions that are adjacent to Metro Manila. On the lowest end of the ranking are the following provinces: Maguindanao (-0.895), Sulu(-0.816), Basilan(-0.744), Tawi-tawi (-0.600), Lanao del Sur(-0.524), Camiguin (-0.497), Saranggani (-0.402), Ifugao (-0.397), Masbate(-0.376), and Northern Samar(-0.364). Except for Ifugao, Masbate, and Northern Samar, the lowest ranking provinces are located in Mindanao, primarily in Autonomous Region of Muslim Mindanao (ARMM).
High score in the economic index indicates a high level of per capita GDP, low level of poverty, higher wage rate, larger number of banks and bank deposit. In this economic index, neigh bourhood definitely seems to matter; except for Cebu, Batanes, and Quezon, the provinces which rank the highest are located within the peripheries of Metro Manila: Laguna, Cavite, Rizal, Batangas. On the other hand, provinces with lowest economic scores are located mostly in ARMM: Lanao del Sur, Tawi-tawi and Maguindanao.
Top scores in the education index signifies higher mean of schooling years and literacy rate as well as higher enrolment rate and completion rate. Except for Batanes, the provinces with the
Braz. J. of Develop., Curitiba, v. 3, n. 1, p. 161-177, jan./jun. 2017. ISSN 2525-8761
highest scores are again situated near the capital: Cavite, Rizal, Laguna, and Bulacan. Notice that in both economic and education scores, no provinces from Mindanao have made it to the top 10.
Higher security index denotes lower crime rate and low vulnerability to natural calamities. The provinces that are considered to be relatively safe are the following: Apayao, Sultan Kudarat, North Cotabato, Cagayan, Siquijor, Abra, Iloilo, Palawan, Isabela, and Marinduque. Meanwhile, provinces with the lowest score in security are the following: Albay, Davao Oriental, Pampanga, Aurora, Zambales, Basilan, Misamis Oriental, Ifugao, Camiguin, and Benguet.
High marks in infrastructure index indicates high road and bridges density, existence of ports and airports, higher percentage of energized barangays, and presence of special economic zones. The provinces which have the highest score are the following: Metro Manila, Leyte, Cebu, Palawan, Negros Occidental, Pangasinan, Batangas, Bohol, Zamboanga del Norte, and Occidental Mindoro. On the other hand, the provinces which rank poorly in the infrastructure category are Kalinga, Mt. Province, Bukidnon, Abra, Ifugao, Davao del Sur, Sulu, Basilan, Camiguin, and Benguet. These provinces are either located in Mindanao (Bukidnon, Davao del Sura, Sulu, Basilan, and Camiguin) or in the mountainous region of Northern Luzon (Kalinga, Mt. Province, Abra, and Ifugao).
High health-index means higher life expectancy rate, availability of safe water supply and sanitary, and more number of health workers. The provinces with favorable health conditions are the following:Metro Manila, Cebu, Isabela, Cavite, Bulacan, Batangas, Negros Occidental, Bohol,Pangasinan, and Quezon. On the other hand, provinces with relatively poor health conditions are: Capiz, Apayao, Antique, Aklan, Maguindanao, Lanao del Sur, Basilan, Northern Samar, Tawi-Tawi, Sulu.
In terms of good local governance as measured with high score in good governance index(GGI)5 , share of internal revenue allotment(IRA), IRA dependency, and basic social services
spending. the provinces which rank the highest are the following: Metro Manila, Rizal, Laguna, Pangasinan, Bulacan, Negros Oriental, Benguet, Cavite, Cebu, and Tarlac. Meanwhile, the provinces which fared poorly in the governance scores are the following: Sorsogon, Southern Leyte, Zamboanga del Sur, Sarangani, Occidental Mindoro, Lanao del Sur, Romblon, Masbate, Surigao del Sur, and Maguindanao.
Braz. J. of Develop., Curitiba, v. 3, n. 1, p. 161-177, jan./jun. 2017. ISSN 2525-8761 Figure 1 - Map of Provincial Dynamism Index
Braz. J. of Develop., Curitiba, v. 3, n. 1, p. 161-177, jan./jun. 2017. ISSN 2525-8761 Table 4 - Ranking of the Provinces
Ranking Socio-Economic Index
Economic Education Security Infrastructure Health Governance
Top 10 1 Metro Manila Metro Manila Metro
Manila Apayao Metro Manila
Metro Manila
Metro Manila
2 Cebu Laguna Cavite Sultan
Kudarat Leyte Cebu Rizal
3 Laguna Cavite Rizal
North
Cotabato Cebu Isabela Laguna
4 Cavite Rizal Laguna Cagayan Palawan Cavite Pangasinan
5 Rizal Batangas Bulacan Siquijor Negros
Occidental Bulacan Bulacan
6 Bulacan Quezon Batanes Abra Pangasinan Batangas Negros
Oriental
7 Batangas Bulacan Batangas Iloilo Batangas Negros
Occidental Benguet
8 Pangasinan Cebu Pangasinan Palawan Bohol Bohol Cavite
9 Isabela Batanes Tarlac Isabela Zamboanga
del Norte Pangasinan Cebu
10
Negros
Occidental Pampanga Pampanga Marinduque
Occidental
Mindoro Quezon Tarlac
Bottom 10
71
Northern
Samar Basilan
North
Cotabato Albay Kalinga Capiz Sorsogon
72 Masbate Surigao del
Norte
Zamboanga del Norte
Davao
Oriental Mt. Province Apayao
Southern Leyte
73 Ifugao Camarines
Norte
Sultan
Kudarat Pampanga Bukidnon Antique
Zamboanga del Sur
74 Sarangani Western
Samar
Davao del
Sur Aurora Abra Aklan Sarangani
75 Camiguin Aklan Davao
Oriental Zambales Ifugao Maguindanao
Occidental Mindoro
76
Lanao del
Sur Sulu Tawi-Tawi Basilan Apayao
Lanao del
Sur
Lanao del
Braz. J. of Develop., Curitiba, v. 3, n. 1, p. 161-177, jan./jun. 2017. ISSN 2525-8761
77 Tawi-Tawi Tawi-Tawi Sarangani Misamis
Oriental Sultan Kudarat Basilan Romblon
78 Basilan Lanao del
Sur Basilan Ifugao Basilan
Northern
Samar Masbate
79 Sulu Sorsogon Sulu Camiguin Maguindanao Tawi-Tawi Surigao del
Sur
80 Maguindanao Maguindanao Maguindanao Benguet Camiguin Sulu Maguindanao
Source: Author’s construction
4.2 COMPARISON WITH RELATED STUDIES
In order to assess the validity of the computed provincial dynamism index, comparison with related studies is needed. However, there are few studies that focus on the provincial-level. This study has found Human Development Index (HDI) and Good Governance Index (GGI). In comparison with the HDI, this study also adopts indicators that were used in HDI (life expectancy, mean years of schooling, and income per capita), but incorporates more infrastructure-related and security-related indicators. The range of indicators used in this study is somewhat similar to GGI which is based from three components: Economic Governance, Political Governance and Administrative Governance. GGI utilizes indicators that would reflect the local executive’s performance. However, this study adopts different variables and include additional indicators. With the variation in the indicators and computation techniques, it is expected that results of these studies would differ. However, some similarities can also be distinguished.
In this study, provinces in the Visayas are in top 10 but the HDI was dominated by provinces in Luzon. GGI top places are also occupied by the provinces in Luzon with the exception of Camiguin (Northern Mindanao). Five out of six provinces in CAR (Kalinga, Benguet, Mt. Province, and Ifugao, and Apayao) fill in the top provinces in the GGI estimates.
Table 5 - Comparison with Related Studies
Rank This Study HDI(2009) GGI(2008)
1 Metro Manila Benguet Camiguin
2 Cebu Metro Manila Siquijor
3 Laguna Batanes Kalinga
4 Cavite Rizal Benguet
Braz. J. of Develop., Curitiba, v. 3, n. 1, p. 161-177, jan./jun. 2017. ISSN 2525-8761
6 Bulacan Bataan Laguna
7 Batangas Bulacan Mt. Province
8 Pangasinan Laguna Ifugao
9 Isabela Nueva Vizcaya Apayao
10 Negros Occicental Ilocos Norte Compostela Valley
Source: NSCB
4.3 RESULT OF PRINCIPAL COMPONENT ANALYSIS
For the sample of 80 provinces, the first principal component(PC) accounts for 62.482 percent of the total variance with Eigen value higher than 1, and the second principal component accounts for 17.465 percent of the total variance, with Eigen value higher than 1. The first two principal components explain 79.947 percent of the total variance. The first component puts higher weight on economic, education, infrastructure, health, and governance. The second component emphasizes security and health.
The result of the principal component analysis makes it possible to identify a homogenous grouping of provinces with similar characteristics. The provinces with relatively good economic and security indicators are located in Quadrant I or North East Corner. Meanwhile, the provinces with good economic condition but relatively not favorable security situation are located in Quadrant II or South East corner. The provinces with relatively good security indicators but relatively unfavorable economic conditions are found in the Quadrant III or Northwest corner. The provinces with both poor economic condition and security situation are located in the Quadrant IV or the Southwest corners. Metro Manila is considered as an outlier as it is located in the far corner of the Quadrant II which means that it has very good economic situation but relatively unfavorable security condition.
This representation allows easy identification of the characteristics and comparative competitiveness of the provinces in the Philippines. This is particularly useful for the firms who are planning to locate in the Philippines. For instance, firms that conduct high-technology processes and research and development (R&D) can select the provinces with high education-level, or firms that handles assembly or logistics can choose to locate in the provinces with relatively well-built infrastructure. Furthermore, this representation can also be helpful to policymakers and local administrators who are aiming to revitalize local economy and improve social conditions.
Braz. J. of Develop., Curitiba, v. 3, n. 1, p. 161-177, jan./jun. 2017. ISSN 2525-8761 Source: Author’s own construction
In recent years, the prevailing pattern of production is characterized by fragmented production processes that spread across different regions or countries. These fragmented production blocks are located in the different locations that satisfy their requirement. For example, labour-intensive production processes are located in areas with low labour costs. High-technology processes need to be located in the areas with supply of highly-skilled workers. Participation in such production networks are widely documented to bring about substantial economic benefits and welfare gains (Giroud, 2007). As such, involvement in these production networks could be one of the key mechanisms that would enable integration of the leading and lagging areas of the country. Therefore, it is very important to gauge how provinces can take part in these production networks. For instance, provinces that have relatively high education index can accommodate business processing or research segment. Meanwhile, provinces with well-built infrastructure can host assembly firms or logistic hubs.
5 CONCLUSION
This study has shown that like many developing countries, growth and development in the Philippines is concentrated in a few areas, specifically, Metro Manila and its neighbouring regions. Using various indicators that are available at the provincial-level, this study constructed a provincial dynamism index which assesses the characteristics and growth potential of 80 provinces. The study
Braz. J. of Develop., Curitiba, v. 3, n. 1, p. 161-177, jan./jun. 2017. ISSN 2525-8761
has found out that among the ten provinces which have the highest computed index, there are four provinces which are not located near the primary economic center of Metro Manila: Cebu, Pangasinan, Isabela, and Negros Occidental. However, provinces in Mindanao, particularly those within the ARMM region are often found at the bottom of the ranking. Using principal component analysis (PCA), this study created an illustration of provinces similarities and differences in two-dimensional graph. The provinces can be categorized into four main groups: sound economic condition and good security situation; good economic condition but bad security situation, bad economic condition and bad security situation, and bad economic condition but good security situation. Most provinces must work on their economic development or improvement in security situation. It should be noted that the findings of the study are preliminary and still need further analysis. In particular, this study only utilizes the latest available data and does not account for changes over time. Nevertheless, this could provide a clue for policy makers, local administrators and firms in determining the current state of the provinces.
REFERENCES
ASIAN DEVELOPMENT BANK (ADB). Poverty in the Philippines: Causes, Constraints, and
Opportunities.Mandaluyong City: Asian Development Bank (ADB). 2009.
BALISACAN, A. Why Does Poverty Persist in the Philippines? SEARCA Agriculture and Development Discussion Paper Series No. 2007-1. 2007.
BALISACAN, A.;HILL, H.; PIZA, S.F. Spatial disparities and development policy in the
Philippines. In Huang Y.m& Bocchi, A.(eds.) Reshaping Economic Geography in Asia . World
Bank. 2008
CABALFIN, M.; YAP, J. Sustainable Development Framework for Local Governance.Makati
City: Philippine Institute for Development Studies Discussion Paper Series No. 2008-33. 2008.
GIROUD, A. MNEs vertical linkages: the experience of Vietnam after Malaysia. International
Business Review 16, 159-176. 2007.
HIRSCHMAN, A. The strategy for economic development. New Haven, CT: Yale University Press. 1958.
HUMAN DEVELOPMENT NETWORK. 2012/2013 Philippines Human Development Report . Human Development Network. 2013
KRUGMAN, P. Increasing returns and economic geography. Journal of Political Economy 99, 483-499. 1991.
KRUGMAN, P. a. Trade Policy and Third World Metropolis. Journal of Development Economics 49, 137-150. 1996.
Braz. J. of Develop., Curitiba, v. 3, n. 1, p. 161-177, jan./jun. 2017. ISSN 2525-8761
KRUGMAN, P. The role of geography in development. International Regional Science Review Vol.22, No. 1, pp. 142-161. 1999.
LIM, J.; NOZAWA, K. Decentralization and Economic Development in the Philippines. Tokyo: Institute of Developing Economies. 1992.
LLANTO, G. Infrastructure and regional growth. In Balisacan, A., &.Hill,H. The Dynamics of Regional Development: The Philippines in Asia. Chentelham, UK: Edward Elgar. 2007.
MAKABENTA, M. P. FDI Location and Economic Zones in the Philippines. RURDS Vol. 14, No. 1. 2002.
MANASAN, R. G. IRA design issues and challenges. Makati City: Policy Notes No. 2007-09 (December 2007) Philippine Institute for Development Studies. 2007.
MANASAN, R.G. Export processing zones, special economic zones, do we really need to have
more of them?.PIDS Policy Notes 2013-15. 2013.
NATIONAL STATISTICAL OFFICE (various years). Regional Data and Provincial Quickstat. Manila: National Statistical Office
MYRDAL, G. Economic theory and underdeveloped regions. London: Duckworth. 1975.
PERNIA, E.; PADERANGA, Jr., C.;HERMOSO, V. The Spatial and Urban Dimension of
Development in the Philippines. Quezon City: Philippines Institute for Development Studies.
1983.
PERROUX, F. Economic space: theory and application. Quarterly Journal of Economics 641 , 89-104. 1950.
SACHS, J.D (2001). Tropical underdevelopment. NBER Working Paper 8119.
WORLD BANK. World Development Report 2009: Reshaping Economic Geography. Washington DC: World Bank . 2009.