Decavanadate Binding to a High Affinity Site near the Myosin Catalytic Centre
Inhibits F-Actin-Stimulated Myosin ATPase Activity
†Teresa Tiago,*,‡Manuel Aureliano,‡and Carlos Gutie´rrez-Merino§
Departamento de Quı´mica e Bioquı´mica, Faculdade de Cieˆncias e Tecnologia, UniVersidade do AlgarVe, 8000 Faro, Portugal, and Departamento de Bioquı´mica y Biologı´a Molecular, Facultad de Ciencias, UniVersidad de Extremadura,
06071 Badajoz, Spain
ReceiVed January 12, 2004; ReVised Manuscript ReceiVed March 6, 2004
ABSTRACT: Decameric vanadate (V10) inhibits the actin-stimulated myosin ATPase activity, noncompeti-tively with actin or with ATP upon interaction with a high-affinity binding site (Ki) 0.27 ( 0.05 µM) in myosin subfragment-1 (S1). The binding of V10to S1 can be monitored from titration with V10of the fluorescence of S1 labeled at Cys-707 and Cys-697 with N-iodo-acetyl-N′ -(5-sulfo-1-naphthyl)-ethylenediamine (IAEDANS) or 5-(iodoacetamido) fluorescein, which showed the presence of only one V10 binding site per monomer with a dissociation constant of 0.16-0.7µM, indicating that S1 labeling with these dyes produced only a small distortion of the V10binding site. The large quenching of AEDANS-labeled S1 fluorescence produced by V10indicated that the V10binding site is close to Cys-697 and 707. Fluorescence studies demonstrated the following: (i) the binding of V10 to S1 is not competitive either with actin or with ADP‚V1 or ADP‚AlF4; (ii) the affinity of V10 for the complex S1/ADP‚V1 and S1/ ADP‚AlF4is 2- and 3-fold lower than for S1; and (iii) it is competitive with the S1 “back door” ligand P1P5-diadenosine pentaphosphate. A local conformational change in S1 upon binding of V
10is supported by (i) a decrease of the efficiency of fluorescence energy transfer between eosin-labeled F-actin and fluorescein-labeled S1, and (ii) slower reassociation between S1 and F-actin after ATP hydrolysis. The results are consistent with binding of V10to the Walker A motif of ABC ATPases, which in S1 corresponds to conserved regions of the P-loop which form part of the phosphate tube.
Although vanadium is one of the important transition elements in biology (1), its physiological role is still a matter of debate. At neutral pH and through the range of concentra-tions most frequently employed in biochemical studies, the predominant vanadate species are the monomer (H2VO4-), dimer (H3V2O7-), and cyclic tetramer (V4O124-) (2, 3). Other oligomers can also be formed; probably the most important of them in biochemical terms is decameric vanadate (V10O286-).1 Despite the low concentrations of vanadium
found in cells and tissues of higher organisms, vanadate oligomers once administered or formed at special cell sites may become inaccessible to hydrolysis and reduction due to their stabilization upon binding to target ligands (4). Indeed, recent work from our laboratory (5, 6) demonstrated that an acute exposure to decameric vanadate species, but not exposure to monomeric vanadate, induced oxidative stress and lipid peroxidation, pointing out the importance of taking into account different vanadate oligomers in the evaluation of vanadium toxicity.
The ability of vanadate to inhibit enzymes is linked to its physical and chemical properties as well as to its flexible coordination chemistry. Vanadate monomer can act as a ground state or transition state analogue of inorganic phosphate, which has made this ion a valuable tool for studying enzyme-catalyzed phosphotransfer and phospho-hydrolase reactions (7). This is particular relevant for myosin (M), the major ATPase of muscle, that is strongly inhibited by vanadate. The head segment of myosin, called subfrag-ment 1 (S1), contains the binding sites for ATP and actin, and is responsible for the ATPase activity during the process of muscle contraction (8). The binding of ATP reduces the affinity of myosin for actin, and the subsequent hydrolysis of ATP results in a ternary complex between myosin, ADP. and inorganic phosphate (Pi). The rate-limiting step of the ATP hydrolysis is the release of Pifrom myosin, which is accelerated by the rebinding of actin (9). Vanadate inhibits myosin ATPase activity by forming, in the absence of actin, †This work was supported by the Ph.D. Grant SFRH/BD/2924/2000
from Portuguese Foundation for Science and Technology (FCT) and by the POCTI program financed through FEDER for the research project 38191/QUI/2001.
* Corresponding author. E-mail: [email protected].
‡Universidade do Algarve. §Universidad de Extremadura.
1Abbreviations: ADP, adenosine 5′-diphosphate; AP
5A, P1P5
-diadenosine pentaphosphate; ATP, adenosine 5′-triphosphate; DTT, dithiothreitol; EDTA, ethylenediaminetetraacetic acid; eosin, eosin-5-iodoacetamide; F-actin, polymerized form of monomeric actin; FDNB, 2,4-dinitro-1-fluorobenzene; FRET, fluorescence resonance energy transfer; Hepes, 4-(2-hydroxyethyl)-1-piperazine ethane sulfonic acid; IAEDANS, N-iodoacetyl-N′-(5-sulfo-1-naphthyl) ethylenediamine; IAF, 5-(iodoacetamido) fluorescein; IU, amount of enzyme that release 1
µmole of product per minute; M, myosin; Mes, 2-(N-morpholino)
ethanesulfonic acid; mant-AMPPNP, 2′-(or-3′ )-O-(N-methylanthra-niloyl)-β:γ-imidoadenosine 5′-triphosphate; Pi, inorganic phosphate; S1,
myosin subfragment 1; SDS, sodium dodecyl sulfate; SH1, most reactive thiol (Cys 707) on myosin; SH2, Cys 697; Tris-HCl, tris-(hydroxymethyl)aminomethane hydrochloride; TNBS, 2,4,6-trinitroben-zenesulfonic acid; UV, ultra violet; V1, orthovanadate; V10, decameric
vanadate species.
10.1021/bi049910+ CCC: $27.50 © 2004 American Chemical Society Published on Web 04/14/2004
a very stable complex with MgADP that mimics either the transition state of hydrolysis or the ADP‚Piintermediate state (10). In the presence of actin, the rate of vanadate release increases by 105compared to that of M‚ADP‚V
1alone (5× 10⁻⁶s-1) (11). Although the actin-stimulated myosin ATPase activity has been described to be about 90% inhibited by ADP‚V1(12), it was suggested that this inhibition could be due in part to the presence of polymeric vanadate ions, because high vanadate concentrations (> 900µM) are needed
(13). In fact, it has been suggested that tetrameric vanadate (V4) interacts with myosin, being responsible for the vana-date-induced photolytic cleavage of myosin subfragment 1 (14, 15). More recently, Yount et al. (16) have proposed that in the presence of excess Vi(a mixture of monomeric and polymeric vanadate ions), Vicould enter the active site via the “back door” to form the more stable MgADP‚Vi‚myosin complex to relax the fibers.
Besides V4, there are indications that also vanadate decamer (V10) may interact with myosin (17), although little is known about its putative binding sites and functional relevance. More recently, fluorescent quenching studies have provided evidence for decavanadate high-affinity binding sites in myosin (18). We now show that the actin-stimulated myosin ATPase activity is indeed strongly inhibited by V10 and that this inhibition is due to the binding of this covalently closed polyanionic species of ellipsoidal-like shape (4, 19) to a specific high-affinity site in the myosin headgroup.
In a previous study using the intrinsic fluorescence of myosin to monitor decavanadate-myosin interaction (18), it was suggested that myosin has binding site(s) for deca-vanadate with an overall dissociation constant in the micro-molar range at high ionic strength (0.3 M KCl). We have named them “high affinity” site(s) because in the titration of the intrinsic fluorescence of myosin with up to 1 mM decavanadate showed a biphasic pattern with further quench-ing in the sub-millimolar range (Tiago, T., Aureliano, M., and Gutie´rrez-Merino, C., unpublished results). However, the limited solubility of overall myosin molecules precluded extending this study to lower ionic strength. In addition, because of the scattered distribution of Trp in the myosin 3D structure, and the occurrence of photon energy migration between them in the protein structure, the location of the putative interactions site(s) between decavanadate and myo-sin remained to be clarified.
Because myosin subfragment 1 (S1) labeled with fluores-cent dyes at Cys-707 and Cys-697 have been widely used to monitor interactions of different modulators of the actin-stimulated myosin ATPase activity (see for example refs
20-23), we explored whether these labeled S1 can be used to
gain a deeper knowledge of decavanadate-myosin interac-tions. These cysteines, termed SH1, and SH2, are the most commonly modified residues in myosin, being highly reactive with a variety of sulfhydryl directed compounds (24). Although they do not appear to be directly involved in ATP hydrolysis, they are located at a key position in the path of intersite signal transmission (21, 24, 25), which makes them suitable reporter groups to monitor the functional events on the myosin head. In the present study, we report kinetic and fluorimetric studies on the effects of decavanadate on the actin-stimulated S1 ATPase activity and fluorescence of S1 labeled with IAEDANS and IAF at Cys-707 and Cys-697. In addition, the possibility of modulation of the F-actin/S1
complex by decavanadate has been studied by light scattering and FRET measurements as well as the effect of decavana-date on actin polymerization/depolymerization by light scattering measurements and fluorescence depolarization of eosin-labeled actin.
MATERIALS AND METHODS
Reagents. Chemicals used to prepare buffers were reagent
grade. Ammonium metavanadate was purchased from Riedel-de-Ha¨en (Germany). DTT, FDNB, ATP, ADP, AP5A, NADH, phosphoenolpyruvate, trypsin, and R-chymotrypsin were supplied by Sigma Chemical Co (St. Louis, MO). Py-ruvate kinase and lactate dehydrogenase were purchased from Roche Molecular Biochemicals (Mannheim, Germany).
N-Iodo-acetyl-N′-(5-sulfo-1-naphthyl)ethylenediamine (IAE-DANS), 5-(iodoacetamido) fluorescein (IAF), eosin-5-io-doacetamide, and mant-AMPPNP were supplied by Molec-ular Probes (Eugene, OR).
Proteins. Myosin was prepared from leg and dorsal white
rabbit skeletal muscle, as previously described by Pires et al. (26). Subfragment 1 was prepared by chymotryptic digestion of myosin according to Margossian and Lowey (27). F-Actin was prepared from acetone powder of rabbit skeletal muscle as described by Pardee and Spudich (28). Protein concentrations were determined spectrophotometri-cally by using extinction coefficients of E2801% ) 5.7 cm-1for myosin, E2801% ) 7.5 cm-1 for S1 and E2901% ) 11.5 cm-1 for actin. The molecular masses used were 500, 115, and 42 kDa for myosin, S1, and actin, respectively.
Vanadate Solutions. Stock solutions of decavanadate were
prepared in a manner that maximized the proportion of vanadate that was present as the decamer, by adjusting the pH of the metavanadate stock solutions (50 mM NH4VO3, pH 6.0-7.0) to pH between 3 and 5 (29). It has been shown by NMR spectroscopy that a decavanadate stock solution contains exclusively decameric vanadate species (30). On the other hand, only for metavanadate concentrations lower than 200µM, orthovanadate species are exclusively present
(30, 31). In contrast to the labile oxovanadates, which interconvert on the time scale of milliseconds to seconds, decameric vanadate has a very slow dissociation kinetics upon dilution (32). The kinetics of dissociation of decameric species in the experimental conditions used in this study (25
°C, 20 mM Hepes, pH 7.0) assessed by measurements of the absorption at 400 nm (an absorption band that is characteristic of decameric vanadate) is confirmed as a first-order kinetic process with a half-life of 158 min (measured with 50µM total vanadium concentration). Therefore, this
oxoanion remains stable during the period used in the experiments. Metavanadate or decavanadate solutions were added to the assays from the concentrated form or from a 10-fold dilution of the stock solutions. The pH changes of the assay medium during titration with decavanadate or metavanadate solutions were always less than 0.05 pH units.
Kinetic Studies. Steady-state assays of the Mg2+-ATPase and the actin-activated S1 ATPase were measured spectro-photometrically at 25°C using the coupled enzyme pyruvate kinase/lactate dehydrogenase assay (33) with the following reaction mixture: 20 mM Hepes (pH 7.0), 2.5 mM MgCl2, 0.1-2 mM ATP, 0.42 mM phosphoenolpyruvate, 0.375 mM NADH, 18 IU lactate dehydrogenase, and 18 IU pyruvate
kinase. The detection system was not affected by the range of decavanadate concentrations used in this study (0-100
µM total vanadate concentration), as was confirmed by a
rapid decrease in absorbance at 340 nm upon addition of 40
µM ADP after the assay.
CoValent Modification of Proteins. Myosin S1 (5-6 mg/
mL) was labeled at SH1 (Cys-707) with IAEDANS or IAF as previously described (20, 24). Prior to labeling, S1 was dialyzed against 60 mM KCl, 25 mM Hepes, pH 7.5. The dialyzed sample was then incubated on ice for 1 h in the dark with a 20-fold molar excess of IAEDANS (dissolved in the same buffer) or with a 5-fold molar excess of IAF (dissolved in buffer at pH 9.0). The reaction was stopped by adding an excess of DTT, and unreacted probe was subsequently removed on a PD-10 column (Pharmacia). These labeled S1 samples are named as S1(AEDANS, SH2) and S1(AF, SH2), respectively. Myosin S1 (5-6 mg/mL) was also labeled at SH2 (Cys-697) with IAEDANS or IAF as previously described (20, 24). To avoid the labeling of Cys-707, this residue was reversibly blocked by reacting S1 with a 2-fold molar excess of FDNB at 4°C for 30 min in the presence of 1 mM MgCl2, 1 mM ADP, 60 mM KCl, and 25 mM Hepes, pH 8.0. FDNB-protected S1 was subsequently incubated at 4 °C for 1 h in the dark in the presence of 5 mM MgCl2 and 5 mM ADP with a 8-fold molar excess of IAEDANS or with a 2-fold molar excess of IAF. The reaction was stopped by the addition of 10 mM DTT and the protective dinitrobenzene group was removed from SH1 by incubation with 10 mM DTT at 4°C overnight. The excess of the probe and DTT were removed on a PD-10 column (Pharmacia). These labeled S1 samples are named as S1(SH1, AEDANS) and S1(SH1, AF), respectively. F-actin was labeled at Cys-374 with a 5-fold molar excess of eosin on ice for 2 h, followed by the addition of an excess of DTT to stop the reaction. The labeled F-actin was extensively dialyzed against a buffer containing 0.2 mM ATP, 2 mM MgCl2, 50 mM KCl, and 2 mM Tris-HCl, pH 8.0 to remove the unreacted probe. The labeled F-actin was used within several days and immediately before fluorescence measurements was dialyzed against 2 mM MgCl2, 50 mM KCl, and 2 mM Tris-HCl, pH 8.0 to remove free nucleotide. The extent of labeling of myosin S1 and F-actin by the probes was estimated spectrophotometrically using the following extinction coefficients: E3371% ) 6100 M-1 cm-1 for IAE-DANS, E4951% ) 80 000 M-1 cm-1 for IAF, and E5191% ) 100 000 M-1cm-1for eosin. For this purpose, concentrations of labeled S1 were measured by the Bradford protein assay (34) using bovine serum albumin as a standard. The degrees of labeling of SH1 of myosin S1 were in the range of 0.7-1 for both labels, while the labeling of SH2 was about 0.9 for IAEDANS and 0.5 for IAF. Fluorescence polarization (P) of labeled proteins was routinely measured for two major reasons: (i) to test for the possibility of unreacted dye contamination, whose fluorescence is largely depolarized (P < 0.005) and (ii) to calculate the anisotropy of the attached dye, which is needed for FRET analysis. The specificity of the labeling on S1 was verified by measurements of both Ca2+-ATPase and K+/EDTA-ATPase activities and by a 12.5% SDS-polyacrylamide gel electrophoresis of partially trypsin-digested labeled S1 in which the fluorescence frag-ments were located on unstained gels under UV illumination
(20). The ATPase activities (Ca2+- and K+/EDTA-ATPase) of S1 were measured by determination of inorganic phos-phate release (35). The assays were carried out at room temperature in 50 mM Tris-HCl (pH 7.9), 2.5 mM ATP, and either 0.23 M KCl and 2.5 mM CaCl2for Ca2+-ATPase or 0.6 M KCl and 1 mM EDTA for K+/EDTA-ATPase activities, using 0.1 mg/mL of protein. In agreement with previous reports (20, 36), the covalent modification of SH1 with IAEDANS displayed an increase in the Ca2+-ATPase activity by a factor of 2.4-3 and an inhibition of the K+/ EDTA-ATPase activity of 90%. When SH1 was modified by IAF, the Ca2+-ATPase activity was enhanced by a factor of 1.4-1.6 and the K+/EDTA-ATPase activity was inhibited by 45%. S1 labeled at SH2 was inhibited in both the Ca2+ -ATPase and K+/EDTA-ATPase activities, by at least 30 and 50%, respectively. The fluorescence fragments of the partially digested labeled S1 were located on unstained SDS-polyacrylamide gels under UV illumination. The gels showed a single fluorescent band in the 20-kDa peptide segment in which SH1 and SH2 are found.
Preparation of Stable S1 Transition State Complexes. The
complexes S1‚ADP‚VO43- and S1‚ADP‚AlF4
-were pre-pared with the labeled protein S1(AEDANS, SH2) and S1-(AF, SH2) as previously described (22). Briefly, labeled S1 in 60 mM KCl, 25 mM Hepes, pH 7.9 was incubated at 25
°C for 5 min with 1 mM MgCl2, 0.2 mM ADP, and, for AlF4- with 5 mM NaF. Then, metavanadate solution (for VO43-) or AlCl3(for AlF4-) was added to a final concentra-tion of 0.2 mM, and the incubaconcentra-tion was continued for 90 min at 25 °C. To remove excess of nucleotide analogues, the samples were passed through a PD-10 column (Pharma-cia).
Fluorescence Measurements. Steady-state fluorescence
measurements were performed in a continuously stirred cuvette with the following spectrofluorimeters: Hitachi-Perkin-Elmer (model 650-40) and SLM-4800C, with cali-brated polarizers for polarization measurements. All experi-ments were performed at 25°C in a medium containing 20 mM Hepes, pH 7.0 and 2.5 mM MgCl2. S1-AEDANS and S1-AF emissions were monitored at 470 and 520 nm with excitation at 336 and 490 nm, respectively. The binding of vanadates to S1 was monitored by titration of modified S1 (0.45 µM) with metavanadate or decavanadate solutions
ranging from 0 to 50µM total vanadium concentration. Inner
filter effects, due to the absorbance at 336 and 470 nm of metavanadate and decavanadate, were corrected using the following equation: Fcorr) CFobs, where Fcorrand Fobsare the values of the corrected and observed fluorescence, respectively, and C ) antilog [(A336+ A470)/2] (37), with the following extinction coefficients (determined under our experimental conditions from stock metavanadate and de-cavanadate solutions): 0.4 mM-1cm-1for metavanadate at 336 nm, and 1.12 and 0.09 mM-1cm-1for decavanadate at 336 and 470 nm, respectively. Eosin-F-actin fluorescence was measured with excitation and emission wavelengths set at 475 and 520 nm, respectively.
Polarization of fluorescence was calculated by using the expression (38): P(λ) ) [(I|- G(λ)I⊥)/(I|+ G(λ)I⊥)], where
I| and I⊥ are the fluorescence intensities measured with parallel and perpendicularly oriented polarizers, respectively, and G(λ) is the correction factor for the polarization
excitation/emission setup the value of G(λ) was averaged
from more than 10 measurements, and for the polarization measurements done in this work it was 1.085 ( 0.005 (IAEDANS-S1) and 1.140 ( 0.005 (IAF-S1). The steady-state anisotropy of fluorescence, rs, has been calculated from the measured polarization (P) by using the equation (38):
rs) 2P/(3 - P).
Dissociation constants were obtained using the program Origin 5.0, from the slopes of the linear least-squares fit of the fluorescence titration data to the Scatchard equation, taking the fractional change of fluorescence (or anisotropy for mant-AMPPNP titration) as the fraction of saturated binding sites (β). Thus, bound ligand concentration: [bound] ) nβ[S1], where n ) number of binding sites/S1 monomer; and free ligand concentration: [free] ) [total ligand] -[bound].
Analysis of Fluorescence Energy Transfer (FRET). The
calculations of distances from steady-state fluorescence energy transfer measurements have been done using the basic equation for one donor/acceptor pair (39). The distance R0 for the pairs IAF-S1/eosin-F-actin and IAEDANS-S1/V10 has been calculated as in Gutie´rrez-Merino et al. (40), with the equation (41):
using a value for κ2) 2/3 (which corresponds to a random orientation between donor and acceptor), with a refractive indexη ) 1.33, i.e., equal to that of a dilute aqueous solution,
and with the donor quantum yield measured for IAF-S1 (QD) 0.35 ( 0.05) and IAEDANS-S1 (QD) 0.18 ( 0.03) using 1 mM quinine sulfate in 1 N sulfuric acid at 25°C as a reference standard, as in Centeno and Gutie´rrez-Merino (42). The overlap integral values were calculated from the absorption and corrected emission spectra of the acceptor and donor, respectively, as in previous papers (40, 42).
Light-Scattering Measurements. Light scattering intensity
was monitored at 90°with respect to the incident light at 25
°C, using a Perkin-Elmer 650-40 spectrofluorimeter. Both monochromators were set at 400 nm for the polymerization measurements of actin or at 500 nm (to avoid inner filter effects by decavanadate) for the experiments with S1 and F-actin/S1 complex.
RESULTS
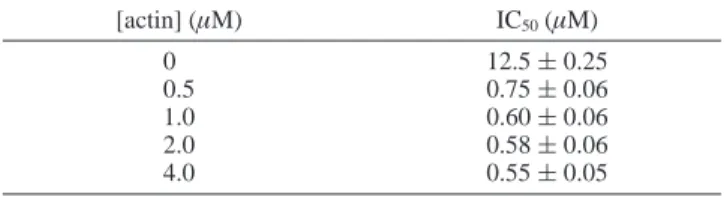
Inhibition of the Actin Stimulated S1 ATPase ActiVity by V10. Addition of decavanadate produced inhibition of the actin-stimulated myosin S1 ATPase activity (Table 1). The inhibition is attained in less than 15 s, as shown by the linearity of the kinetic traces of the ATPase activity after manual mixing since the starting point and for a period lasting more than 10 min. As metavanadate (up to 150µM
of total vanadium concentration) produced less than 20% inhibition of this activity, these results also showed that decavanadate remains stable in the assay medium for, at least, 30 min, in good agreement with our measurements of the stability of decavanadate determined from the absorbance at 400 nm of decavanadate solutions in 20 mM Hepes, pH 7.0 (see Materials and Methods).
Increasing the F-actin concentration from 0.5 to 4 µM,
while keeping the S1 concentration fixed to 0.45µM in the
ATPase assay, did not increase the concentration of V10
required to produce 50% inhibition (IC50) of actin-stimulated S1-ATPase activity, but at most slightly decreased it from 0.75 ( 0.07 to 0.55 ( 0.05µM of V10when F-actin increased from 0.5 to 4µM (Table 1). Therefore, we can exclude that
this inhibition is the result of a direct competition between F-actin and decavanadate for binding to S1. Consistently, V10was also found to inhibit the S1-ATPase activity in the absence of F-actin, but with an IC50value of 12.5µM, i.e.,
approximately 20-fold higher than that obtained in the presence of 2-4 µM F-actin. These results suggested that
the binding site of V10which accounted for inhibition of the S1-ATPase activity is likely to be located near the functional protein domains altered upon F-actin binding to S1, e.g., the catalytic or the energy transduction domain connecting catalytic and F-actin binding sites (8).
To question the possibility that the inhibition of the actin-stimulated S1-ATPase activity by V10can be due to competi-tion with the substrate ATP, we have studied the inhibicompeti-tion of actin-stimulated S1-ATPase at different ATP concentra-tions. The obtained results are presented in Figure 1 in the form of Hanes plots, and showed that the inhibition by V10 is noncompetitive with ATP, yielding an inhibition constant (Ki) of 0.27 ( 0.05µM V10(2.7 ( 0.5 µM total vanadium concentration). Owing to the relevance of this point, we have studied the effect of V10on the binding of ATP to S1, which has been monitored from the increase of anisotropy of a mant-fluorescent ATP analogue upon binding to S1, as in ref 43. To avoid ATP hydrolysis during these binding studies, we have used the non-hydrolysable mant-AMPPNP analogue instead of mant-ATP. The results are presented in the Figure 2, and analyzed with Scatchard plots using the fractional increase of fluorescence anisotropy [(r - rmin)/(rmax- rmin)] as the molar fraction of bound mant-AMPPNP (inset of Figure 2). From the slopes of the linear least-squares fit of the Scatchard plots of these data, the following values for the dissociation constant of mant-AMPPNP were obtained (R > 0.96 in all the cases): 0.23 ( 0.02µM (in the absence
of V10), 0.26 ( 0.02 and 0.23 ( 0.02µM (in the presence of 5 and 10 µM of V10). Thus, V10 binding to S1 is noncompetitive with ATP binding.
These results showed that the inhibition of actin-stimulated S1-ATPase activity by V10is the result of slowing down the catalytic cycle by binding at a regulatory site different from the nucleotide site of the catalytic center. Because the IC50 value for inhibition by decavanadate of the actin-stimulated S1-ATPase corresponds to a V10/S1 molar ratio of 1.0-1.5/ 1, we studied the dependence of the IC50 value with S1 R0) 9.76 × 10³(Jη-4κ2QD)1/6(Å) (1)
Table 1: Effect of Actin Concentration on V10Inhibition Constants
of Myosin S1 ATPase Activitya
[actin] (µM) IC50(µM) 0 12.5 ( 0.25 0.5 0.75 ( 0.06 1.0 0.60 ( 0.06 2.0 0.58 ( 0.06 4.0 0.55 ( 0.05
aThe assays were performed at 25°C using a coupled enzyme system (as described in Materials and Methods) with 0.45µM S1 in 20 mM
Hepes (pH 7.0), 2 mM ATP, and 2.5 mM MgCl2. Decavanadate final
concentrations ranging from 0 to 100µM (total vanadium concentration)
were added to the medium, from a decavanadate stock solution of 5 or 50 mM. IC50 values are the average of the results obtained with at
concentration, maintaining the ratio of actin/S1 concentra-tions constant. The IC50was linearly dependent upon the S1 concentration yielding a slope of 1.06 ( 0.12µM V10/µM
S1 (Figure 1C), thus showing that it is caused by the binding
of V10species to one inhibitory high-affinity site per molecule of myosin S1.
Location of the Binding Site of V10that Produced
Inhibi-tion of the Actin Stimulated S1-ATPase ActiVity. Recently
(18), we have shown the presence of a high-affinity binding site for V10in myosin from intrinsic fluorescence quenching studies. Nevertheless, the possibility that the inhibition of the actin-stimulated myosin ATPase activity could be due to V10binding to F-actin instead to myosin or to impairment of the interaction between myosin and F-actin cannot be excluded solely on these grounds.
However, the possibility of a direct interaction of V10with F-actin can be discarded because decavanadate (up to 200
µM total vanadium): (i) had no effect on the fluorescence
of F-actin-eosin nor on the intrinsic fluorescence of F-actin; (ii) had no effect on the light scattering of F-actin (thus implying that it does not promote F-actin dissociation); and (iii) had no effect on the rate of F-actin polimerization (measured using the light scattering approach, as in Cooper and Pollard (44) (results not shown).
Therefore, we decided to gain a deeper knowledge of the interaction of decameric vanadate with its high-affinity binding site in myosin S1. To this end, we have labeled Cys-707 of S1 with IAEDANS and with IAF following estab-lished protocols as indicated in Materials and Methods. V10 was found to inhibit the actin-stimulated S1-ATPase activity of labeled S1, but with IC50values higher than that obtained for control S1 (0.7 ( 0.1µM V10), namely, 1.6 ( 0.2µM
for S1(AF, SH2) and 8.9 ( 1.3µM for S1(AEDANS, SH2).
These results suggested functional interaction between SH1 and V10 binding sites. The results of the titration of the fluorescence of labeled S1(AEDANS, SH2) and of S1(AF, SH2) with decavanadate are shown in Figure 3A. The relatively large magnitude of the fluorescence changes found at saturation with V10 (Figure 3A) suggested a close proximity between the binding site for V10 and Cys-707. Control experiments carried out with IAEDANS-Cys and IAF-Cys showed that V10 did not affect directly the
fluo-FIGURE1: Inhibition by decavanadate of actin-stimulated S1 Mg2+ -ATPase activity. The assays were performed at 25°C, in 20 mM Hepes, 25 mM KCl and 2.5 mM MgCl2(pH 7.0). (A) Hanes plot of [ATP]/V versus vanadate concentrations up to 100µM in total
vanadium added (i.e., up to 10µM V10) for ATP concentrations of 0.1 mM (squares), 0.5 mM (circles), 1 mM (up triangles), and 2 mM (down triangles). The studies were carried out with 0.45µM
S1 and 2µM actin. (B) The plot was made with the slopes obtained
from the Hanes plot versus [vanadate] to calculate the Ki value from the intercept of the ordinate. (C) Dependence of the IC50 (concentration of decavanadate producing 50% inhibition of actin-stimulated S1 Mg2+-ATPase activity) with 2 mM ATP and S1 concentration (0.11-0.9 µM), maintaining a constant actin/S1
concentration ratio of 4.4.
FIGURE 2: Fluorescence anisotropy titration of 0.1 µM
mant-AMPPNP with myosin-S1 concentrations ranging from 0.05 to 3
µM, in the absence (squares) and presence of 5 µM (circles) and
10µM (triangles) V10concentrations. Dissociation constants were determined from the slopes of the linear least-squares fit of the Scatchard plots (inset plot). Fluorescence measurements (excitation wavelength 357 nm; emission wavelength 447 nm) were carried out at 25°C, in 20 mM Hepes, 25 mM KCl and 2.5 mM MgCl2 (pH 7.0).
rescence of these dyes (less than 2% effect up to 200µM
V10). These results showed that V10produced partial
quench-ing of the fluorescence of S1(AEDANS, SH2) and increase of the fluorescence of S1(AF, SH2) with saturation charac-teristics of the ligand binding to a protein. Titration with V10 at different concentrations of labeled S1 (results not shown) showed that the concentration of V10producing 50% of the maximum fluorescence change can be fit to a straight line with a slope of 1.0 ( 0.1µM V10species/µM S1, thus confirming that fluorescence quenching is the result of binding of V10to a single site per mole of S1. Given that in previous NMR studies (29) it was shown that upon dilution to the reaction medium, the decavanadate solutions can contain approximately 10% of orthovanadate, to ascertain whether the orthovanadate added with decavanadate solution can account for the effects on the fluorescence shown in Figure 3A, we have carried out titration with a metavanadate solution (containing only orthovanadate) of the fluorescence of S1(AEDANS, SH2) and of S1(AF, SH2) (Figure 3C). The results showed that the contaminant orthovanadate cannot account for the fluorescence changes produced by titration with decavanadate solutions. Because the fractional fluores-cence change (∆F/∆Fmax) can be taken as the fraction of occupied V10 binding sites, bound and free V10 were calculated from the results of the titration with V10of the fluorescence of S1(AEDANS, SH2) with one binding site per molecule of S1 (see above). From the slopes of Scatchard plots of the data (see for example inset of Figure 3A), we have obtained the following dissociation constants (Kd) for V10: 0.26 ( 0.02µM for S1(AEDANS, SH2) and 0.16 ( 0.05µM for S1(AF, SH2). These values for the dissociation constant of V10from S1 are identical, for S1(AEDANS, SH2), or close, for S1(AF, SH2), to the Kivalue of inhibition of actin-stimulated unlabeled S1-ATPase activity obtained from Hanes plots, 0.27 ( 0.05 µM (see above). This indicated
that binding of V10 is not significantly altered by AF or AEDANS labeling of Cys-707, and suggested that the observed increase of IC50for V10in S1(AEDANS, SH2) or S1(AF, SH2) is related to the alteration of the catalytic cycle produced by S1 labeling.
To further assess this point, we labeled S1 at the “so-called” SH2group (Cys-697), which is also located in this protein domain (45), with IAEDANS and IAF (as indicated in Materials and Methods) and carried out the titration of S1(SH1, AEDANS) and S1(SH1, AF) with V10. Cys-697 labeling with IAEDANS or with IAF was found to have no effect on the IC50value for V10inhibition of actin-stimulated S1 ATPase activity. The results are presented in the Figure 3B, and the Scatchard plot of the data yielded the following Kd values for V10: 0.40 ( 0.02 and 0.70 ( 0.04 µM for S1(SH1, AEDANS) and S1(SH1, AF), i.e., between 1.5 and 3-fold higher than the Ki obtained from Hanes plots and close to those obtained from the data shown in Figure 3A. Therefore, labeling at the SH2 group with AEDANS or AF decreased the free energy of V10binding to the inhibitory site [∆G ) RT ln(Kd1/Kd2)] by nearly 0.6 kcal/mol, indicating only a small distortion of the V10binding site. Again, the data shown in Figure 3C ruled out any significant contribution of orthovanadate to the quenching of the fluorescence of S1(SH1, AEDANS) and S1(SH1, AF) produced by titration with V10.
The affinity of V10for this site in S1 is strongly dependent upon ionic strength, showing the relevance of electrostatic interactions for decameric vanadate binding to S1, and that
FIGURE 3: Dependence of the fluorescence of labeled S1 upon decavanadate (A and B) and metavanadate (C) concentration.
Y-axis: fluorescence relative to the fluorescence in the absence of
decavanadate or metavanadate. Small volumes of vanadate solutions were successively added to 0.45µM of labeled S1 from 5 or 50
mM decavanadate or metavanadate stock solutions. In panels A (S1 labeled at SH1 - Cys 707) and B (S1 labeled at SH2 - Cys 697), squares and circles represent the labeling with IAEDANS and IAF, respectively. In panel C, squares represent the labeling with IAEDANS at SH1 residue and triangles the labeling with IAEDANS at SH2 and IAF at SH1 and SH2 residues. Dissociation constants were determined from the slopes of the linear least-squares fit of the Scatchard plots (see for example inset plot of panel A). All measurements were made at 25°C in a medium containing 20 mM Hepes (pH 7.0), 25 mM KCl, 2.5 mM MgCl2. IAEDANS and IAF fluorescence were measured with emission wavelengths of 470 and 517 nm, and with excitation wavelengths of 336 and 490 nm, respectively.
at a close to physiological ionic strength (0.2 M KCl) the IC50for inhibition of the actin-stimulated myosin ATPase activity by V10is below 2.5µM (results not shown).
Effect of Different Myosin ATPase Modulators on the Interaction of V10 with S1. As the results shown above indicated that the inhibition of actin-stimulated S1-ATPase activity by V10is noncompetitive either with actin or with ATP, we considered next that the affinity for V10of different conformational states of S1, which become populated during the catalytic cycle (46-48), can be significantly different. To this end, ADP‚V1 and ADP‚AlF4 complexes were prepared with labeled S1 to mimic the intermediate activated S1**‚ADP‚Pi state, as described elsewhere (22, 23). The results of titration with V10 of the fluorescence of S1-(AEDANS, SH2) and of S1(AF, SH2) pointed out that (i) although ADP‚V1and ADP‚AlF4produced partial quenching of the fluorescence of S1(AEDANS, SH2) (as previously reported in ref 23), V10 binding produced an additional quenching of this fluorescence, which at saturation is the same as that found in absence of ADP‚V1or ADP‚AlF4; (ii) at saturation of V10the increase of S1(AF, SH2) fluorescence in the presence of ADP‚V1or ADP‚AlF4is about 20% higher than that obtained in absence of the nucleotide complex ADP‚V1or ADP‚AlF4(which produced approximately 20% quenching of the fluorescence of S1(AF, SH2); and (iii) in the presence of ADP‚V1 or ADP‚AlF4 the dissociation constant of V10from S1 is only weakly increased (Table 2). In addition, the results obtained with S1(AEDANS, SH2) demonstrated that V10species do not bind to the catalytic site, as the extent of quenching produced at saturation with V10is not affected by the presence of ADP‚V1or ADP‚AlF4, and for S1(AF, SH2) the effect of decavanadate (increase of fluorescence) is opposite to the effect of ADP‚V1or ADP‚ AlF4(quenching).
AP5A has been shown to bind to S1 and to actomyosin in myofibrils and skinned fibers in a bimodal way that extends from the nucleotide binding site at the catalytic crevice through the “so-called” phosphate tube and to the 50-K cleft leading to the back door of the catalytic center (49). Because, the helix connecting Cys-707 and Cys-697 is at the bottom of the 50-K cleft leading to the back door of the catalytic center (50), and the results shown above suggested a close proximity between the binding site for V10 and labels covalently bound to these cysteines, we decided to question whether binding of V10compete with AP5A, through binding
to a site close to the back door of the catalytic center. Titration of the fluorescence of S1(AF, SH2) with AP5A allows to monitor the binding of AP5A (Figure 4A), and the slopes of the Scatchard plots of these data yielded values for the Kdof the AP5A/S1 complex of 37 ( 2µM AP5A in the absence of V10and 133 ( 5µM AP5A in the presence of 5µM V10, i.e., 50µM total vanadium (Figure 4A). The Kdof the V10‚S1 complex obtained from the slopes of the Scatchard plots of the data shown in the Figure 4B increased from 0.16 ( 0.04µM V10in absence of AP5A to 5.8 ( 0.2
µM V10 in the presence of 200 µM AP5A. Thus, V10 and AP5A compete for binding to S1.
Effect of V10on the S1/F-Actin Association. The effect of V10on the light scattering of the acto-S1 complex solution is shown in the Figure 5. In the absence of ATP, there is only a small change on the light scattering of the complex (amounting to less than 10%) at V10 concentrations that produced more than 80% inhibition of the actin-stimulated S1-ATPase activity, with no indications of dissociation of the acto-S1 complex (the effect of addition of ATP is included to illustrate this point). However, V10 but not orthovanadate produced a large increase in the time needed to reassociate S1 and actin after consumption of added ATP (compare Figure 5, panels B and C), and this increase is Table 2: Effect of Different Myosin Modulators on the Dissociation
Constant of Decameric Vanadate to S1(AEDANS, SH2) and to S1(AF, SH2)a
Kd (µM)
modulators S1-AEDANS S1-AF
none 0.26 ( 0.03 0.16 ( 0.04
ADP-V1 0.45 ( 0.05 0.25 ( 0.03
ADP-AlF4 0.62 ( 0.07 0.46 ( 0.05
aAEDANS and AF fluorescence were measured at 25 °C with emission wavelengths of 470 and 517 nm, and excitation wavelengths of 336 and 490 nm, respectively, in 20 mM Hepes, 2.5 mM MgCl2,
and 25 mM KCl (pH 7.0). Decavanadate final concentrations ranging from 0 to 100 mM (total vanadium concentration) were added to the medium, from a decavanadate stock solution of 5 or 50 mM. Kdvalues
were obtained from Scatchard plots of the fractional fluorescence change, as indicated in the text, and are the average of at least triplicate experiments.
FIGURE4: Dependence of the fluorescence of S1(AF,SH2) upon AP5A (A) and decavanadate (B) concentration. IAF fluorescence (excitation wavelength 490 nm; emission wavelength 517 nm) was measured at 25°C, in 20 mM Hepes (pH 7.0), 25 mM KCl and 2.5 mM MgCl2. Panel A: Titration with AP5A of the fluorescence of S1(AF,SH2) in the absence (squares) or presence (circles) of 5
µM V10(50µM total vanadium added as decavanadate). Panel B: Titration with decavanadate of the fluorescence of S1(AF,SH2) in the absence (squares) or presence (circles) of 200µM AP5A.
dependent on the concentration of V10. The increase of the time after addition of ATP needed for the onset of the reassociation process in the presence of V10correlated well with the extent of inhibition of the S1 ATPase activity by V10, thus indicating that is the time needed to attain a sufficiently low ATP level in the solution to allow for the reassociation process to occur. Remarkably, however, the kinetics of the reassociation between S1 and actin is notably
slowed in the presence of V10(inset of Figure 5C), suggesting the formation of nonproductive complexes induced by V10. The formation of the complex between actin and S1 can also be monitored by fluorescence energy transfer (48, 51,
52). To this end, we have labeled S1 with IAF (as the
fluorescent donor) and F-actin with eosin iodoacetamide (eosin-F-actin). V10 produced only a small decrease of energy transfer between IAF-S1 and eosin-F-actin, from 20 to 15% in the absence and the presence of 5µM V10(50
µM total vanadium) after correction for the effect of V10on IAF-S1 fluorescence (results not shown). Using the overlap integral value (J) between IAF-S1 and eosin-F-actin and donor (fluorescein in IAF-S1) quantum yield (QD) which we have determined for our labeled samples (J ) 5.52× 10⁻¹⁴cm3M-1and Q
D) 0.35 ( 0.05), we have obtained a
R0 value for this donor-acceptor pair of 3.9 ( 0.1 nm. Applying eq 1 of Materials and Methods, we have obtained a distance between donor (fluorescein) and acceptor (eosin) located in S1 and F-actin of 4.9 ( 0.1 and 5.2 ( 0.1 nm in the absence and in the presence of 5µM V10(50µM total vanadium), respectively. Our distance estimation between donor and acceptor dyes in the F-actin/S1 complex agrees well with the values reported by others (48, 51, 52), and the results confirm that V10does not significantly dissociate the F-actin/S1 complex in the experimental conditions that produced a large inhibition of the actin-stimulated S1-ATPase activity.
DISCUSSION
The kinetic studies presented in this paper showed that V10inhibits the actin-stimulated ATPase activity of myosin S1, with an IC50in the micromolar range, that this inhibition is noncompetitive either with actin or with ATP, and suggested that it can be due to the interaction of V10 with one inhibitory binding site per myosin S1 with a Kivalue of 0.27 ( 0.05 µM at pH 7.0 in the conditions used for the
kinetic assays. This Ki value is in the range of Ki values usually found for enzymes inhibited by V10(53). The large effect of KCl on the dissociation constant of V10from S1 indicates that electrostatic interactions plays a major role in V10 (a polyanion) binding to myosin. The presence of a binding site for polyvalent anions in the head of myosin has been well documented (14, 54-57), and it was proposed that they could account for the inhibition of the actomyosin ATPase activity by polyvalent anions (54). Although the surface electrostatic charge contour of S1 reveals the presence of a protein region positively charged from residues 627 to 646, containing five Lys (loop 2), which makes part of the actin-binding interface (50), it is very unlikely that the V10 polyanion high-affinity binding site we are probing at the present work is located at this protein region because V10 binding to S1 is not affected by actin.
In this paper, we have shown that S1 labeled at Cys-707 with IAEDANS or IAF monitor the presence of one V10 binding site per monomer, with a dissociation constant in the submicromolar range in the absence of nucleotides (ADP or ATP), Kd) 0.16-0.26 µM at 25 mM KCl concentration. These values of the dissociation constant of the V10‚S1 complex are close to the values for the inhibition constant
Kiobtained from kinetic studies carried out with unlabeled S1 under the same experimental conditions, showing that
FIGURE5: Effect of decameric vanadate on the dissociation and aggregation of the acto-S1 complex. (A) Light scattering of the acto-S1 complex (solid line) upon sequential additions of 5µM
V10(50µM total vanadium added as decavanadate) plus 0.25 mM ATP. (B) Light scattering of the acto-S1 complex upon ATP (0.25 mM) addition in the absence (solid line) or presence of 50 µM
metavanadate (dash line). (C) Light scattering of the acto-S1 complex upon ATP (0.25 mM) addition in the absence (solid line) or presence of 1µM (dash line) and 5 µM (dot line) V10, i.e., 10 and 50µM total vanadium added as decavanadate, respectively.
Light scattering intensity at 90°with respect to the incident light was measured with monochromators set at 500 nm, and is given in arbitrary units (a.u.). The line joining circles denotes the sum of S1 (triangles) plus actin (squares) light scattering intensities, and the large double-headed arrows is the expected decrease of light scattering for a 100% ATP-induced dissociation of the actin-S1 complex. The recovery of the light scattering monitored acto-S1 complex reassociation in the absence, or presence of 1 and 5µM
V10, i.e., 10 and 50µM total vanadium added as decavanadate (inset plot). The experiments were carried out at 25°C in 20 mM Hepes (pH 7.0), 25 mM KCl and 2.5 mM MgCl2with 0.9µM of S1 and 2µM actin.
labeling of S1 at Cys-707 produced only a minor distortion of the V10binding site. In contrast, titration of S1(AEDANS, SH2) and of S1(AF, SH2) with metavanadate showed that orthovanadate has a much weaker affinity for S1, i.e., a Kd > 50 µM, and consistently orthovanadate was found to be only a weak competitor of decameric vanadate for binding to this site. It is also shown that binding of V10species can be monitored as well from the quenching of the fluorescence of S1 labeled with IAEDANS and IAF at the Cys-697 (SH2 group), located 1.8 nm from Cys-707 in the 3D-structure of S1 (50), yielding values for the dissociation constant which are similar to those obtained with S1 labeled with these dyes at Cys-707 (SH1group).
The extent of quenching produced by V10on S1(AEDANS, SH2) (30% at saturation) is much higher than the quenching produced at saturation upon binding of many ligands to S1-(AEDANS, SH2) (23). Also, the quenching produced by V10 on S1(SH1, AEDANS) (35-40% at saturation) is about 15-20% higher than that produced on S1(SH1, AF) (20-25% at saturation), although the labels were incorporated to the same Cys-697 in S1 (see Materials and Methods). The simplest way to account for this anomalous high quenching is that V10 binds to a site very close to the AEDANS covalently bound to S1, thereby producing a highly efficient static quenching (which implies that both sites are separated by at most 1.0 nm (58)) or acting as a good acceptor for the fluorescence of AEDANS due to its absorption in the emission wavelength range of AEDANS (calculated value of the overlap integral J ) 0.223× 10⁻¹⁵cm3M-1). In this latter case, assuming that the excess quenching produced by V10 on S1(SH1, AEDANS) with respect to that measured for S1(SH1, AF) is due to energy transfer from IAEDANS to V10, with the overlap integral indicated above and the quantum yield obtained for AEDANS labeled S1 (QD) 0.18 ( 0.03, calculated as indicated in the Materials and Methods) we obtain an R0 value of 1.39 ( 0.04 nm for this donor/ acceptor energy transfer pair. Using eq 1 (see Materials and Methods), this will imply that the binding site for V10is only at 1.2-1.3 nm distance from AEDANS covalently bound to Cys-697 in S1. The uncertainty caused by the assumption of random orientation between AEDANS and V10 in this distance estimation is low because (i) the measured fluores-cence anisotropy of the donor (AEDANS bound to S1) is 0.15, which indicates a large rotational mobility of the donor (calculated rotational cone semiangleθ ) 41.5° (see 38)); and (ii) the quasi-spherical geometry of the acceptor V10.
The flexible loop between Cys-707 and Cys-697 is thought to act as an energy transduction element through which intersite communication between ATP and actin binding sites is transmitted. In fact, this region is known to change its conformation along the ATPase kinetic pathway (21, 24, 25). Therefore, conformational changes leading to transient intermediate states during the catalytic cycle could alter the affinity of myosin S1 for V10. ADP‚V1and ADP‚AlF4have been shown to shift S1 to a state close to the M**‚ADP‚Pi intermediate state generated during myosin ATPase activity (22, 59, 60). Noteworthy, the dissociation constant of S1 for V10increased approximately 2- and 3-fold in the presence of ADP‚V1and ADP‚AlF4, respectively, suggesting that V10 has 2-3-fold lower affinity for the conformational state M**‚ ADP‚Pi than for S1 conformational state in absence of
nucleotide. Different affinities for V10of different confor-mational states of myosin S1 should be expected to produce an altered distribution of conformational states during steady-state S1 catalytic activity in the presence of V10. In the present work, it is demonstrated that V10 induced a small change in the light scattering of the actin-S1 complex and a decrease of the fluorescence energy transfer between IAF-S1, with the donor dye covalently attached to Cys-707 of myosin, and eosin-F-actin, with the acceptor dye covalently attached to Cys-374 of actin. The decrease of fluorescence energy transfer produced by V10 in the IAF-S1/eosin-F-actin complex can be accounted for an increase of 3.0 ( 1.2 Å of the distance between donor and acceptor dyes or a change in the relative orientation between donor and acceptor of about 25°. Such a change in distance falls within the range of conformational-induced changes in distance between one dye covalently bound to selected Cys or Lys amino acids in the myosin S1 and a second dye attached to F-actin (48,
52), and also is in good agreement with the reported dynamic
structural fluctuation range of the myosin S1 between Cys-707 and Cys-697 (61, 62).
In presence of saturating concentrations of AP5A the association constant for V10binding to S1 is approximately 36-fold lower than in absence of AP5A. Furthermore, at saturation V10also decreased almost 4-fold the association constant for AP5A binding to S1. Therefore, V10and AP5A compete for binding to S1, suggesting that their binding sites partially overlap or that they are very close in the 3D protein structure. Computer molecular docking of AP5A to S1 has shown that thisγ-phosphate modified nucleotide analogue
binds to S1, extending from the nucleotide binding site through the phosphate tube leading to the 50-K cleft (16,
49), but through a prior opening of the phosphate tube. This
tube structure that connects the nucleotide crevice of the catalytic center and the back door in the 50-K cleft switches between open and closed states during the catalytic cycle (16, 49). Release of myosin from actin is caused by opening the cleft between the lower and upper domains of the 50-kDa segment when theγ-phosphate from ATP binds in the
active site pocket (50). Theγ-phosphate of ATP lies adjacent
to Ser-180 and Ser-243, two residues known to be photo-modified by vanadate upon UV irradiation (15). Ser-180 is located on the 178-185 sequence which forms the consensus ATP binding site of myosin and is homologous to the polyphosphate binding site of a number of nucleotide binding enzymes (63). Recently, Pezza et al. (64) have shown that the Walker A motif of ABC ATPases is a highly adapted anion-binding domain that can bind V10with a dissociation constant in the micromolar range and produce noncompetitive inhibition. According to these authors, once the complex decavanadate-ADP-Mg-protein is established, the ATP/ ADP exchange can be blocked, resulting in noncompetitive inhibition with respect to ATP. In the present work, the putative binding of V10to the P-loop in S1 3D structure can account for the results reported, briefly: (i) noncompetitive inhibition with actin and ATP of the actin-stimulated S1-ATPase activity and slower reassociation between S1 and actin after ATP hydrolysis; (ii) large alteration of the fluorescence of AEDANS and AF covalently bound to Cys-707 and Cys-697 located near the P-loop in the 3D structure of S1; (iii) competition with AP5A for binding to S1; and (iv) a conformational shift of S1, as this P-loop orientation
changes during the conformational changes taking place in the catalytic cycle of ATP hydrolysis (49).
In summary, the results are consistent with binding of V10 to the Walker A motif of ABC ATPases, which in S1 corresponds to conserved regions of the P-loop that form part of the phosphate tube. This V10 high-affinity binding site produces noncompetitive inhibition of the actin-stimulated S1-ATPase activity, without causing dissociation of the acto-S1 complex. Moreover, the affinity of S1 for V10is modulated by the conformational changes that takes place in S1 during the catalytic cycle, as indicated by the 2-3-fold increase of the dissociation constant produced in the presence of ADP‚V1 and ADP‚AlF4, which induce a conformational state close to the M**‚ADP‚Piintermediate state generated during myosin ATPase activity. Therefore, the V10 species can be a useful tool to gain a deeper knowledge of the “back door” modulation of the actin-stimulated myosin ATPase activity and its relevance to actomyosin interactions.
REFERENCES
1. Chasteen, N. D. (1983) The biochemistry of vanadium. Struct. Bonding 53, 105-138.
2. Petterson, L., Andersson, I., and Hedman, B. (1985) Multicom-ponent polyanions. Chem. Scr. 25, 309-317.
3. Crans, D. C., Rithner, C. D., and Theisen, L. A. (1990) Time-resolved51V 2-D NMR for studies of kinetic exchange between
vanadate oligomers. J. Am. Chem. Soc. 112, 2901-2908. 4. Farahbakhsh, M., Ko¨gerler, P., Schmidt, H., and Rehder, D. (1998)
Wrapping oxometalates with macrocyclic ligands: the decavana-date-cryptand system. Inorg. Chem. Commun. 1, 111-114. 5. Aureliano, M., Joaquim, N., Sousa, A., Martins, H., Coucelo, J.
M. (2002) Oxidative stress in toadfish (Halobatrachus didactylus) cardiac muscle: Acute exposure to vanadate oligomers. J. Inorg. Biochem. 90, 159-165.
6. Soares, S. S., Aureliano, M., Joaquim, N., Coucelo, J. M. (2003) Cadmium and vanadate oligomers effects on metahemoglobin reductase activity from Lusitanian toadfish: in vivo and in vitro studies. J. Inorg. Biochem. 94, 285-290.
7. Stankiewicz, P. J., Tracey, A. S., and Crans, D. C. (1995) Inhibition of phosphate-metabolizing enzymes by oxovanadium(V) com-plexes in Metal ions in Biological Systems: Vanadium and its Role in Life (Sigel H., Sigel A., Ed.), pp 287-324, Marcel Dekker, New York.
8. Toyoshima, Y. Y., Kron, S. J., McNally, E. M., Niebling, K. R., Toyoshima, C., and Spudich, J. A. (1987) Myosin subfragment-1 is sufficient to move actin filaments in vitro. Nature 328, 536-539.
9. Lymn, R. W., and Taylor, E. W. (1971) Mechanism of adenosine triphosphate hydrolysis by actomyosin. Biochemistry 10, 4617-4624.
10. Goodno, C. C. (1979) Inhibition of myosin ATPase by vanadate ion. Proc. Natl. Acad. Sci. U.S.A. 76, 2620-2624.
11. Goodno, C. C. (1982) Myosin active-site trapping with vanadate ion. Methods Enzymol. 85, 116-123.
12. Goodno, C. C., and Taylor, E. W. (1982) Inhibition of actomyosin ATPase by vanadate. Proc. Natl. Acad. Sci. U.S.A. 79, 21-25. 13. Smith, S. J., and Eisenberg, E. (1990) A comparison of the effect of vanadate on the binding of myosin-subfragment-1 ‚ ADP to actin and on actomyosin subfragment 1 ATPase activity. Eur. J. Biochem. 193, 69-73.
14. Ringel, I., Peyser, Y. M., and Muhlrad, A. (1990)51V NMR study
of vanadate binding to myosin and its subfragment 1. Biochemistry 29, 9091-9096.
15. Cremo, C. R., Long, G. T., and Grammer, J. C. (1990) Photo-cleavage of myosin subfragment 1 by vanadate. Biochemistry 29, 7982-7990.
16. Yount, R. G., Lawson, D., and Rayment, I. (1995) Is myosin a “back door” enzyme? Biophys. J. 68, 44s-49s.
17. Aureliano, M. (2000) Vanadate oligomer interactions with myosin. J. Inorg. Biochem. 80, 141-143.
18. Tiago, T., Aureliano, M., and Gutie´rrez-Merino, C. (2002) Quenching of myosin intrinsic fluorescence unravels the existence of a high affinity binding site for decavanadate. J. Fluoresc. 12, 87-90.
19. Howarth, O. W., and Jarold, M. (1978) Protonation of the decavanadate (6-) ion: a vanadium-51 nuclear magnetic resonance study. J. Chem. Soc., Dalton 503-506.
20. Cheung, H. C., Gonsoulin, F., and Garland, F. (1983) Fluorescence energy transfer studies on the proximity of the two essential thiols of myosin subfragment-1. J. Biol. Chem. 258, 5775-5786. 21. Aguirre, R., Gonsoulin, F., and Cheung, H. C. (1986) Interaction
of fluorescently labeled myosin subfragment-1 with nucleotides and actin. Biochemistry 25, 6827-6835.
22. Werber, M. M., Peyser, M., and Muhlrad, A. (1992) Characteriza-tion of stable beryllium fluoride, aluminum fluoride, and vanadate containing myosin subfragment-1 nucleotide complexes. Bio-chemistry 31, 7190-7197.
23. Phan, B. C., Peyser, Y. M., Reisler, E., and Muhlrad, A. (1997) Effect of complexes of ADP and phosphate analogues on the conformation of the Cys707-Cys697 region of myosin subfragment 1. Eur. J. Biochem. 243, 636-642.
24. Reisler, E. (1982) Sulfhydryl modification and labeling of myosin. Methods Enzymol. 85, 84-93.
25. Maruta, S., Aihara, T., Uyehara, Y., Homma, K., Sugimoto, Y., and Wakabayashi, K. (2000) Solution Structure of myosin-ADP-MgFn ternary complex by fluorescent probes and small-angle synchroton X-ray scattering. J. Biochem. 128, 687-694. 26. Pires, E. M. V., Perry, S. V., and Thomas, M. A. W. (1974) Myosin
light-chain kinase, a new enzyme from striated muscle. FEBS Lett. 41, 292-296.
27. Margossian, S. S., and Lowey, S. (1982) Preparation of myosin and its subfragments from rabbit skeletal muscle. Methods Enzymol. 85, 55-72.
28. Pardee, J. D., and Spudich, J. A. (1982) Purification of muscle actin. Methods Enzymol. 85, 164-181.
29. Aureliano, M., and Madeira, V. M. C. (1994) Interactions of vanadate oligomers with sarcoplasmic reticulum Ca2+-ATPase.
Biochim. Biophys. Acta 1221, 259-271.
30. Aureliano, M., and Madeira, V. M. C. (1998) Energy transduction mechanisms as affected by vanadium(V) species: Ca2+-pumping
in sarcoplasmic reticulum. AdV. EnViron. Sci. 30, 333-357. 31. Crans, D. C. (1994) Aqueous chemistry of labile oxovanadates:
relevance to biological studies. Comments Inorg. Chem. 16, 1-33. 32. Crans, D. C. (1994) Enzyme interactions with labile oxovanadates and other polyoxometalates. Comments Inorg. Chem. 16, 35-76. 33. Cuenda, A., Henao, F., and Gutie´rrez-Merino, C. (1990) Distances between functional sites of the Ca2+-ATPase from sarcoplasmic
reticulum using Co2+as a spectroscopic ruler. Eur. J. Biochem.
194, 663-670.
34. Bradford, M. M. (1976) A rapid and sensitive method for the quantification of microgram quantities of protein utilizing the principle of protein-dye binding. Anal. Biochem. 72, 248-254. 35. Fiske, C. H., and Subbarow, Y. (1925) The colorimetric
deter-mination of phosphorus. J. Biol. Chem. 66, 375-400.
36. Titus, M. A., Ashiba, G., and Szent-Gyo¨rgy, A. G. (1989) SH-1 modification of rabbit myosin interferes with calcium regulation. J. Muscle Res. Cell Motil. 10, 25-33.
37. Lakowicz, J. R. (1983) in Principles of Fluorescence Spectroscopy, pp 44-45, Plenum Press, New York.
38. Weber, G. (1966) in Fluorescence and Phosphorescence Analysis (Hercules, D. M, Ed.), pp 217-240, John Wiley and Sons, New York.
39. Stryer, L. (1978) Fluorescence energy transfer as a spectroscopic ruler. Annu. ReV. Biochem. 47, 819-846.
40. Gutie´rrez-Merino, C., Munkonge, F., Mata, A. M., East, J. M., Levinson, B. L., Napier, R. M., and Lee, A. G. (1987) The position of the ATP binding site on the (Ca2+, Mg2+)-ATPase. Biochim.
Biophys. Acta 897, 207-216.
41. Fo¨rster, T. (1965) in Modern Quantum Chemistry (Sinanoglu, O., Ed.), Academic Press, New York.
42. Centeno, F., and Gutie´rrez-Merino, C. (1992) Location of func-tional centers in the microsomal cytochrome P450 system. Biochemistry 31, 8473-8481.
43. Bauer, C. B., Kuhlman, P. A., Bagshaw, C. R., and Rayment, I. (1997) X-ray Crystal Structure and Solution Fluorescence Char-acterization of Mg‚2′(3′)-O-(N-Methylanthraniloyl) Nucleotides Bound to the Dictyostelium discoideum Myosin Motor Domain. J. Mol. Biol. 274, 394-407.
44. Cooper, J. A., and Pollard, T. D. (1982) Methods to measure actin polymerisation. Methods Enzymol. 85, 182-211.
45. Balint, M., Wolf, I., Tarcsafalvi, A., Gergely, J., and Sreter, F. A. (1978) Location of SH-1 and SH-2 in the heavy chain segment of heavy meromyosin. Arch. Biochem. Biophys. 190, 793-799. 46. Eisenberg, E., and Hill, T. L. (1985) Muscle contraction and free energy transduction in biological systems. Science 227, 999-1006. 47. Lin, S. H., and Cheung, H. C. (1991) Two-state equilibria of myosin subfragment 1 and its complexes with ADP and actin. Biochemistry 30, 4317-4322.
48. Xing, J., and Cheung, H. C. (1995) Internal movement in myosin subfragment 1 detected by fluorescence resonance energy transfer. Biochemistry 34, 6475-6487.
49. Pate, E., Naber, N., Matuska, M., Franks-Skiba, K., and Cooke, R. (1997) Opening of the myosin nucleotide triphosphate binding domain during the ATPase cycle. Biochemistry 36, 12155-12166. 50. Rayment, I., Rypniewski, W. R., Schmidt-Ba¨se, K., Smith, R., Tomchick, D. R., Benning, M. M., Winkelmann, D. A., Wesen-berg, G., and Holden, H. M. (1993) Three-dimensional structure of myosin subfragment-1: a molecular motor. Science 261, 50-58.
51. Trayer, H. R., and Trayer, I. P. (1983) Fluorescence energy transfer between the myosin subfragment-1 isoenzymes and F-actin in the absence and presence of nucleotides. Eur. J. Biochem. 135, 47-59.
52. Smyczynski, C., and Kasprzak, A. A. (1997) Effect of nucleotides and actin on the orientation of the light chain-binding domain in myosin subfragment 1. Biochemistry 36, 13201-13207. 53. Messmore, J. M., and Raines, R. T. (2000) Decavanadate inhibits
catalysis by ribonuclease A. Arch. Biochem. Biophys. 381, 25-30.
54. Labbe´, J. P., Bertrand, R., Audemard, E., Kassab, R., Walzthony, D., and Wallimann, T. (1984) The interaction of skeletal myosin subfragment 1 with the polyanion, heparin. Eur. J. Biochem. 143, 315-322.
55. Chaussepied, P., Mornet, D., and Kassab, R. (1986) Identification of polyphosphate recognition sites communicating with actin sites on the skeletal myosin subfragment 1 heavy chain. Biochemistry 25, 6426-6432.
56. Muhlrad, A. (1991) The isolated 21 kDa N-terminal fragment of myosin binds to actin in an ATP and ionic strength-dependent manner. Biochim. Biophys. Acta 1077, 308-315.
57. Sanz, S., Gil, M. J., Lopez-Zabalza, M. J., Lopez-Moratalla, N., and Santiago, E. (1992) Conformational changes of S-1 related to its dissociation from actin. ReV. Esp. Fisiol. 48, 51-57. 58. London, E., and Feigenson, G. W. (1981) Fluorescence Quenching
in Model membranes. 1. Characterization of Quenching Caused by a Spin-Labeled Phospholipid. Biochemistry 20, 1932-1938. 59. Peyser, Y. M., Ben-Hur, M., Werber, M. M., and Muhlrad, A. (1996) Effect of divalent cations on the formation and stability of myosin subfragment 1-ADP-phosphate analog complexes. Biochemistry 35, 4409-4416.
60. Smith, R., and Rayment, I. (1996) X-ray structure of the magnesium(II)‚ADP‚vanadate complex of the Dictyostelium dis-coideum myosin motor domain to 1.9 Å resolution. Biochemistry 35, 5404-5417.
61. Cheung, H. C., Garland, F., and Gonsoulin, F. (1985) An investigation of the SH1-SH2 and SH1-ATPase distances in myosin subfragment-1 by resonance energy transfer using nano-second fluorimetry. Biochim. Biophys. Acta 832, 52-62. 62. Cheung, H. C., Gryczynski, I., Malak, H., Wiczk, W., Johnson,
M. L., and Lakowicz, J. R. (1991) Conformational flexibility of the Cys 697-Cys 707 segment of myosin subfragment-1. Distance distributions by frequency-domain fluorometry. Biophys. Chem. 40, 1-17.
63. Walker, J. E., Saraste, M., Runswick, M. J., and Gay, N. J. (1982) Distantly related sequences in the alpha- and beta-subunits of ATP synthase, myosin, kinases and other ATP-requiring enzymes and a common nucleotide binding fold. EMBO J. 1, 945-951. 64. Pezza, R. J., Villarreal, M. A., Montich, G. G., and Argaran˜a, C.
E. (2002) Vanadate inhibits the ATPase activity and DNA binding capability of bacterial MutS. A structural model for the vanadate-MutS interaction at the Walker A motif. Nucleic Acids Res. 30, 4700-4708.