U
NIVERSIDADE DE
L
ISBOA
Faculdade de Ciˆencias
Departamento de Inform´atica
ANALYSIS AND IMPLEMENTATION OF
CONSISTENCY AND FAULT TOLERANCE
MECHANISMS IN SOFT REAL-TIME SYSTEMS
Pedro Miguel Ferreira Figueira
PROJETO
MESTRADO EM ENGENHARIA INFORM ´
ATICA
Especializac¸˜ao em Arquitectura, Sistemas e Redes de Computadores
2014
U
NIVERSIDADE DE
L
ISBOA
Faculdade de Ciˆencias
Departamento de Inform´atica
ANALYSIS AND IMPLEMENTATION OF
CONSISTENCY AND FAULT TOLERANCE
MECHANISMS IN SOFT REAL-TIME SYSTEMS
Pedro Miguel Ferreira Figueira
PROJETO
MESTRADO EM ENGENHARIA INFORM ´
ATICA
Especializac¸˜ao em Arquitectura, Sistemas e Redes de Computadores
Dissertac¸˜ao orientada pelo Prof. Doutor Ant´onio Casimiro Ferreira da Costa e por Eng. Jos´e Ant´onio dos Santos Alegria
Acknowledgments
First and foremost I would like to thank my supervisors, Prof. Dr. Ant´onio Casimiro and Eng. Jos´e Alegria for granting me this opportunity and for mentoring during the duration of the project. A special thanks for the project’s manager Jo˜ao Duarte for guiding my work, and for many hours of interesting and challenging discussions trying to find solutions for solving the problems presented during the thesis. I would also like to thank Pedro In´acio and the remainder of the PT Comunicac¸˜oes’ team for all their advice and support during my time at PT.
I also need to thank all my friends that throughout the years helped me overcome any and all obstacles. Your friendship is invaluable and hopefully will stand the test of time.
Last but not least, I am grateful to my family, Alexandrina and Vasco, my parents and brother, for their patience and for giving me the strength and inspiration to pursue my goals and be successful.
Resumo
Neste projecto pretende-se explorar a implementac¸˜ao de soluc¸˜oes de tolerˆancia a fal-tas num sistema de monitorizac¸˜ao de rede. A monitorizac¸˜ao ´e feita numa grande rede empresarial, com um volume de informac¸˜ao significativo devido ao elevado n´umero de clientes que a empresa de telecomunicac¸˜oes tem a n´ıvel nacional.
Por norma, n˜ao podemos evitar todas as faltas, ´e preciso toler´a-las replicando os com-ponentes do sistema para o tornar mais confi´avel. ´E necess´ario fazer uma an´alise deta-lhada a cada componente, verificar as falhas existentes e prov´aveis, e, se poss´ıvel, alterar a arquitectura de modo a colmatar as falhas identificadas.
Para al´em de efectuarmos a an´alise `a confiabilidade do sistema, que foi o foco princi-pal do projecto, algum do trabalho incidiu sobre a necessidade de melhorar a monitorizac¸˜ao do sistema, isto ´e, foi necess´ario extrair m´etricas e indicadores relevantes que possibili-tam uma melhor introspecc¸˜ao permitindo despoletar acc¸˜oes de recuperac¸˜ao autom´aticas e uma visualizac¸˜ao mais completa do estado do sistema.
Partindo do estado inicial, o objectivo foi analisar detalhadamente o sistema: a sua arquitectura, os componentes que o constituem e o seu funcionamento. Partindo dessa an´alise, foram elaborados casos de uso que serviram de base para a execuc¸˜ao de testes ao sistema, permitindo retirar conclus˜oes de como melhorar a confiabilidade e adicionar mecanismos de tolerˆancia a faltas ao sistema.
A arquitectura do sistema foi analisada antes da realizac¸˜ao dos testes, resultando na elaborac¸˜ao de diagramas representativos em diferentes n´ıveis de abstracc¸˜ao, nomeada-mente ao n´ıvel da infraestrutura e ao n´ıvel dos servic¸os. Adicionalnomeada-mente, todas as ferra-mentas usadas no projecto foram revistas identificando os seus objectivos e prop´ositos.
A realizac¸˜ao dos testes ao sistema permitiu delimitar a capacidade de processamento de cada um dos componentes e identificar o comportamento e consequˆencias resultantes da injecc¸˜ao de faltas em situac¸˜oes predeterminadas. Os resultados e conclus˜oes extra´ıdos foram registados e serviram de base para o desenho de soluc¸˜oes aplic´aveis ao sistema com o objectivo de corrigir as falhas identificadas.
Ap´os as modificac¸˜oes iniciais a estabilidade do sistema foi melhorada, resultado da adic¸˜ao de capacidades de recuperac¸˜ao autom´atica aos componentes do sistema, isto ´e, ao ocorrerem falhas identificadas e previs´ıveis, o sistema ´e capaz de retornar ao estado correcto de funcionamento sem qualquer necessidade de intervenc¸˜ao humana. Este tipo
de comparac¸˜ao foi realizada em pontos-chave do projecto com o objectivo de registar os resultados das implementac¸˜oes realizadas em cada etapa.
A fase final consistiu em desenhar soluc¸˜oes que permitissem adicionar redundˆancia ao sistema com o objectivo de introduzir tolerˆancia a faltas no sistema. Foi necess´aria uma m´aquina f´ısica adicional e, antes de ser escolhida a soluc¸˜ao final, foi realizado o levantamento do estado da arte relativo `as t´ecnicas utilizadas nesta ´area.
Das v´arias opc¸˜oes estudadas, um subconjunto foi testado em ambiente de desenvol-vimento. As soluc¸˜oes escolhidas para implementac¸˜ao tiveram em conta a facilidade e aspecto pr´atico, bem como as vantagens e desvantagens de cada opc¸˜ao.
No final, temos um sistema tolerante a faltas, replicado em duas m´aquinas f´ısicas que se supervisionam mutuamente tendo a capacidade de tolerar a falha de uma das m´aquinas.
Palavras-chave: confiabilidade, tolerˆancia a faltas, sistemas distribu´ıdos, replicac¸˜ao, disponibilidade, monitorizac¸˜ao
Abstract
This project aims to explore the implementation of fault tolerance solutions in a net-work monitoring system. Monitoring is performed on a large corporate netnet-work, with a significant information volume derived from the large number of customers that the telecommunications company has nationwide.
As a rule we cannot avoid all faults, one has to tolerate them by replicating system components to make them more reliable. It is necessary to make a detailed analysis of each component, checking for flaws and possible improvements and, if possible, change the architecture so as to bridge the identified gaps.
In addition, our approach takes into account the necessity of monitoring of both the corporate network as well as the system’s state. Regarding the monitored network, dis-playing a metrics panel is of high importance so that there is an efficient visibility of the system state.
The practical contributions began with the improvement of the system when there is a single machine deployed, testing and reporting any and all options to increase its reliability and fault tolerance. After the initial modifications, the behavior of the machine was much improved. The corrections and software updates made the node fully capable of returning to a working state in the event of the identified and predictable failures that each component is prone to.
After these improvements, the following work focused on adding redundancy to the system in order to introduce fault tolerance. It required an additional physical machine and, before committing to a final solution, surveying the state of the art techniques used in the field.
Of the several options studied, a subset was tested in the development environment. The implemented solutions took into account the easiness and practicality as well as the advantages and disadvantages of each option.
In the end, we have a fault tolerant system, replicated in two physical machines that monitor each other in order to tolerate the failure of one the them.
Keywords: dependability, fault tolerance, distributed systems, replication, availability, monitoring
Contents
List of Figures xviii
List of Tables xxi
1 Introduction 1
1.1 Motivation . . . 1
1.2 Objectives and Planning . . . 2
1.3 Contributions . . . 3
1.4 Document Structure . . . 3
2 Related Work and Technologies 7 2.1 Monitoring Concepts . . . 7
2.2 Metrics and Measurements . . . 10
2.3 Real-Time Systems . . . 11
2.4 Fault Tolerant Computing and Dependability Concepts . . . 12
2.4.1 Dependability . . . 13
2.4.2 Faults Classification . . . 13
2.4.3 Strategies and Mechanisms . . . 15
2.4.4 Redundancy . . . 16
2.4.5 Common-Mode and Common-Cause Failures . . . 16
2.5 Existing Monitoring Solutions . . . 17
2.5.1 Nagios . . . 18
2.5.2 Zenoss . . . 18
2.5.3 Sensu . . . 18
2.5.4 TRONE . . . 19
2.6 Summary . . . 20
3 NETS System Analysis 23 3.1 Methodology . . . 23
3.2 NETS System Tools . . . 23
3.2.1 logstash . . . 24
3.2.2 RabbitMQ . . . 24
3.2.3 Esper . . . 24 3.2.4 Graphite . . . 24 3.2.5 Statsd . . . 25 3.2.6 Monit . . . 25 3.3 NETS Architecture . . . 25 3.3.1 Physical View . . . 25 3.3.2 Software View . . . 26
3.3.3 First Phase - Inputs . . . 28
3.3.4 Second Phase - Processing . . . 28
3.3.5 Third Phase - Outputs . . . 29
3.4 Fault Modeling . . . 29 3.4.1 Stream of Events . . . 29 3.4.2 Syslog . . . 30 3.4.3 ETL syslog . . . 30 3.4.4 ETL radius . . . 30 3.4.5 Cadastro . . . 30 3.4.6 MB RabbitMQ . . . 30 3.4.7 CEP Esper . . . 31
3.4.8 ETL espermetrics and ETL alarms . . . 31
3.4.9 ETL alarms worker . . . 31
3.5 Fault Testing . . . 31
3.5.1 NETS Normal State With Regular Load . . . 31
3.5.2 Stream of Events - Load Simulation . . . 32
3.5.3 Stopped Stream of Events and Closed Ports . . . 35
3.5.4 Crash Faults . . . 36
3.5.5 File Deletion/Corruption . . . 38
3.5.6 Lack of Disk Space . . . 39
3.5.7 Bottlenecks . . . 40
3.6 Risk Analysis . . . 41
3.7 Summary . . . 42
4 Solution Design 45 4.1 Proposals for individual component enhancements . . . 45
4.1.1 Stream of events . . . 45
4.1.2 Crash syslog-ng . . . 46
4.1.3 Crash Esper . . . 46
4.1.4 Crash RabbitMQ . . . 46
4.1.5 File Deletion/Corruption . . . 47
4.1.6 Lack of Disk Space . . . 48
4.2 Redundancy Analysis . . . 48
4.2.1 Byzantine Fault Tolerance / Arbitrary Faults . . . 48
4.2.2 Common-Cause / Common-Mode Faults . . . 49
4.2.3 Input Handling . . . 50
4.2.4 Output Conciliation . . . 52
4.2.5 Architectures . . . 52
4.3 Proposals for Fault Tolerance Enhancements at System Level . . . 55
4.3.1 Port Mirroring . . . 55
4.3.2 Load Distributor . . . 55
4.3.3 Virtual IP . . . 56
4.4 Summary . . . 56
5 Implementations 59 5.1 Enhancements of individual components . . . 59
5.1.1 Visualization Improvement - Scripts . . . 59
5.1.2 Traffic Generator (Stresser) . . . 60
5.1.3 Fault Injection and Behavior Monitoring . . . 61
5.1.4 Configuring RabbitMQ . . . 62
5.2 Enhancements at system level . . . 62
5.2.1 Load Distributor . . . 62
5.2.2 Monitor for Alarm Transmission State . . . 62
5.2.3 Introduce Fault Tolerance . . . 62
5.3 Summary . . . 63
6 Evaluation 65 6.1 Comparison between the initial state and after individual improvements . 65 6.2 Comparison between initial condition and improvements at the system level 65 6.3 Summary . . . 66
7 Conclusion 67 7.1 Achievements . . . 68
7.2 Future Work . . . 68
A UML Activity and Sequence Diagrams 71 B Fault Testing Details 75 B.1 DSL . . . 75 B.2 STB . . . 76 B.3 RADIUS . . . 76 B.4 DSL-FLAP . . . 76 Bibliograhy 85 xv
List of Figures
2.1 Generic structure of monitoring applications. . . 8
2.2 Dependability tree. . . 12
2.3 Relationship between fault classes. . . 14
3.1 NETS Physical View. . . 26
3.2 NETS Software Architecture. . . 26
3.3 NETS Operation Phases. . . 27
3.4 NETS regular load. . . 32
3.5 NETS regular load stats. . . 32
3.6 Test - DSL. . . 33
3.7 Test - STB. . . 34
3.8 Test - RAD. . . 34
3.9 Test - ALARMS. . . 35
3.10 Test - ETL Alarms. . . 37
3.11 Risk Management Priority. . . 41
4.1 BFT Architecture. . . 49 4.2 Dynamic IP. . . 51 4.3 Architecture 1. . . 53 4.4 Architecture 2. . . 54 4.5 Architecture 3. . . 55 4.6 Architecture 4. . . 56
A.1 NETS Phases. . . 71
A.2 Parse Message and Write Log. . . 72
A.3 Parse Radius Message. . . 72
A.4 Parse Syslog Message. . . 72
A.5 Handle Messages. . . 73
A.6 Perform Pattern Matching. . . 73
A.7 Correlate Events. . . 74
A.8 Send Esper Metrics. . . 74
A.9 Issue Alarm. . . 74
A.10 Send Alarm Metrics. . . 74
B.1 STB Total Processed Messages’ Rate During Test. . . 76
B.2 STB Individual Processed Messages’ Rate During Test. . . 77
B.3 RADIUS Total Processed Messages’ Rate During Test. . . 77
B.4 RADIUS Individual Processed Messages’ Rate During Test. . . 77
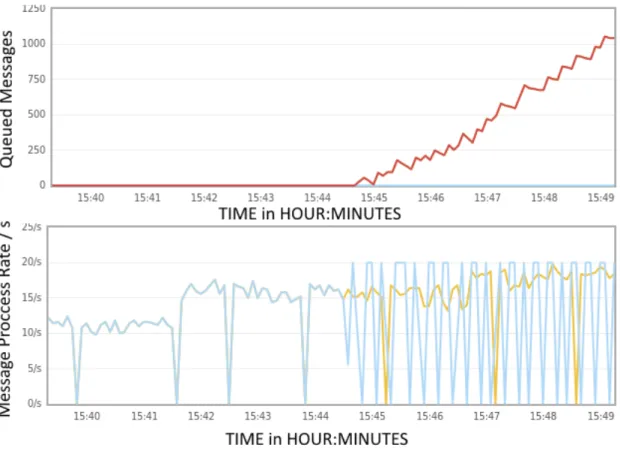
B.5 DSL-FLAP Total Alarms in Queue. . . 79
List of Tables
3.1 NETS Source types and volumes. . . 28 3.2 NETS Risk Analysis. . . 42
4.1 Architectures Chart. . . 56 6.1 Milestone Comparison. . . 66
B.1 DSL Fault Testing . . . 75 B.2 STB Fault Testing . . . 76 B.3 RADIUS Fault Testing . . . 78 B.4 DSL-FLAP Testing Times . . . 78
Chapter 1
Introduction
This chapter serves as an introduction to the project’s motivations and objectives, a sum-mary of the contributions made and to present the structure of the document.
1.1
Motivation
With the growing competition in Portugal in providing internet services and IPTV1, cus-tomer retention is crucial for the providing companies. On the other hand, the complexity of highly distributed systems that support these services tend to originate flaws in multiple layers of the OSI model [14]. The intersection of these realities is something that provid-ing companies should care about and invest great efforts to improve customer service in the presence of faults.
A customer that experiences poor to faulty (or even inexistent) internet connection or television service can quickly become dissatisfied, possibly leading to a contact with the support call center, a visit to the customers home by a tech team or even the contract can-cellation. In all these cases the company loses money in the process. The Network Event Trouble Seeker (NETS) is a project that originated and is developed at PT Comunicac¸˜oes that attempts to detect anomalies possibly affecting customer services and trigger auto-mated correction procedures for solving them, hopefully before they are noticed by the customer. This system was designed to help oversee the wired network, and includes pro-cesses of filtering, aggregation and soft real-time correlation of basic network events. It applies soft real-time detection of relevant patterns to these events indicating suspected anomalies that affect either individual clients or groups of customers (common faults).
It is possible to take advantage of the real-time delivery of log flows sent by network equipments to reduce latency in the detection of problems, enrich or create new processes of detection, correct and / or deter problems affecting the quality of customer service. In PT Comunicac¸˜oes, detected situations and evidence are forwarded to the Sistema Geral de Alarmes (SGA) for analysis and correction by operational teams.
1Internet Protocol television
Chapter 1. Introduction 2
In order to provide a reliable service to the company’s operation department, systems such as this must be robust and provide reliable and consistent information.
1.2
Objectives and Planning
Since its inception, the NETS system has been developed only in its functional aspect, with little focus on fault tolerance, i.e., any anomaly within the monitoring infrastructure could mean the interruption or discontinuation of its operation.
The work developed within our project was focused on achieving improvements in the following areas:
1. Visualization: in order to enhance the operation of the current system and the implementation of changes in the architecture, it is proposed to extract and expose in a clear and visible way, metric panels with indicators considered relevant; 2. Single node fault tolerance: it is essential to minimize the number of faults, and
identified faults should be treated as soon as possible to ensure the continuity of service with the least possible loss of consistency;
3. Introduce redundancy: the NETS system is currently supported by a single phys-ical machine, which represents a single point of failure (SPOF). To achieve this goal, new architectures should be designed and analyzed to introduce redundancy and implement an architecture with at least two physical machines.
Therefore, to achieve these improvements, the work encompassed the following ac-tivities:
1. Study the existing NETS platform, identifying weaknesses and potential sources of failures;
2. Produce software that extracts relevant metrics from the system to monitor its sta-tus;
3. Define solutions to the problems identified during analysis;
4. Implement the best suited solutions to the system;
5. Test solutions.
In short, the overall objective was to achieve a more robust and fault tolerant system whose availability and consistency are maintained even in the presence of anomalies. In the event of a system failure, the system detects this failure, logs relevant information and attempts to recover from the failure and return to a working state with the least disruption possible. In addition, the implementation of fault tolerance solutions based on redundancy allows the achievement of the intended robustness.
Chapter 1. Introduction 3
1.3
Contributions
The main contributions to improve the existing NETS system were the following:
• The source code of each component was thoroughly analyzed to correct software bugs and code refactoring in order to improve its performance. This analysis was also useful to learn what each component does, how he does it and its dependencies; • New versions of several applications used in the NETS system were available, de-livering better performance, stability and more features. Their update required code refactoring and some adaptations but the benefits were considered to be worth the extra work;
• The NETS system is constituted by a variety of components, in which the failure of a single one can potentially nullify the entire operation. Given that continuous op-eration is a requirement, each component began to be monitored and, if any should fail, they are restarted in order to return to a correct working condition;
• Several software applications were developed to test, monitor and report the NETS system. Testing the system required developing an application that simulates the incoming sources, in order to easily perform case studies and learn the system’s per-formance capabilities. The monitoring and reporting software were implemented to improve the monitoring of the NETS system and to log its state and changes when a failure is detected in order to enable a better analysis and understanding of the fault’s origin and details.
• Redundancy was introduced making the system fault tolerant. This required an extra physical machine and a careful analysis of how the incoming stream of events, the data processing and produced outputs are treated with the new architecture.
1.4
Document Structure
This document is structured in the following way:
Chapter 1 – Introductory chapter describing the objectives, motivation, a brief sum-mary of the NETS project and the document structure;
Chapter 2 – A review of concepts related to the project area, ranging from monitoring and real time systems to a broad view of concepts and techniques used in fault tolerant computer systems.
Chapter 3 – Contains the analysis of the NETS system, architecture and applica-tions/solutions used;
Chapter 4 – The proposed improvements and solutions are presented in this chapter, along with a review of their advantages and disadvantages;
Chapter 1. Introduction 4
Chapter 5 – The resulting implementations based on the solutions presented in the previous chapter are described here along with their details and review;
Chapter 6 – This chapter portraits a comparison of the system state between ma-jor improvements/milestones, showing the differences and benefits accomplished by the implementations made on the system;
Chapter 7 – The final remarks and conclusions are presented in this chapter. In ad-dition to a summary of the work done, some possibilities for future work are presented, what needs to be done and what could be improved.
Chapter 2
Related Work and Technologies
In this chapter we will review theoretical concepts and technologies relevant to the project. Some of the topics covered include monitoring concepts, how it can be done and some of its strategies, real-time systems, which types and characteristics of each one, and fault tol-erance, detailing dependability concepts, fault classification, strategies and mechanisms used, as well as redundancy and its place and importance in fault tolerance.
2.1
Monitoring Concepts
”Monitoring of a computer system is defined as the process of obtaining the status and configuration information of the various elements of a com-puter system and consolidating that information.” D. C. Verma [58]
The NETS system supervises the wired network allowing soft real-time detection of event patterns that indicate or allow inferring suspected anomalies using flows of network equipment logs, and then forward the detected situations and their evidence to a system accessed by operational teams responsible for resolving the identified situations.
In this domain, monitoring in soft real-time enables the identification and visualization of anomalous situations in a timely manner instead of having to rely on the information released several hours later after batch processing or through channels such as customers’ complaints received via call center.
For information to be easy to see and noticeable, NETS uses metric panels to display the relevant elements in a simple way to understand, avoiding excess / showers of alarms that could undermine the monitoring of the system.
Monitoring has been discussed for a long time [3, 38, 39, 40], and its evolution grew remarkably in recent years [45, 46, 53], i.e., initially, the available tools were restricted to those provided by the operating system, such as top in Linux, ping, simple log files, etc. This type of limitation has led to the development of applications such as Nagios1
1http://www.nagios.org/
Chapter 2. Related Work and Technologies 8
and Zenoss2, created by the necessity to address the lack of monitoring software. Even though they stimulated the development of more tools dedicated to monitoring, they are renown to have some use and integration difficulties, problems that tend to be avoided and solved by the new generation of applications like statsd [19] and graphite [12], where there is an effort to decrease the learning curve and ease of operation of such tools.
Presently, the effort is focused in aggregating and exporting data to metric panels and presenting the information in a clear and noticeable way without generating too much visual clutter minimizing fatigue in the visualization of alarms.
Generic Model for Monitoring
According to [58], there are several categories of information retrievable while monitoring a system: status information, configuration information, usage and performance statistics, error information, topology information and security information. The collected informa-tion can pass through a chain of processes in order to clean the raw data, reduce its size into more manageable amounts, and generate reports to be consulted by system adminis-trators.
This chain depends on the structure of the monitoring system. Although there are many different monitoring systems and products available in the market, there is a generic structure that can describe most of them. The generic structure, illustrated in Figure 2.1, consists in five layers of monitoring functions.
Figure 2.1: Generic structure of monitoring applications.
The data collection is performed through equipment monitoring and can be achieved in two ways: Active Monitoring and Passive Monitoring [58].
• Passive Monitoring - In this type of monitoring, information is collected without introducing additional work, that is, information is available through normal op-eration of the system. The only additional traffic introduced in the network is the necessary for agents or devices to send the generated data to the system manage-ment. This approach can be used in any computer system.
Chapter 2. Related Work and Technologies 9
Some examples of information that can be sent include log files generated by ap-plications, the MIB3, which describes the structure of the management data of a
device subsystem, and information about the network topology which is usually maintained by network protocols such as OSPF4and BGP5, among others.
This type of monitoring can generate a significant amount of useful information for the management system and there are several typical methods used depending on the environment and architecture used.
• Active Monitoring - In contrast to the passive model, this technique assumes an intrusive monitoring model explicitly requiring the direct inquiry of agents or target devices. It works by sending requests to the monitored equipments, and waiting for their response that contains the available information.
In this case, we are only inquiring for specific data which could mean lower band-width requirements, but, in contrast, there is an added network load due to the need of constantly sending requests to the device and waiting for the answers. Further-more, this method can provide information that could be difficult to obtain using passive methods.
In the NETS system, data streams arriving from agents who are sending data and messages with relevant events are considered passive, while monitoring within the NETS infrastructure, relative to processes, disk space, state of the JVM6, etc., is made actively.
According to [58], the Pre DB data processing has three main objectives: data reduc-tion, data cleansing and data format conversion.
• Data Reduction - Reducing the volume of information by reducing redundant in-formation. It can be achieved by using the following methods: aggregation, thresh-olding and duplicate elimination;
• Data Cleansing - Cleaning the data by removing erroneous or incomplete data; • Data Format Conversion - Converting the information to a format that will be
stored in the database.
The resulting output of the Pre DB data processing is then stored in the data store, usually using a commercial off-the-shelf (COTS) database solution that can have dif-ferent designs: rolling, load-balanced, hierarchical database federation, partitioned, and round-robin. The chosen database design is selected according to the expected volume of information, but it is possible to have multiple types of databases operating in the same
3Management Information Base 4Open Shortest Path First 5Border Gateway Protocol 6Java Virtual Machine
Chapter 2. Related Work and Technologies 10
system to distribute the data load or handle different types of information, for example, one database for performance statistics and another for security information.
The Post DB Data Processing is responsible for analyzing the collected information and decide what is relevant to be reported. For instance, it correlates information from different sources, and uses patterns to determine specific alarm situations.
The last section is Reporting, which can be composed by viewing consoles and mon-itors that present the information in a simple and effective way, enabling system adminis-trators to effectively visualize the monitored system’s state.
2.2
Metrics and Measurements
”It is not the strongest of the species that survives, nor the most intelli-gent, but the one most responsive to change.” Charles Darwin
Metrics can be defined as a system of parameters or ways of quantitative and peri-odic assessment of a process that is to be measured, along with the procedures to carry out such measurement and the procedures for the interpretation of the assessment in the light of previous or comparable assessments. For example, they can represent the number of failures of a certain component, the load of a system, latency, etc., indicating how well behaviors and processes are functioning, as well as their performance while highlighting areas for improvement (weaknesses) and strengths within the system.
Monitoring can use metrics to diagnose problems, point to solutions, respond appro-priately to change and allocate resources accordingly. But it is very important to know what information to retrieve and how often to collect it, which can introduce significant changes in the architecture of our monitoring system. While we may retrieve all imagin-able metric every second, it may overload the network and make the metric panels more complex than necessary. On the other hand, if we retrieve too little or erroneous informa-tion it may harm our system rather than properly monitor it [58].
Some of the available techniques used in monitoring systems to aggregate and order data sets are listed below. Each one has its usefulness depending on the objective, values in question and situation.
The average is a standard aggregation technique which alone might not be useful depending on the objective, because two sets can have completely different values but with the same average. I.e., the set 3,3,3,3,3 possess the average value of 3, and another set 1,2,3,4,5 has the same average as the previous.
Using the median we can get more detail compared with the average, given that it separates the set in half after being ordered, indicating the values which separate the upper and lower half, resulting in a value closer to the typical value because it does not undergo many changes if there are many disparate values.
Chapter 2. Related Work and Technologies 11
The standard deviation measures the dispersion of a data set in relation to their av-erage, that is, if the values are all very close it will have a low standard deviation, instead of a data set with a highly dispersed set of values, which will have high standard devia-tion. It can be used along with the average as a complement, there are several probability distributions that are characterized by the average and standard deviation, e.g., Gaussian distribution.
The percentile is a measure used in statistics indicating the value below which a given percentage of observations in a group of observations fall. For example, the 20th percentile is the value (or score) below which 20 percent of the observations may be found. There are three special percentiles called the quartiles which divide the data into four groups of equal size, the 25th percentile is also known as the first quartile (Q1), the 50th percentile as the median or second quartile (Q2), and the 75th percentile as the third quartile (Q3).
The summary of the five numbers [21] is a descriptive statistic that represents infor-mation obtained from a number of observations, being necessary to have the percentages based on a random variable measured on a scale. It is composed of five percentiles, minimum sample, lower quartile, median, upper quartile and maximum sampling. This technique provides a concise summary of the observable distribution, being suitable for ordinal measurements, intervals and ratios.
Besides statistical concepts, time series analysis comprises methods for analyzing data in order to extract meaningful statistics and other characteristics of the data. It shows the variation over a period of time, noting a measured value at specific intervals. This type of observation should consist in a sufficient and meaningful time window to obtain visible and relevant data. The data analysis requires its aggregation and to be temporally ordered, and there is a large dependence on the time in which they occur. It’s an analysis technique suitable for forecasting taking into account historical series.
2.3
Real-Time Systems
”Real-time System – system whose progression is specified in terms of timeliness requirements dictated by the environment” P. Ver´ıssimo [57]
In terms of real-time systems, we have three distinct classes as we can see in [36, 57]: Hard Real-Time - Systems of this class have to avoid any kind of time failure and can have catastrophic consequences when one happens. Example: On-board flight control system (fly-by-wire7).
7Fly-by-wire (FBW) - A system that replaces the conventional manual flight controls of an aircraft
with an electronic interface, where the movements of flight controls are converted to electronic signals transmitted by wires (hence the fly-by-wire term).
Chapter 2. Related Work and Technologies 12
Mission-critical Real-Time - Such systems should avoid time failures, where occa-sional failures are treated as exceptional events. Example: Air-traffic control system.
Soft Real-Time - In such systems, occasional failures are accepted and do not cause major problems. Example: Online flight reservation system.
Regarding monitoring systems, they can perform their operation in real-time and be-long in one of the above mentioned classes, or, alternatively, perform in an off-line manner through batching or with large time intervals, e.g., hourly or daily.
Off-line monitoring can be used in contexts where the systems being monitored do not require immediate action should an alarm be triggered or and anomaly detected. While real-time monitoring systems allow a constant and continuous visualization of the moni-tored metrics, and enable the prompt detection of behavior deviations, outliers and warn-ings depending on what is being monitored. This also provides the chance to resolve the issue or forward to the appropriate field technicians enabling a faster corrective action.
2.4
Fault Tolerant Computing and Dependability
Con-cepts
In this section we present and explain the main concepts for fault tolerant distributed systems, dependability and strategies to achieve robust systems.
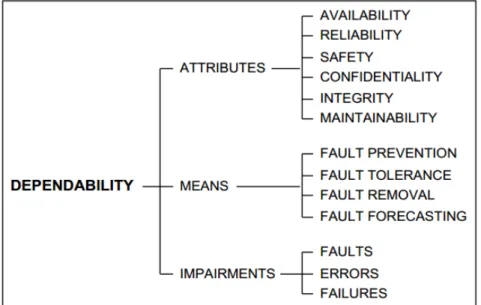
In Figure 2.2 we can see a summarized view of the notions that will be introduced, grouped in three classes, attributes, means and impairments. These concepts are an im-portant basis to enable the improvement of a system’s dependability which is one of this project’s main goals.
Chapter 2. Related Work and Technologies 13
2.4.1
Dependability
”Dependability – the measure in which reliance can justifiably be placed on the service delivered by the system” J.-C. Laprie [34]
The dependability of a computer system is the ability to avoid system failures that are more frequent and more severe than acceptable [4]. Some of the biggest threats are faults, errors and failures. Next is a list of attributes that can be assessed to determine the dependability of a distributed system, as seen in [57, 34]:
Reliability – the measure of the continuous delivery of correct service, can be ex-pressed by the mean time to failure (MTTF) or mean time between failures (MTBF);
Maintainability – the measure of the time to restoration of correct service and can be expressed by the mean time to repair (MTTR);
Availability – the measure of the delivery of correct service with respect to the alter-ation between correct and incorrect service, it is expressed as MTBF / (MTBF + MTTR); Safety – the degree to which a system, upon failing, does so in a non-catastrophic manner;
Security – The measure of guarantees in terms of confidentiality, integrity and avail-ability in service provision;
Integrity – Absence of improper system alterations; Resilience – The ability to tolerate and recover from faults.
The most important aspects that will be addressed in this project will mainly focus in improving a system’s reliability, availability and resilience. This is accordingly to the requirement of delivering a continuous and correct service (monitoring) even in the presence of faults.
2.4.2
Faults Classification
A failure means that the system presents an incorrect or abnormal behavior, resulting as a deviation from its regular service delivery. These failures result from errors, which are symptoms of existing system faults, representing invalid system states that should not be reached. A single fault can spawn multiple errors and consequently multiple system failures and a failure can range from different types of faults and even the combination of some of them.
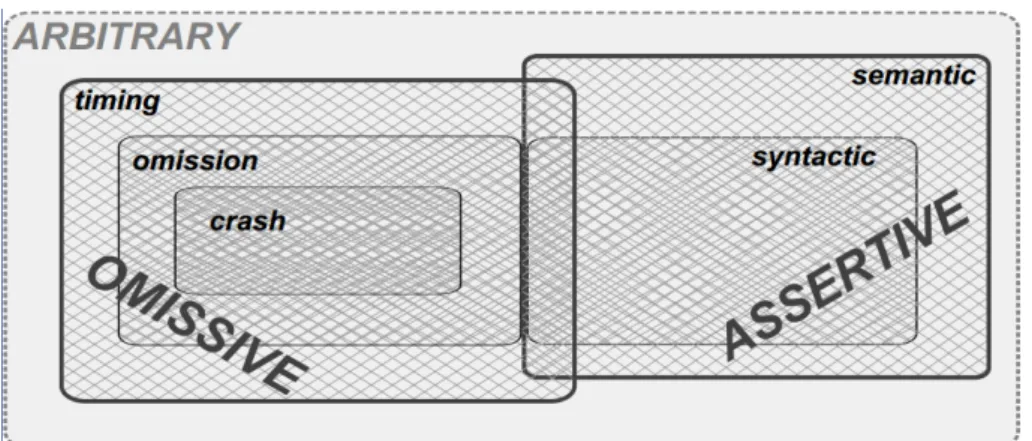
The relationship between fault classes can be seen in Figure 2.3, where it is visible that some classes contain others, meaning that if a system tolerates a more general class, it can assume that it tolerates the faults of the contained classes.
Faults can be classified according to different criteria, such as their characteristics and how the component behaves once it has failed [57]. They can be independent faults, attributed to different causes, or related faults associated to a common cause, usually
Chapter 2. Related Work and Technologies 14
Figure 2.3: Relationship between fault classes.
originating common-mode failures which is the result of one or more events, causing coincident failures in multiple systems, e.g., single power supply for multiple CPUs, sin-gle clock, sinsin-gle specification used for design diversity [33], etc.
In relation to the domain, they can be hardware or software faults. Design faults oc-cur more frequently in software than in hardware because of the difference in complexity between these two domains. This can be explained by the difference in internal states, as the hardware machines have a smaller number comparing to software programs [48, 49].
Regarding persistence, faults can be classified as permanent or transient. Hardware faults can be be of both kinds, but a software fault is always permanent. Software faults that appear transient are in fact permanent software faults with a complex activation pat-tern, which limits its reproducibility if it cannot be identified.
The most benign class of faults belong to the omissive fault group: they occur essen-tially in the time domain when a component does not perform an interaction as it was specified to do.
• Crash faults – Occurs when a given component permanently halts its operation, or never returns to a valid state;
• Omission faults – When a component occasionally omits an action, failing to per-form its service;
• Timing faults – Occur when a component is late or does not perform its service on time.
On the other hand, assertive faults belong in the value domain, and are characterized by a component performing an interaction in a manner that was not specified.
• Syntactic – When the value’s format is incorrect, e.g., a temperature sensor show-ing “+Ad” degrees;
Chapter 2. Related Work and Technologies 15
• Semantic – When the format is correct, but the value is not, e.g., a temperature sensor showing 26oC when it is snowing.
The last class is byzantine and arbitrary faults, being a combination of the omis-sive and assertive faults, are the most dangerous and hardest to tolerate, usually involving heavy and complex techniques to face them successfully. In this case, the system is as-sumed to fail in any manner of way, possibly resulting in erratic behavior from processes, not following protocols, send contradictory messages, etc.
In general byzantine fault tolerance in a monitoring system is unnecessary given its non critical nature. But a continuous and correct delivery of service is expected. To this end, there is a great focus on treating crash and syntactic faults, without undervaluing the remainder types of faults.
2.4.3
Strategies and Mechanisms
To obtain a more reliable solution and increase the time between failures we can use some strategies and mechanisms that enable prevention, tolerance, removal and forecasting of faults [57, 4]. The use of these strategies and mechanisms should be encouraged in order to maximize the reliability of computer systems.
The impairments to dependability are faults, errors and failures. They are not desired and appear unexpectedly, causing and resulting in undependable states [34]. In particular, the complete elimination of software design faults is very hard through fault prevention and removal. Additionally, hardware faults, either permanent or transient, may happen during system operation. Therefore, only fault tolerance can cope with residual software faults and hardware operational faults. In the monitoring scope, fault prevention and removal are irrelevant whereas fault forecasting can be useful, but our main focus is in fault tolerance.
Fault Tolerance – Continuous operation despite the presence of faults. There are several mechanisms that can help a system to guarantee such capability:
• Error Detection – It targets the immediate detection of errors in order to con-tain them, avoiding propagation and triggering recovery and fault treatment mech-anisms. It can be reactive, detecting and reporting error at run-time, or proactive, whose detection and report is done at development time.
• Fault Recovery – The main goal is to restore the system to a state without faults / errors [32].
• Fault treatment – Aims at preventing faults from being reactivated.
The main concern is having active redundancy through fault masking or semi-active redundancy using error detection and forward recovery.
Chapter 2. Related Work and Technologies 16
Using fault masking it is expected that the system has enough redundancy to deliver a correct service without any noticeable glitch, whereas error detection would reactively trigger forward recovery causing the system to move forward to a predictable and ensured correct state. Either way, faults treatment can be performed by reinitializing key software components.
2.4.4
Redundancy
”A key supporting concept for fault tolerance is redundancy, that is, ad-ditional resources that would not be required if fault tolerance were not being implemented.” Laura L. Pullum [47]
The use of redundancy is fundamental to fault tolerance. It consists in the utilization of additional resources that are not required for normal system operation. In computer systems, redundancy can be applied in the space, time and value domains [57, 47].
• Space Redundancy - Consists on having several copies of the same component, e.g., storing the information on several disks, different nodes computing the same result in parallel, disseminating information along different network paths, etc.
• Time Redundancy - Consists in doing the same thing more than once, in the same or different ways, until the desired effect is achieved, e.g., the retransmission of a message to tolerate possible omissions, repeating computations, etc.
• Value Redundancy - Consists in adding extra information about the value of the data being sent or stored, e.g., parity bits and error correcting codes can be added to detect / correct data corruption.
In the present context, we will disregard time and value redundancy because they are not a requirement in this monitoring scope, and will focus on space redundancy. For example, it is necessary to have copies of the system’s nodes in order to avoid losing state and prepare it for possible node faults, at which point a spare node will take over the operation minimizing the system’s unavailability while the faulty node recovers.
2.4.5
Common-Mode and Common-Cause Failures
”A Common-Mode Failure is the result of an event(s) which because of dependencies, causes a coincidence of failure states of components in two or more separate channels of a redundancy system, leading to the defined systems failing to perform its intended function.” Bourne et al.[6]
Chapter 2. Related Work and Technologies 17
The benefits of duplicating components can be defeated by mode and common-cause failures. Common-common-cause failures are multiple component failures having the same cause, and common-mode failures is when an event causes multiple systems to fail. These types of failure happen when the assumption of independence of the component’s failure is invalid.
Common-cause failures can occur owing to common external or internal influences. External causes may involve operational, environmental, or human factors. The common cause may also be a (dependent) design error internal of the supposedly independent components.
• Design Diversity - To protect against common design errors, components with a different internal design (but performing the same function) may be used. This approach is called ”design diversity”[44]. Multiple versions of software that are written from equivalent requirements specifications are examples of design diver-sity. That is, the component requirements are the same, but the way the requirement is achieved within the component may be different.
Two pieces of software that compute a sine function but use different algorithms to do so are an example of design diversity.
• Functional Diversity - A second type of diversity called ”functional diversity”, involves components that perform completely different functions at the compo-nent level (although the compocompo-nents may be related in that they are used to satisfy higher-level system requirements). The crucial point is that the component require-ments are different.
In the case of software, functional diversity means that the behavioral requirements for the software are different. For example, one program may check to see whether two numbers are equal and another, functionally diverse program, might select the larger of two numbers.
Common-mode and common-cause failures can effectively halt a monitoring system’s operation, therefore, it is important not to undervalue mechanisms and techniques that can aid in their treatment. For example, the input volume of a monitoring system is generally high, but it can take a single faulty message to potentially render every machine belonging to the system unavailable by crashing or generating an exception on them.
2.5
Existing Monitoring Solutions
Currently, there is a wide array of options and tools available to perform monitoring on computer systems and networks, process logs, manage messages, etc., both commercial and open source. This section presents some of the most relevant tools or solutions that could relate with the NETS system’s work.
Chapter 2. Related Work and Technologies 18
2.5.1
Nagios
Nagios was initially released in 1999, making it one of the oldest applications of its genre. It works as an overseer/monitor constantly regulating and monitoring the health of hardware, software and the network using SNMP8 as the default communication pro-tocol. Nagios can monitor parameters such as system status, if it is up and running, CPU/memory/disk usage etc., service status, whether a service is up and running, e.g., DNS, Web Server, mail server, etc., and other factors including room temperature, hu-midity, among others. Nagios can generate alerts through SMS/email when the monitored parameters exceed previously set thresholds.
The Nagios application is split in different parts, the main application is responsible for scheduling and executing the service checks in a concurrent fashion, while maintaining all state information and taking action when transitions require it. Additionally, the checks are called Nagios plugins and are available separately, in which their use is recommended but not necessary as they can be developed locally. The core add-ons include Nagios Remote Plugin Executor (NRPE) and Nagios Service Check Acceptor (NSCA). The first is used to execute indirect checks locally on target hosts, and the NSCA enables passive monitoring, where Nagios is split into client and server application.
The usage of Nagios by PT Comunicac¸˜oes is restricted to its usual objective which is monitoring computer systems, networks and infrastructures. But for the project at hand, it has too many useless features, lacks correlation capabilities, and requires installing software for the remote monitoring and script executor which is not an option given some of the monitored equipment cannot be modified.
2.5.2
Zenoss
Zenoss is a monitoring solution similar to Nagios, includes features like automatic host discovery / monitoring providing time series graphs on performance, event management which normalizes data into events allowing users to set alarms based on the frequency of an alert, it is ready for Syslog monitoring and SNMP/SSH.
The functional similarities between Nagios and Zenoss also mean that its usage by PT Comunicac¸˜oes would be limited to its natural scope, therefore, it is not a good candidate for the project.
2.5.3
Sensu
Sensu9 is a monitoring framework written in Ruby 10 that aims to be simple, malleable and scalable. Sensu schedules the remote execution of checks and collects their results;
8Simple Network Management Protocol - http://www.snmplink.org/ 9http://sensuapp.org/
Chapter 2. Related Work and Technologies 19
uses RabbitMQ11 to route check requests and results. Checks always have an intended target, servers with certain responsibilities, such as web servers or data storage. A Sensu client has a set of subscriptions based on its server’s responsibilities; the client will ex-ecute checks that are published to these subscriptions. A Sensu server has a result sub-scription where the clients publish their checks results.
Sensu has a messaging oriented architecture in which messages are JSON12 objects,
the ability to re-use existing Nagios plugins or other written in any language, it also sup-ports sending metrics to various backends (Graphite13, Librato14, etc.).
This framework is an open source solution that has been actively developed in the last years. At the time of the project’s creation it was not in a stable condition and lacked the required features. As of now, it still would not bring any advantages to the NETS system while having costs associated with its adoption.
2.5.4
TRONE
This project15 is part of a collaboration between the University of Lisbon, University of
Coimbra, Portugal Telecom and Carnegie Mellon University, and aims to solve problems associated with cloud infrastructure, ensuring persistent operations while tolerating acci-dental and malicious faults, and monitoring of the processes in an accurate and reliable way.
To achieve these objectives, the approach taken was the preparation of a robust archi-tecture with fault diagnosis and automatic fast reconfiguration.
One of TRONE’s components is the Fit Broker, whose implementation is in the pro-totype stage, following an approach of Publish / Subscribe, replication state machines using the platform BFT-SMaRt 16, public-key encryption, event channels with support
for quality of protection (QoP) and quality of Service (QoS) with different levels of fault tolerance, publicizing the ability to handle large volumes of data, little intrusiveness and ease of integration.
This project was taken into account given it seemed to fit the NETS system context, especially the FIT Broker as a replacement for the NETS’s message broker, RabbitMQ. After a detailed analysis we found little gains in its adoption. The main advantage was the addition of intrusion tolerance, which is not the focus of this project, and there were disadvantages regarding the broker performance because of the complexity inherited by its algorithm, and the cost of adopting it.
11http://www.rabbitmq.com/ 12JavaScript Object Notation 13http://graphite.wikidot.com/ 14https://metrics.librato.com/ 15http://trone.di.fc.ul.pt/
Chapter 2. Related Work and Technologies 20
2.6
Summary
This chapter introduced the definitions and context that will be the base of the project’s work, including: a review of what is monitoring and how metrics and measurements take part in that process, a brief definition of the different types of real-time systems and the dependability and fault tolerance concepts that will be the main focus of the project’s work.
Additionally, we perform a survey of related technologies that currently exist in the market characterizing them in terms of its monitoring type, real-time class and what met-rics are treated. The objective of this survey was to present the solutions that are available, justifying why they were not used by PT Comunicac¸˜oes and, instead, motivated the cre-ation and development of the NETS project.
Chapter 3
NETS System Analysis
This chapter presents an in-depth analysis of the NETS system aiming to improve it with respect to dependability, by applying fault tolerance solutions. The tools used within the system will be reviewed describing their purpose, the physical and software architectures are detailed and pictured, and a section dedicated to fault modeling and testing will iden-tify some of the cases that need to be solved.
3.1
Methodology
The methodology consisted in:
– Analyzing the system’s characteristics: its architecture, components and software; – Translating the analysis into diagrams, picturing: the physical and software
archi-tecture, data flow, processes’ use cases and dependencies;
– Developing software to aid in testing, monitoring, and injecting faults in the system; – Executing performance tests to establish the system’s capability bounds;
– Reviewing the reliability and recoverability of components, testing their resilience to fault injection and verifying, in case of failure, the consequences to the system; – Analyzing fault tolerance mechanisms implementable in the system;
– Implementing and testing the chosen solutions;
– Comparing the system between milestones in order to expose the advantages and improvements made possible through the implementations in the system;
3.2
NETS System Tools
This chapter will present and describe the software choices that were made when the NETS project was designed to support the system’s architectural solution. Therefore, they were already integrated in the system at the time of this analysis.
Chapter 3. NETS System Analysis 24
3.2.1
logstash
Logstash [25] is an open source tool for event and log files management and process-ing. It can be used to aggregate, analyze and store log files for later use. One of the key concepts of this application is functioning in a three stage pipeline, input, filters and out-put, that is, the events are received by the inputs, modified by the filters and transmitted through the outputs. There is a wide variety of both inputs and outputs, e.g., AMQP1,
elasticsearch [15], snmptrap, sqlite, TCP, UDP, etc. available for use.
3.2.2
RabbitMQ
RabbitMQ [20] is an open source message broker software written in Erlang [16], a pro-gramming language used to build scalable soft real-time systems with requirements on high availability and fault tolerance, that implements the AMQP.
RabbitMQ offers a variety of features that allows one to trade off reliability for per-formance, including persistence, delivery acknowledgment and high availability through clustering. It has flexible routing, as messages are routed through exchanges, which can be bound to one or more queues and are responsible for delivering the messages to the relevant queues depending on the data. After that, the consumers can pool the queues for data. It has a built in capability to form clusters on a local network, forming a single logical broker. It is equipped with an API with options to show information that include the currently open connections, exchanges/queue list, exchanges/queue size, etc. and a web interface.
3.2.3
Esper
Esper [17] is an open source event driven correlation engine written in Java created for financial systems. Correlation rules are described in syntax similar to SQL2, supporting
patterns that are defined and used in the detection of pre-defined situations.
In order to interface with the “outside world”, Esper also provides an extensible library (EsperIO) of plugins for reading and writing events using protocols such as HTTP 3,
JMS4, AMQP and CSV5files.
3.2.4
Graphite
Graphite [12] is an open source tool for monitoring and graphing the performance of computer systems. Graphite collects, stores, and displays time series data in real time
1Advanced Message Queueing Protocol - http://www.amqp.org/ 2Structured Query Language - http://www.sql.org/
3Hypertext Transfer Protocol 4Java Message Service 5Comma Separated Values
Chapter 3. NETS System Analysis 25
using round robin databases [58], providing a web interface and API to both generate graphics and extract values and claims to scale both horizontally and vertically. Uses a naming scheme based dot notation (e.g. “metrics.hostname1.cpu.avg”), and has an API to send data through TCP.
3.2.5
Statsd
Statsd [19] is a daemon that listens for metric measurements on an UDP port and aggre-gates them, outputting statistics to another service such as Graphite. It works by using buckets for each stat (which has a value, typically an integer) and periodically computes the aggregation after a configured flush interval. There are various types of metrics, in-cluding counters, timers and gauges. It is an open source solution.
3.2.6
Monit
Monit [37] is an open source utility for managing and monitoring, processes, programs, files, directories and file-systems on a UNIX system. Monit conducts automatic mainte-nance and repair and can execute meaningful causal actions in error situations.
Contrary to many monitoring systems, Monit can act if an error situation should occur, e.g., if sendmail is not running, Monit can start sendmail again automatically or if apache is using too much resources (e.g. if a DoS attack is in progress) Monit can stop or restart apache and send you an alert message. Monit can also monitor process characteristics, such as how much memory or cpu cycles a process is using.
Monit can also be used to monitor general system resources on local-host such as overall CPU usage, Memory and Load Average.
Additionally, Monit can be expanded with M/Monit, increasing its capabilities and providing monitoring and management of all Monit enabled hosts via a modern, clean and well designed user interface which also works on mobile devices.
3.3
NETS Architecture
This section explores the architectural details of the NETS system, describing the advan-tages and capabilities of the currently used tools and an analysis of the components that constitute it.
3.3.1
Physical View
The NETS system was originally designed to be based on a single physical machine (Figure 3.1) running two VMs6 related to the system, one for data processing and the other as the metrics repository.
Chapter 3. NETS System Analysis 26
The communication between the virtual machines is performed entirely within this physical machine without requiring an actual network, and only consist in metrics being sent from the processing VM to the metrics VM. Apart from that, there are only two data flows: one arriving to the NETS system from the sources and the other is the outgoing alarms generated by the NETS system that are sent to the Sistema Geral de Alarmes (SGA)/Web-server.
Regarding fault tolerance, the physical machine has no mechanisms in use. There is no auxiliary power source, redundant network access or even hardware replication / backups.
The failure of the physical machine or the processing VM halts the system and nullifies the system’s work and objective.
Figure 3.1: NETS Physical View.
3.3.2
Software View
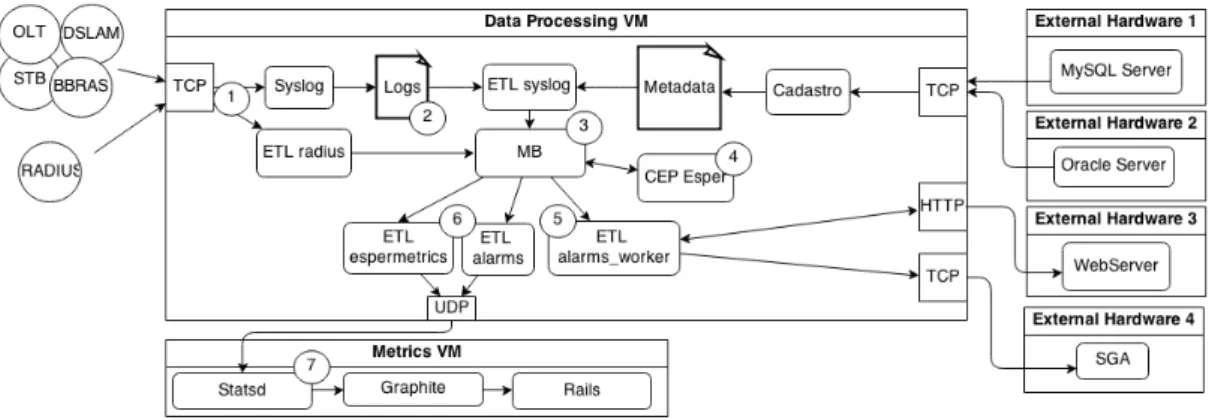
The software architecture is illustrated in Figure 3.2, and the following description has key points related to this image in order to aid in its visualization.
Figure 3.2: NETS Software Architecture.
The virtual machine responsible for data processing receives data via TCP (1), they have two distinct types: one according to syslog’s standards which are stored in log files,
Chapter 3. NETS System Analysis 27
and the other type is relative to RADIUS messages. Both types of data are managed by the ETL7application, logstash, described in Section 3.2.
The ETL application is responsible for extracting the data from outside sources (log files) (2), transforming it to fit operational needs and send the result to the message broker (3), RabbitMQ, which in turn, communicates with the event processing engine (4), Esper, responsible for correlating events and alarms generation. In the end, the ETL applica-tion is responsible for sending the generated alarms to an external system (5), general alarms system (SGA - Sistema Geral de Alarmes), and related statistical information to the metrics repository (6) which is housed in the second virtual machine (Figure 3.1).
The metrics repository handles all the statistical data and measurements (7), which in turn can be visualized through graphical tools and a web back-end, enabling a constant monitoring of the current and historical states of the system.
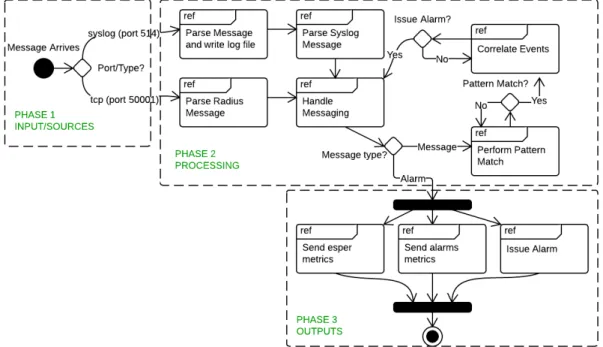
The analysis of the NETS system life-cycle revealed the existence of three distinct phases, namely the Inputs phase, the Processing phase and the Outputs phase. Those phases are highlighted in Figure 3.3 along with the data flow within the data processing virtual machine. The remainder and complementary UML8diagrams can be consulted in
Appendix A.
Figure 3.3: NETS Operation Phases.
7Extract, transform, load 8Unified Modeling Language
Chapter 3. NETS System Analysis 28
3.3.3
First Phase - Inputs
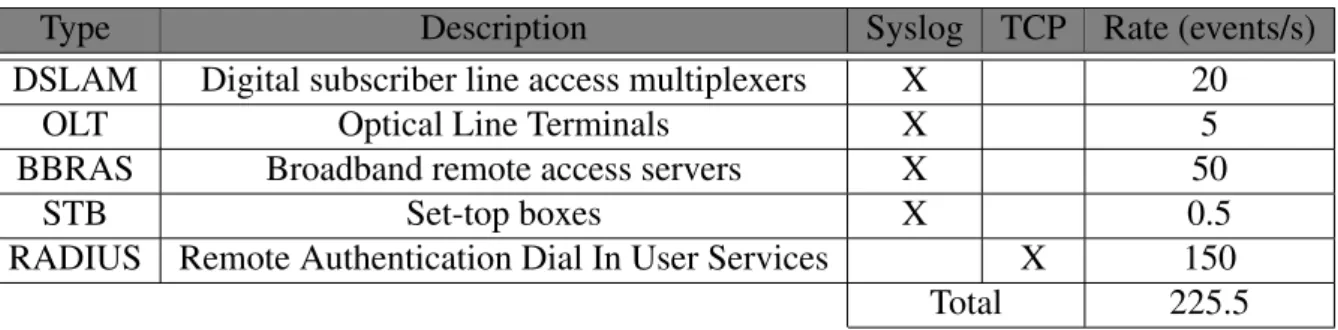
The first phase is mainly composed by receiving events sent by network devices through Syslog and TCP. These events have soft real-time requirements (Chapter 2.3) given that there are limited bounds to their use and validity, and they can be of five different types which are detailed in Table 3.1 along with their expected rate of arrival and description.
The events arriving by TCP go directly to ETL radius, whereas the ones received by Syslog are written do disk files, which are accessed by ETL syslog to parse them.
Type Description Syslog TCP Rate (events/s) DSLAM Digital subscriber line access multiplexers X 20
OLT Optical Line Terminals X 5 BBRAS Broadband remote access servers X 50
STB Set-top boxes X 0.5
RADIUS Remote Authentication Dial In User Services X 150 Total 225.5 Table 3.1: NETS Source types and volumes.
3.3.4
Second Phase - Processing
The second phase is comprised by events processing and alarms generation. Events are received, transformed and correlated to generate alarms in pre-configured cases. The process is explained in detail below, with the steps taken by each application.
• Cadastro
Runs once a day to build client base information, writing the resulting meta-data to disk files.
• Extract Transform Load (ETL) – logstash
ETL syslog parses messages from log files written by Syslog extracting relevant information to be sent to MB RabbitMQ using the meta-data file previously written by Cadastro to resolve the client’s unique identifiers.
ETL radius parses TCP messages extracting relevant information to be sent to MB RabbitMQ.
ETL alarms and espermetrics send statistical information to the metrics repository. ETL alarms worker sends generated alarms to the SGA and complementary infor-mation to the external web-server.
Chapter 3. NETS System Analysis 29
The message broker serves as the main connection between components, behaving as a consumer from phase 1 processes, receiving parsed messages from ETL syslog and ETL radius, and as a producer for phase 2 processes, producing messages to be consumed by ETL espermetrics, alarms and alarms worker.
• Complex Event Processing (CEP) – Esper
Esper’s sole responsibility is to correlate the received events, generating alarms under pre-configured circumstances, i.e., a client that is constantly connecting and disconnecting or several clients breaking up at roughly the same time and location will raise an alarm.
3.3.5
Third Phase - Outputs
The third and last phase is the output of the generated alarms. Alarms are divided in two parts. One that is sent to the SGA9 through TCP, with the basic information required to initiate corrective measures. The second part is sent to an external web-server, by HTTP, with the evidences that support and justify the generation of the alarm itself and, this information is kept for future reference and consultation.
Parallel to this operation, statistical data is sent to the metrics repository for visualiza-tion and system monitoring.
With this information and having identified the dependencies between components, we designed diagrams that represent the software architecture (shown in Figure 3.2) and the operation phases (Figure 3.3) of the NETS system with the relationships and depen-dencies between components.
3.4
Fault Modeling
Fault modeling helps to identify targets for testing, making the analysis possible through experimentation and simulating modeled cases. After producing the architecture diagram, we started modeling the possible failure cases in the system’s components.
3.4.1
Stream of Events
Assumption/Requirement: There is a constant and regular stream of events. Fault: The rate of arrival is higher than the regular load.
Fault: The rate of arrival is null.
Chapter 3. NETS System Analysis 30
3.4.2
Syslog
Assumption/Requirement: Syslog is always active, handles several sources of events, writing received events to disk in the form of log files.
Fault: Syslog crashes
Fault: Syslog corrupts messages Fault: Lack of Disk Space
Fault: Log files are deleted/corrupted
3.4.3
ETL syslog
Assumption/Requirement: ETL syslog is always active Fault: ETL syslog crashes
Assumption/Requirement: ETL syslog receives a constant stream of events Fault: Load is above regular level
Fault: Load is below regular level or null
3.4.4
ETL radius
Assumption/Requirement: ETL radius is always active Fault: ETL radius crashes
Assumption/Requirement: ETL radius receives a constant stream of events Fault: Load is above regular level
Fault: Load is below regular level or null
3.4.5
Cadastro
Assumption/Requirement: Cadastro is generated once a day, and serves as a database for client information and to cross reference data received in events to identify uniquely the respective client.
Fault: Lack of Disk Space
3.4.6
MB RabbitMQ
Assumption/Requirement: RabbitMQ is always active, serving as the central message passing component, having a bridge like function linking the several components together, from ETL to CEP and back.
Fault: MB RabbitMQ crashes Fault: MB RabbitMQ high load Fault: Lack of Disk Space
Chapter 3. NETS System Analysis 31
3.4.7
CEP Esper
Assumption/Requirement: CEP Esper is always active and handles the event correlation to generate relevant alarms under specific conditions, it is a critical component due to being the sole responsible for the alarms generation.
Fault: CEP Esper crashes
3.4.8
ETL espermetrics and ETL alarms
Assumption/Requirement: ETL espermetrics and ETL alarms are always active and are consumers of MB RabbitMQ, processing statistical data and sending it to the metrics repository.
Fault: ETL espermetrics/alarms crashes
3.4.9
ETL alarms worker
Assumption/Requirement: ETL alarms worker is active and is responsible for sending the generated alarms to the SGA where they will be handled by operational teams. The details and link of alarms’ information is sent to the external web-server.
Fault: ETL alarms worker crashes
Fault: The SGA or the external web-server is not active
3.5
Fault Testing
Fault testing is performed based on the modeling made in the previous section. Faults were injected in the NETS system to simulate the described cases in order to register the behavior and consequences in each situation.
3.5.1
NETS Normal State With Regular Load
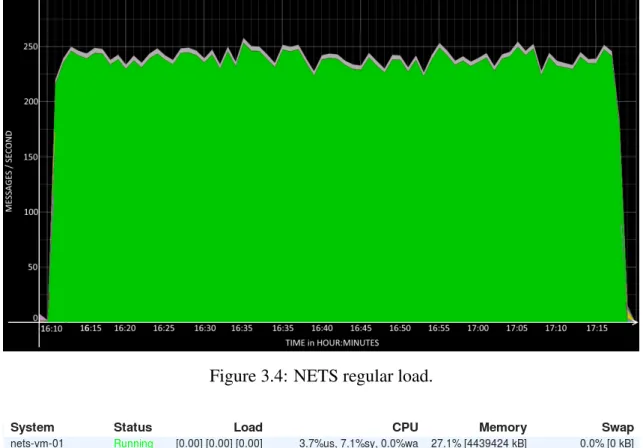
The system’s state under regular load was outlined in order to have a point of comparison. In Figure 3.4 is shown the amount of messages received which is in accordance with the information already provided in Table 3.1, i.e., there is an average of 225-240 messages per second arriving to the system. This value has an expected fluctuation directly related to the time of day, e.g., at night the number of events is lower than in the morning or noon. In Figure 3.5 we detail the use of resources under regular load, i.e., the amount of CPU and memory used by each process.
A constant flow of events is expected as a natural consequence of network activity, both considering normal user actions and abnormal activities.
Chapter 3. NETS System Analysis 32
Figure 3.4: NETS regular load.
Figure 3.5: NETS regular load stats.
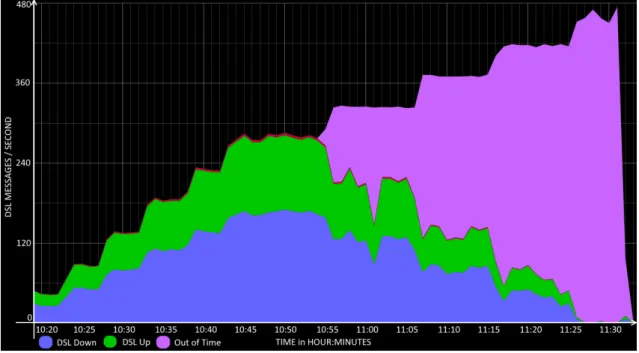
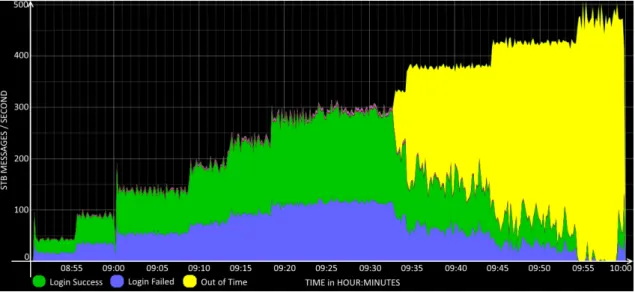
3.5.2
Stream of Events - Load Simulation
The initial tests were performed in order to explore and perceive the NETS system’s load capacities. By simulating additional load in each component and the whole system, we can draw conclusions regarding their current capacity and future viability.
It is noteworthy to say that in this test we check for failures of all types, i.e., crash faults if any component fails due to the additional load, omission faults if there is loss of messages, queue clogging, network, etc., timing faults if the components are not able to process requests in a timely manner resulting in loss of messages, syntactic and semantic faults, given the extra volume and high processing requirements which may lead to invalid messages.